198 |
PART B
. SOCIAL SCIENCES AND HUM ANITIES
w w w.ijar.eu
INTERNATIONAL JOURNAL of ACADEM IC RESEARCH Vol. 6. No. 4. July, 2014
Rusdi N. Hidayat, Suhadak, Darminto, Siti R. Handayani, Bambang W. Otok. Service quality and regional tax regulations influence taxpayer compliance intervening taxpayer satisfaction and behavior using structural equation modeling approach. International Journal of Academic Research Part B; 2014; 6(4), 198-203. DOI: 10.7813/2075-4124.2014/6-4/B.31
Library of Congress Classification: HJ2321-2323
SERVICE QUALITY AND REGIONAL TAX REGULATIONS
INFLUENCE TAXPAYER COMPLIANCE INTERVENING TAXPAYER
SATISFACTION AND BEHAVIOR USING STRUCTURAL
EQUATION MODELING APPROACH
Rusdi N. Hidayat1, Suhadak2, Darminto3, Siti Ragil Handayani3, Bambang Widjanarko Otok4
1
Doctor of Bussiness Administration Science, Brawijaya University, Malang,
2
Professor of Administration Science Faculty, Brawijaya University, Malang,
3
Doctor of Administration Science Faculty,Brawijaya University, Malang,
4Doctor of Department Statistic, ‘Sepuluh Nopember’ Institute of Technology (ITS), Surabaya (INDONESIA)
E-mails: [email protected], [email protected]
DOI: 10.7813/2075-4124.2014/6-4/B.31
Received: 08 Feb, 2014 Accepted: 09 Jul, 2014
ABSTRACT
The result showed by structural equation modeling (SEM) approach that model taxpayer compliance is a model fit with Chi-Square Test 118.967 and significant probability 0.202. The services quality (SQ) and regional tax regulations (RTR) giving an influential favorably to taxpayer satisfaction (TS). The services quality (SQ) and regional tax regulations (RTR) giving an influential positive and significant with the taxpayer behavior (TB). The services quality (SQ), regional tax regulations (RTR), taxpayer satisfaction (TS) and taxpayer behavior (TB) giving an influential favorably to taxpayer compliance (TC). The taxpayer satisfaction (TS) giving an influential positive and significant with taxpayer behavior (TB). Taxpayer satisfaction (TS) giving the indirect effects largest in services quality (SQ) against taxpayer compliance (TC).
Key words: SQ,RTR, TS, TB, TC, SEM, Goodness of Fit
1. INTRODUCTION
Taxpayer compliance (tax compliance) can be identified by the taxpayer in the compliance register, compliance to deposit return letter of Notification (SPT), compliance in the calculation and payment of taxes owed, and compliance in payments in arrears. Compliance issues become important because of non-compliance at the same time would cause an attempt avoid taxes, such as tax evasion and tax avoidance, which resulted in reduced tax deposits to the State Treasury. Taxpayer compliance substantially influenced by the condition of the system of the administration of taxation including tax service and tax enforcement. Tax administration improvements alone are expected to encourage Taxpayer compliance.
Tax collection not work easily besides an active role of officer taxation, must be consciousness the taxpayer itself. Other effort which is not less important is to raise satisfaction taxpayers through increased service quality to taxpayers. Improving the quality and quantity service will impact on improving satisfaction taxpayers so hopefully impact on compliance taxpayer in pay or pay off their obligation.
Kiswanto and Wahyudin (2007), variable that service quality at reliability, assurance, responsiveness and tangible influential positive and significantly to satisfaction taxpayers vehicles. While empathy influential positive and significant. Reliability, responsiveness, assurance, empathy and tangible existed simultaneously together influential significantly against gratification compulsory PKB in Sragen regency. Reliability have leverage our dominant against gratification compulsory PKB in Sragen regency.
Betty and Sally classify the factors related to the behavior of the taxpayer; the perception that attempt to avoid paying taxes and not been accepted in general, the attitude of the community towards the expenditure priorities of satisfaction conducted by Government, the opportunity to avoid, and the complexity of the legislation (Yurzal, 2002). The higher the level of taxpayer compliance is increasingly higher success rate of tax revenue, and will lead to the increasing success of taxation. Therefore the taxpayer compliance improvement will increase the success of tax revenue.
Baku, Azerbaijan | 199
INTERNATIONAL JOURNAL of ACADEM IC RESEARCH Vol. 6. No. 4. July, 2014
Taxpayer compliance in carrying out the obligations in the field of taxation would be very encouraging to the improvement of reception areas of the tax sector.
CFA is part of the method of Structural Equation Modeling. According to Raykov and Marcoulides (2000), the CFA is not a method to find the structure factors, but confirmed the existence of a specific factor structure. One of the advantages of Confirmatory Factor Analysis is the level of flexibility when applied in a complex hypothesis model. Methods of estimation in analysis of the Confirmatory Factors used maximum likelihood that can determine the optimal value in the factor loading.
The study was conducted on respondents in the field of business restaurant, hotel, advertisement, entertainment and parking. In this study assessed the indicators and variables that affect the quality of taxpayer services, local tax regulations, the level of satisfaction of the taxpayer, the taxpayer attitudes and theoretically taxpayer compliance, which is then compiled into a theoretical model which will be evidenced by the data field data-driven models.
Research conducted in respondents have businesses of restaurant, hotels, advertising, entertainment and parker. Indicator and variables will be discussed in this research are affecting quality service taxpayers, regional tax laws, level of satisfaction of taxpayer, Attitude taxpayers and taxpayer compliance theoretically, compiled into a theoretical model will be evidenced by a data field into a model-based data.
2. METHODOLOGY
The type of data in this research is primary, Obtained through with survey respondents having businesses, then do analysis using Structural Equation Modeling (SEM). SEM is a multivariate analysis methods can be used to describe linear relationships simultaneously linkages between indicators variable and variables that cannot be measured directly (latent variables). The latent variable is a variable can’t be measured directly, but can be represented or measured by one or more variables/indicators
Structural models describe relationship between latent variables, as shown in the following equation.
η = Bη + Γξ + ζ (1)
where ηis an endogenous latenvector meansuring size mx1, B is the matrix coefficient of the endogenous latent variable measuring size m x m, ξ is a exogenous latent variable vector column,ζis a vector of error in structural equations measuring size m x 1, and Γ is a coefficients matrix of the exogenous latent variable measuring size m x n. While, in the measurement model on similarities as follows
y=Λyη + ε (2)
x=Λ xξ +δ (3)
where y is a vector indicator variable vector on the latent variable η with px1 size and x is a indicator variable vector on the latent variable ξ with qx1 size. While Λy is a coefficient relation of matrix y at ηand Λx is
the coefficient relation of matrix on x at ξ. Error vector for y measuring size px1 symbolized by ε and error vector for x with measuring sizes qx1 symbolized byδ
.
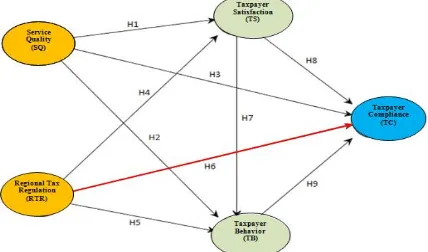
Conceptual research is presented as follows:
Fig. 1. Conceptual Model Taxpayer Compliance
With hipoteses
200 |
PART B
. SOCIAL SCIENCES AND HUM ANITIES
w w w.ijar.eu
INTERNATIONAL JOURNAL of ACADEM IC RESEARCH Vol. 6. No. 4. July, 2014
3.RESULTS AND DISCUSSION
After test the validity and reliability on each variable latent, some prerequisite to be protected in modeling structural is assuming multivariate normal, assumption absence of multicolinearity or singularities and outlier.
Normality of data is one of SEM in terms. Testing data on Multivariate normality is emphasized by looking at the values of skewness, kurtosis, and statistically may be seen from the value of Pearson Correlation between
dj and q. significance level if it is used by 5 percent, then the value of Pearson Correlation between dj and q more than 0.5 or p < α = 0.05 was said to be a data is multivariate normal. On the attachment, the value of Pearson Correlation between dj and q of 0.929 or p = 0.000 < α = 0.05, so it can be said that the data distribution multivariate normal. Singularity can be seen through the determinant of the matrix of covariance. The value of a determinant is a very small or close to zero shows an indication there is the problem of singularity, so it cannot be used for research.
Multicollinearity does not occur if there is a latent variables are exogenous and there is more than one correlation. The value of the correlation between latent variables the service quality (SQ) with regional tax regulations (RTR) of 0.014 and p = 0903 is greater than the significance level p = 0.000 < α = 0.05, then it can be said to be not happening multicollinearity. An outlier is an observation that comes with extreme values for univariate or multivariate, that which arises due to a combination of its own unique characteristics and looks very far from the observation-other observation. In the event of an outlier can be made special treatment on the outlier of origin unknown how the emergence of the outlier. Research on outlier testing results served on the mahalanobis d-squared. The value of a greater Mahalanobis of Chi-square tables or value p1 < 0.001 is said to be the outlier observation. To research are two data outlier, because it still less than 5 data then be considered not occurring outlier.
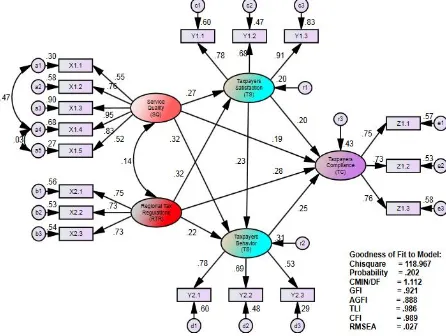
After a test validity and reliability on all latent variable results valid and reliability, multivariate normal data, singularity does not occur and there is no outlier, then the latent variables can proceed in the analysis of the shape of a path diagram is presented as follows:
Fig. 2. Relationship service quality, regional tax regulations, taxpayer satisfaction and behavior, taxpayer compliance
Structural of Taxpayer Compliance Goodness of Fit Model
The results of testing the measurement model with AMOS program is available at the following
Table 1. Testing Results Model service quality, regional tax regulations, taxpayersatisfaction and behavior,taxpayer compliance
Criterition Value
Cut-Off
Calculation Result
Information
Chi – Square expected small 118.967
2
with df = 107 is 132.144
Good Significance
Probability 0,05 0.202 Good
RMSEA 0,08 0.027 Good
GFI 0,90 0.921 Good
AGFI 0,90 0.888 Marginal
CMIN/DF 2,00 1.112 Good
TLI 0,90 0.986 Good
CFI 0,90 0.989 Good
Baku, Azerbaijan | 201
INTERNATIONAL JOURNAL of ACADEM IC RESEARCH Vol. 6. No. 4. July, 2014
The appropriate of model, can be interpreted in each path coefficient. The coefficients path is hypothesized in this study, which can be presented in the following structural equation:
TS = 0.275 SQ + 0.315 RTR
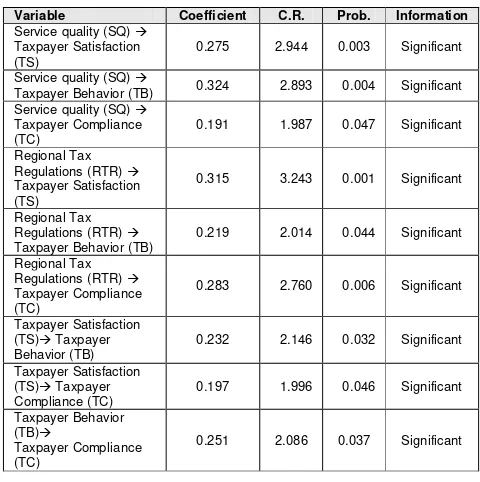
Testing path coefficients in Figure 2 and the above equations are presented in detail in the following table:
Table 2. Path Coefficients Testing Results Taxpayer Compliance Model
Variable Coefficient C.R. Prob. Information
Service quality (SQ)
Taxpayer Satisfaction (TS)
0.275 2.944 0.003 Significant
Service quality (SQ)
Taxpayer Behavior (TB) 0.324 2.893 0.004 Significant
Service quality (SQ)
Based on Table 2, the interpretation of each path coefficient is as follows:
1. The Service quality (SQ) a positive and significant effect of Taxpayer Satisfaction (TS). This can be seen from the path marked with a positive coefficient of 0.275 with C.R. of 2.944 and acquired significance probability (p) of the smaller of 0.003 degrees of significance (α=0.05). Thus Service quality (SQ) impact directly on the level of Taxpayers satisfaction (TS) to 0.275, meaning every Service quality (SQ) increases then it will raise the Taxpayers satisfaction (TS) equal to 0.275.
2. The Service quality (SQ) a positive and significant effect of Taxpayer Behavior (TB). This can be seen from the path marked with a positive coefficient of 0.324 with C.R. of 2.893 and acquired significance probability (p) of the smaller of 0.004 degrees of significance (α=0.05). Thus Service quality (SQ) impact directly on the level of Taxpayer Behavior (TB) to 0.324, meaning every Service quality (SQ) increases then it will raise the Taxpayer Behavior (TB) equal to 0.324.
3. The Service quality (SQ) a positive and significant effect of Taxpayer Compliance (TC). This can be seen from the path marked with a positive coefficient of 0.191 with C.R. of 1.987 and acquired significance probability (p) of the smaller of 0.047 degrees of significance (α=0.05). Thus Service quality (SQ) impact directly on the level of Taxpayer Compliance (TC) to 0.191, meaning every Service quality (SQ) increases then it will raise the Taxpayer Compliance (TC) equal to 0.191.
202 |
PART B
. SOCIAL SCIENCES AND HUM ANITIES
w w w.ijar.eu
INTERNATIONAL JOURNAL of ACADEM IC RESEARCH Vol. 6. No. 4. July, 2014
5. The Regional Tax Regulations (RTR) a positive and significant effect of Taxpayer Behavior (TB). This can be seen from the path marked with a positive coefficient of 0.219 with C.R. of 2.014 and acquired significance probability (p) of the smaller of 0.044 degrees of significance (α=0.05). Thus Regional Tax Regulations (RTR) impact directly on the level of Taxpayer Behavior (TB) to 0.219, meaning every Regional Tax Regulations (RTR) increases then it will raise the Taxpayer Behavior (TB) equal to 0.219. 6. The Regional Tax Regulations (RTR) a positive and significant effect of Taxpayer Compliance (TC). This can be seen from the path marked with a positive coefficient of 0.283 with C.R. of 2.760 and acquired significance probability (p) of the smaller of 0.006 degrees of significance (α=0.05). Thus Regional Tax Regulations (RTR) impact directly on the level of Taxpayer Compliance (TC) to 0.283, meaning every Regional Tax Regulations (RTR) increases then it will raise the Taxpayer Compliance (TC) equal to 0.283.
7. Taxpayers satisfaction (TS) a positive and significant effect against a Taxpayer Behavior (TB). This can be seen from the path marked with a positive coefficient of 0.232 with C.R. of 2,146 and acquired significance probability (p) of the smaller of 0.032 degrees of significance (α) specified by 0.05. Thus Taxpayers satisfaction (TS) directly influential on Taxpayer Behavior (TB) of 0.232, which means every increment Taxpayers satisfaction (TS) then it will raise Taxpayer Behavior (TB) of 0.232
8. Taxpayers satisfaction (TS) a positive and significant effect against a Taxpayer Compliance (TC). This can be seen from the path marked with a positive coefficient of 0.197 with C.R. of 1,996 and acquired significance probability (p) of the smaller of 0.046 degrees of significance (α) specified by 0.05. Thus Taxpayers satisfaction (TS) directly influential on Taxpayer Compliance (TC) of 0.197, which means every increment Taxpayers satisfaction (TS) then it will raise Taxpayer Compliance (TC) of 0.197. 9. Taxpayer Behavior (TB) a positive and significant effect against a Taxpayer Compliance (TC). This can
be seen from the path marked with a positive coefficient of 0.251 with C.R. of 2.086 and acquired significance probability (p) of the smaller of 0.037 degrees of significance (α) specified by 0.05. Thus Taxpayer Behavior (TB) directly influential on Taxpayer Compliance (TC) of 0.251, which means every increment Taxpayer Behavior (TB) then it will raise Taxpayer Compliance (TC) of 0.251.
In the structural equations involving many variables and paths between variables are influences between variables that include direct effects, indirect effects and total effects. For it to be discussed in detail the respective effects of the above mentioned.
Standarized Direct Effect
A relation of direct occurring between exogenous latent variables (SQ, RTR), with endogenous latent variable intermediate/intervening (TS, TB) and endogenous latent variable compliance (TC). Table here presenting direct result of ties directly happened between variables latent exogenous and endogenous.
Table 3. Standardized Direct Effect Between Latent Variable
Standardized Direct Effect Endogen Variable exogenous to endogenous latent variables. The SQ provide the biggest direct effects on the TS, and subsequent TS on TC.
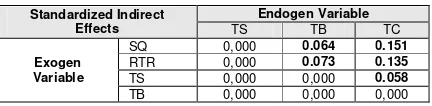
Standarized Indirect Effect
Table here presenting results indirect direct effect happened between variables latent exogenous and endogenous.
Table 4. Standardized Indirect Effects Between Variables
Standardized Indirect variable against latent endogenous. The TS giving the indirect effects largest in the SQ against obedience is TC.
Standarized Total Effect
Baku, Azerbaijan | 203
INTERNATIONAL JOURNAL of ACADEM IC RESEARCH Vol. 6. No. 4. July, 2014
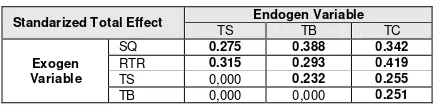
Tabel 5. Standarized Total Effect Between Variables
Standarized Total Effect Endogen Variable
TS TB TC
Exogen Variable
SQ 0.275 0.388 0.342
RTR 0.315 0.293 0.419
TS 0,000 0.232 0.255
TB 0,000 0,000 0.251
From Table 5 above, can be described of total effects than exogenous to endogenous latent variables. The RTR provide the greatest total effect on the TC, and then SQ give the largest total effects on TB.
4. CONCLUSION
The results showed that the SEM approach with service quality (SQ) which was formed by the physical evidence of (tangibles, reliability, responsiveness, assurance, and empathy) positive and significant effect against the Taxpayers Satisfaction (TS) (which consists to performance, perceptions, and expectations). Service quality (SQ) a positive and significant impact on the Taxpayer Behavior (TB) (dubious and fines, tax evasion, and restraint. Regional Tax Regulation (RTR) formed by the clarity of the rules of local tax, tax incentives, overlapping the positive and significant to the satisfaction of the Taxpayers Satisfaction (TS). Regional Tax Regulation (RTR) a positive and significant effect of Taxpayer Compliance (TC) (which consists of the calculation of tax rates, timely Payments, and tax reporting). The Taxpayers Satisfaction (TS) positive and significant effect on the Taxpayer Behavior (TB). Taxpayers Satisfaction (TS) a positive and significant effect of Taxpayer Compliance (TC). The Taxpayers behavior (TB) a positive and significant effect of Taxpayer Compliance (TC). The taxpayers satisfaction (TS) provides the largest indirect effects on the service quality (SQ) of Taxpayer Compliance (TC).
REFERENCES
1. Joreskog K.G., (1970), “A general method for estimating a linear structural equation system”, Educational Testing Service, Princeton, New Jersey
2. Bollen K.A, (1989), Structural Equations With Latent Variables, John Wiley and Son, USA 3. Mulaik S.A, (2009), Linear Causal Mdeling With Structural Equation, Chapman and Hall, USA 4. Raykov T. dan Marcoulides, G.R., (2006), A First Course in Structural EquationModeling, Lawrence
Erlbaum Associates, USA.
5. Lee S.Y., (2007), Structural Equation Modeling: A Bayesian Approach, John Wiley and Son, West Sussex, England.
6. Lee S.Y., and Xin, Y.S., (2008), On Bayesian estimation and model comparison of an integrated structural equation model, Journal of Computational Statistics and Data Analysis, Department of Statistics, The Chinese University of Hong Kong, Shatin, N.T., Hong Kong.
7. Levy P.S., and Stanley, L. (1999). Sampling of Populations: Methods and Applications. Third Edition. John Wiley and Sons. Inc. New York.
8. Brown T. A., (2006). Confirmatory Factory Analysis for Applied Research. The Guilford Press, New York.