DEVELOPMENT OF ANALYSIS METHOD OF INFRARED
THERMOGRAPHY FOR ELECTRICAL COMPONENT AGING
MANAGEMENT
Sudarno, Kussigit Santosa, Kiswanta, Deswandri, Geni Rina Sunaryo Center for Nuclear Reactor Technology and Safety -BATAN
Puspiptek Area, Building no. 80 -Serpong, South Tangerang, Indonesia Telp.021-7560912 / Fax. 021-7560913
Email : [email protected]
ABSTRACT
DEVELOPMENT OF ANALYSIS METHOD OF INFRARED THERMOGRAPHY FOR ELECTRICAL COMPONENT AGING MANAGEMENT.The GA Siwabessy multiple purpose reactor (GAS MPR) is a research reactor that has been operating for more than twenty years. In the IAEA Safety Standard Series (DS-272) on Safety Requirements of Research Reactors, it is indicated that the sufficient action / effort must be performed for testing and observation in order to detect, evaluate and mitigate the effects of aging. In this research, the development of inspection methods of electrical systems using infrared thermography has been done. The objective of this research is to propose an image processing method to infrared thermography inspection results, so that it simplify the hotspot extraction of infrared thermography inspection results. The methodology of this research is to apply image processing algorithms such as Independent Component Analysis (ICA) for image segmentation and k-means method clustering. The program uses input of infrared thermal image and provides outputs of featured images as segmentation and clustering results.The test results indicated that both methods can be used to improve hotspot detection of the infrared thermography inspection results. Interpretation of clustering result is easier than segmentation. However, segmentation test result with fastICA provided more detail information than clustering method.
Keywords: Infrared Thermography, Independent Component Analysis (ICA), segmentation, k-means clustering.
ABSTRAK
PENGEMBANGAN METODE ANALISIS TERMOGRAFI INFRAMERAH UNTUK MANAGEMEN PENUAAN KOMPONEN KELISTRIKAN.RSG GAS adalah reaktor riset
yang telah beroperasi selama lebih dari duapuluh tahun. Dalam IAEA Safety Standard Series (DS-272) tentang Safety Requirements of Research Reactors antara lain disebutkan bahwa tindakan/upaya yang memadai harus dilakukan untuk pengetesan maupun pengamatan yang bertujuan mendeteksi, mengevaluasi dan memitigasi efek penuaan. Dalam penelitian ini telah dilakukan pengembangan metode inspeksi komponen kelistrikan dengan termografi infra merah. Tujuan penelitian ini adalah untuk mendapatkan metode yang mempermudah dalam melakukan analisis citra thermogram hasil inspeksi. Metodologi yang digunakan adalah pengembangan program komputer untuk pengolahan citra infra merah, secara segmentasi dengan metode Independent Component Analysis (ICA) dan klasterisasi dengan metode k-means. Program tersebut menggunakan input citra infra merah dan menghasilkan output fitur citra hasil segmentasi dan klasterisasi. Hasil pengujian menunjukkan bahwa kedua metode tersebut dapat digunakan untuk mendeteksi jika terdapat hotspot pada citra thermogram hasil inspeksi komponen kelistrikan. Interpretasi hasil klasterisasi lebih mudah dari pada hasil segmentasi. Tetapi hasil segmentasi dengan fastICA memberikan informasi lebih rinci dibandingkan klasterisasi.
process. The operation reactor safety is closely linked to the reliability of structures, systems and components (SSC) of the nuclear reactor. All SSC will be affected by aging process and its functionality will be degraded, then the level of SSC reliability will be reduce.
G.A. Siwabessy multiple purpose Reactor (GAS MPR) is a 32 MW research reactor that has been operating for more than twenty years. During the period of operation to present date, SSC of GAS MPR experience aging process. The evaluation of the aging process that occurs on the GAS MPR is integrated into the activities of the aging management [1]. For all kinds of nuclear research reactor there is a constraint of safety requirements, i.e the IAEA Safety Standard Series (DS-272) on Safety Requirements of Research Reactors [2]:
1) In the design phase of the research reactor, appropriate and adequate safety margins should be provided to accommodate and anticipate the character of the material at the end of life time.
2) an adequate safety margin for all the components should be provided at the design phase, taking into account the ability of the components to function properly in condition of safety deterioration because of the influence of the aging effects. Aging effects must be considered in all normal operating conditions, including during maintenance or not operating period.
3) Adequate action / efforts should be performed for testing and observation in order to detect, evaluate and mitigate the effects of aging.
Principally, to ensure the safety of the reactor operation, the SSC of GAS reactor, including electrical components, have been designed and constructed using components that meet standards and safety criteria. However SSC aging will cause degradation effect of component material and then it will lead to function degradation which ultimately it can lead to generate system failure.
In this research, a development of non-destructive inspection method for electrical system with infrared thermography is conducted. The purpose of this research is to obtain computerized tools which can assist the extraction of thermal pattern information.As one of the predictive maintenance methods, infrared thermography can be used to monitor equipment performance quickly and reduce or avoid unnecessary component replacement [3,4]. The advantages of infrared thermography include: non-contact measurement method, capability to monitor heat quantity in a relatively wide area and its measurement results are displayed in visual images and digital data [5]. More detailed analysis can also be done with the help of infrared image analysis software. In this research we explored the use of the Independent Component Analysis (ICA) for image segmentation and k-means method clustering of infrared image (thermogram) to assist analysis of infrared image of electrical system inspection result. The segmentation method is used to separate objects and their boundaries in the image[6,7,8,9],while clustering method is to classify the color distribution [6,10,11].
THEORY
Infrared Thermography
Temperature is the most easily monitored variable. Almost all natural phenomena will result in a change in temperature. Temperature measurements can be made both contact and non-contact. Most of the measurements by contact method are carried out using thermometers and thermocouples. While non-contact measurements using infrared sensors are increasingly being developed and begin to be widely used.
Figure 1. Spectrum of electromagnetic wavelength.
In general, the total amount of infrared energy emitted by an object can be calculated by the following Stefan-Bolzmann equation [12]:
(1)
where :
σ = Stefan-Bolzmann constant = 5,6705 × 10⁻¹² [W / cm2 • K4] T = temperature (K)
From (1) it can be seen that the infrared energy is proportional to the temperature of the fourth power. Therefore, relatively small temperature change will provide a relatively large change in infrared energy. Thus infrared thermometers are very sensitive temperature sensors.
However, the surrounding environment, the material surface properties, the type of materials and others contribute to the intensity of infrared emission. These parameters are noise and must be taken into consideration when analyzing temperature distribution patterns.
Segmentation Method Using Independent Component Analysis (ICA)
In computational science, segmentation refers to the process of partitioning digital images into multiple segments. Common image segmentation is used to find objects and boundaries (lines, curves, etc.) in an image. More precisely, image segmentation is the process of placing labels or marks for each pixel in an image for certain visual characteristics. In this research, infrared image segmentation was conducted to identify the thermal pattern using Independent Component Analysis (ICA) method.
An event is said to be statistically free if the event is not related to each other. Mathematically, the probability of inter-event is the multiplication of the probability of each event :
, . (2)
The measured signal originating from independent sources, can be statistically expressed as :
(3) Where x denotes the measured signal X, s denotes the source S and a are the unknown mixing matrix A. The equation (3) is the basic idea of ICA [13]. The above equation can be written in the form of matrix equation:
(4)
The purpose of ICA is to look for the estimated signal y that is determined by the equation :
(5)
Gamma
ray
X ray UV Infrared rays Micro waves Radio waves Visible light
The process of separating signals with the ICA model can be illustrated by the block diagram in Figure 2.
Figure 2. Separation of signals by Independent Component Analysis (ICA) model [13].
The problem of ICA model is to find the separator filter W. The proper and optimal selection of W filter will affect the estimated signal quality. There are several ICA algorithms, in this research we use FastICA algorithm.
The W filter separator computation using FastICA algorithm is described as follows [14]:
1. Initialize W0 (random value) 2. Update the value of W :
(6)
Where E is the function of means, g is a non-quadratic function. 3. Normalization W:
(7)
4. If it has not converged yet, repeat to step 2.
K-means Clustering Method
Image feature (thermal pattern) can be analyzed using cluster analysis method. This method will assist the extraction of images obtained from infrared thermography. The purpose of cluster analysis is to classify objects according to similarity between components and organize data in groups. In this research, clustering is done by K-means algorithm. The principle of the algorithm is to divide the objects in the image into K groups that have the same characteristics in each group. In image analysis, these characteristics are the color and distance to the center point.
The algorithm of K-means clustering is as follows [15]: Choose K centroid points at random.
Reassignment.Group the data to form K clusters with the centroid point of each cluster is the centroid point that has been selected previously. The process of grouping data into a cluster can be done by calculating the closest distance from a data to a centroid point. Euclidean distance calculation can be used to calculate the distance between 2 pieces of data. The equations for calculating the distance are:
, / (8) whered is the distance between two points xiandxj.
Recomputation. Update the centroid point :
Repeat steps 2 and 3 until the values of centroid points converge.
METHODOLOGY
Images of inspection result using infrared camera consists of two images, namely thermal distribution image and visual images. Then the thermal distribution image is saved as BMP bitmap format, in order to apply image processing of segmentation and clustering. In this research, the computer programs for segmentation with fastICA and clustering with k-means are developed in MATLAB.The input imagesare selected from the infrared thermography imagesthat have a hotspot, in order to observe the effect of segmentation and clustering on hotspot and non-hotspot objects. The output images are displayed separately accordingto their thermal patterns.
RESULTS AND DISCUSSION
In principle, the electrical load at GAS MPR is connected to the main distribution panel redundantly. The redundant power supply system consists of:
a. Normal Power Supply 380 VAC; b. Emergency Power Supply 380 VAC; c. Uninterruptible Power Supply 24 VDC.
In the normal power supply, the electric source of GAS MPR is supplied by PLN with 3030 kVA. Under normal power supply condition, the reactor can operate because its power is sufficient to supply all SSC including primary and secondary cooling pump. As emergency power supply, the electric source of GAS MPR is supplied by 3 generators with capacity of 560 kVA each. Under emergency power supply conditions, the reactor cannot be operated because its power supply is reserved for reactor safety related SSC only.
Three Uninterruptible Power Supply (UPS) of 24 VDC serves to provide power to the safety related system immediately when electric supply from PLN is off, until the power from the generators is available. Each UPS consists of rectifiers + 24V and -24 V, Batteries, and Distribution Panels. The 24 VDC system also supplies Reactor Protection Systems (including primary isolation valves) and Instrumentation and Control equipment.
In this research, testing the developed method of segmentation and clustering on thermography images of electrical system inspection has been conducted. The thermal image selected for the test is the image that contains a hotspot. Here is the result of infrared image classification testing using fastICA method and clustering using K-means algorithm for electric panel with hotspot on one of its fuse.
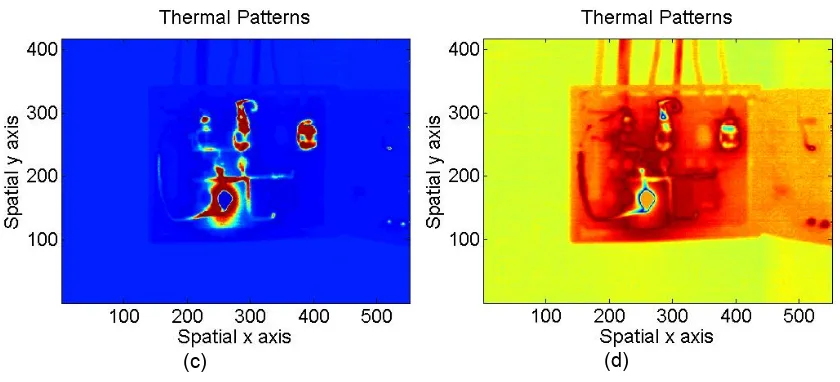
(c) (d)
Figure 3. (a) Infrared thermal image of electric panel no.1 with hotspot. (b) Results of thermal pattern segmentation 1. (c) Results of thermal pattern segmentation 2. (d) Results of thermal pattern segmentation 3.
From the test results, the application of fastICA segmentation methodto the thermogram image Figure 3(a)can separate hotspot and non hotspot objects. Display results of fastICA segmentation also still shows the existence of temperature degradation at hotspot area. The result of fastICA segmentation of Figure 3(b) shows the extraction of the object, so there is clear difference between the object and the background image. This object classification and background image are based on their temperature values. In Figure 3(c), we can see the hotspot extraction from the object. Figure 3(d) shows a better colour contrast as the boundary between objects or an object with a background image.
The disadvantages of fastICA method in the above test is the result of always three thermal pattern segmentation. This is because the input image of thermogram is in BMP bitmap format. The image by the fastICA program is separated into three components of its constituent colors, namely red, green and blue. The intensity of each color component is used as input data to be processed by fastICA algorithm. Segmentation errors can occur because the thermal pattern values are not always proportionally represented by each red, green and blue component.
Figure 4(a), 4(b) and 4(c) show the testing results of infrared thermal image clustering by K-means algorithm for the electrical panel image of Figure 3(a).
(a) (b) (c)
Figure 4. (a) Objects in cluster 1. (b)Objects in cluster 2. (c) Objects in cluster 3.
Clustering test results with k-means method also generate three clustered objects output, because thermogram image input is in BMP format. Clustering results are simpler than segmentation, making it easier to interpret the output. However, segmentation test result with fastICA provided more detail information than clustering method. Also we remark that image output of the segmentation and clustering is thermal pattern image but it does not match to the color scale commonly used in thermogram (eg. shine scale). Thus it is necessary to read carefully the temperature values of the segmentation and clustering results.
CONCLUSION
In this research, we have developed the method of infrared thermography image analysis using fastICA segmentation method and k-means clustering. Test results on the thermography image showed that the segmentation and clustering method can extract information on the existence of hotspot, objects and background. Interpretation of clustering result is easier than segmentation. However, segmentation test result with fastICA provided more detail information than clustering method.
ACKNOWLEDGEMENT
This research is funded by DIPA PTKRN (Center for Nuclear Reactor Technology and Safety)–BATAN fiscal year 2016.
REFERENCES
1. M. Dhandang P., dkk, ”Dokumen Manajemen Penuaan RSG-GAS”, P2TRR Batan, 2003.
2. IAEA, "Safety Requirements of Research Reactors", IAEA Safety Standards Series DS-272 (Draft), International Atomic Energy Agency, Vienna, 2003.
3. Sudarno, Edi Sumarno, Giarno , ”Pemantauan Kondisi Instalasi Listrik Menggunakan Termografi Infra Merah”, Prosiding Seminar Penelitian dan Pengelolaan Perangkat Nuklir, Pusat Sains dan Teknologi Akselerator, Yogyakarta, 9 September 2014.
4. Teguh Sulistyo, Kiswanto, Roziq Himawan, Ari Satmoko, “Diagnosis Penuaan Panel Busbar Utama II Sistem Kelistrikan RSG-GAS Menggunakan Infrared Thermography” Prosiding PPI-PDIPTN, PTAPB – BATAN, Yogyakarta, 2007.
5. Chen C., Qin W., Fang Z., Zhang Y., “Infrared image transition region extraction and segmentation based on local definition cluster complexity” International Conference on Computer Application and System Modeling,Vol. 3. pp. 50–54, 2010.
6. Linda G. Shapiro and George C. Stockman “Computer Vision”, Prentice-Hall, ISBN 0-13-030796-3,pp 279-325,New Jersey, 2001.
7. Jiehong Wu, Po Zhang, Xiangbin Shi and Fang Liu, "An efficient infrared image segmentation method," Proceedings 2013 International Conference on Mechatronic Sciences, Electric Engineering and Computer (MEC), pp. 1449-1452, Shengyang, 2013. 8. E. Erdil et al., "Nonparametric Joint Shape and Feature Priors for Image
Segmentation,"IEEE Transactions on Image Processing, vol. 26, no. 11, pp. 5312-5323, Nov. 2017.
9. V. Cherukuri, P. Ssenyonga, B. C. Warf, A. V. Kulkarni, V. Monga and S. J. Schiff, "Learning based image segmentation of post-operative CT-images: A hydrocephalus case study," 8th International IEEE/EMBS Conference on Neural Engineering (NER), pp. 13-16, Shanghai, China, 2017.
10. Bharathi P.T and P. Subashini, "Texture based color segmentation for infrared river ice images using K-means clustering," 2013 International Conference on Signal Processing, Image Processing & Pattern Recognition, pp. 298-302, Coimbatore, 2013. 11. T. J. Ramírez-Rozo, J. C. García-Álvarez and C. G. Castellanos-Domínguez, "Infrared
thermal image segmentation using expectation-maximization-based clustering," XVII Symposium of Image, Signal Processing, and Artificial Vision (STSIVA), pp. 223-226, Antioquia, 2012.
14. Hyvarinen, A., “Fast and robust fixed-point algorithms for independent component analysis”, IEEE Transactions on Neural Networks, 10, pp. 626-634, 1999.