Australian Journal of Basic and Applied Sciences
ISSN:1991-8178
Journal home page: www.ajbasweb.com
Corresponding Author: Victor Khoesnadi Mandala Putra, Petra Christian University,Industrial Engineering, Faculty of Industrial Technology, Surabaya, Indonesia
Comparing between Simulated Annealing Neighborhood Generation with the
Combination of Simulated Annealing and Genetic Algorithm in Facility Layout
Problem
Victor Khoesnadi Mandala Putra, Tanti Octavia, Herry Christian Palit
Petra Christian University,Industrial Engineering, Faculty of Industrial Technology, Surabaya, Indonesia
A R T I C L E I N F O A B S T R A C T
We present the comparison of the Simulated Annealing Neighborhood Generation (SANG) algorithm with the combination of Genetic Algorithm-Simulated Annealing Algorithm (GA-SA II). It is applied to a facility layout problem. We simulate two algorithms using Microsoft Visual Basic 6.0 and data is generated from a case study. The result shows SANG algorithm gives a better result in terms of moment. It occurs since SANG algorithm exchanges eight chosen facilities, simultaneously. Therefore, the best moment can be found faster.
© 2014 AENSI Publisher All rights reserved. To Cite This Article: Victor Khoesnadi Mandala Putra, Tanti Octavia, Herry Christian Palit, Comparing between Simulated Annealing Neighborhood Generation with the Combination of Simulated Annealing and Genetic Algorithm in Facility Layout Problem. Aust. J. Basic & Appl. Sci., 8(14): 78-84, 2014
INTRODUCTION
Facility layout can affect the total moments contained in a company facility layout. Moment is obtained by multiplying the distance with frequency if it resulting smaller moments, it will impact the reduction in the cost of handling. Many researchers have developed metaheuristics models to solve the facility layout problem. They are Simulated Annealing (Chwif et al., 1998; McKendall et al., 2006), Genetic Algorithm (Chutima, 2001; El-Baz, 2004), and Particle Swarm Optimization (Setiawan, 2010). Setiawan (2010) compared the combination of algorithms Simulated Annealing and Genetic Algorithm (GA-SA I and GA-SA II) with Particle Swarm Optimization algorithm. The result shows that GA-SA II has a better performance than the others. Fukushi† et al. (2009) developed the Simulated Annealing Neighborhood Generation (SANG) to solve facility layout problem. SANG could exchange 8 facilities (4 pairs) simultaneously, however Simulated Annealing only exchange 2 facilities (1 pair) simultaneously. This research compares the performance of Simulated Annealing Neighborhood Generation algorithm with GA-SA II.
Methods:
The layout of the facility can be defined as a procedure for setting the plant facilities to support the smooth running ofthe production process(Wignjosoebroto, 2009). The main objective is to minimize total cost of the construction and installation of facilities, handling costs, and production costs. Setting the layout facility can provide other benefits besides minimize total cost which is raising production output, reduce the waiting time at each facility production process, reducing handling process, improve efficiency area, reducing the current or frequency displacement, and facilitate supervision.
Method in Facilities Layout:
Designing the layout of the facility can be done by two algorithms, construct and relayout algorithms. Construct method is a method used to design the layout of the facility. Relayout algorithm is a method used to improve the design ofthe layout of the existing facility.
Simulated Annealing:
facilities size. This algorithm will reach a minimum transportation costs by exchanging between two facilities randomly. The iterations will continue until the minimum moment is achieved. The figure 1 shows the graph results of simulated annealing in order to reach a global minimum.
Fig. 1: Graph Results of Simulated Annealing (Imperial Collage London: Teaching, 2012)
Genetic Algorithm:
This algorithm uses the concept of Darwin's theory of evolution to find the best moments with the system of natural selection. Each individual will be regarded as a chromosome that represents one of the solutions to be evolved in stages. Good chromosomes will have off spring that will be compared with other chromosomes until the global optimum is found.
Neighborhood Generation Algorithm:
Neighborhood Generation algorithm has a similar working principle with Simulated Annealing. The difference is Simulated Annealing algorithm exchanges four pairs of different facilities simultaneously, while the Simulated Annealing algorithm just exchanges 1 pair of facilities. Neighborhood generation will minimize moment by swapping adjacent facilities both vertically and horizontally, randomly. The steps of neighborhood generation algorithm applied according to Fukushi† et al (2008) are: 1st) the center point facility is selected randomly. For the example, facility 6 is selected as center point facility (the coordinate is (2,3) ) It can be seen in Figure 2; 2nd) the neighborhood of center point facility is found. For example, neighborhood facilities are facility 4, 14, 16, and 11; 3rd) the neighborhood facility will swap randomly for four pairs facilities, simultaneously. In Figure 3, it is shown that facility 4, 14, 16 and 11 are exchanged with the facility 3, 7, 8 and 10; 4th) the step 3 will be repeated until the smallest moment is achieved.
Fig. 2: Early Position Facilities (Fukushi†, Yamamoto, Suzuki, & Tsujimura, 2008).
Fig. 3: Facility Layout after Exchange (Fukushi†, Yamamoto, Suzuki, & Tsujimura, 2008).
The Principle of Simulated Annealing Neighborhood Generation:
Fig. 4: An example of center point facility .
The facility Selection is done randomly with the condition m≥2 from the edge of the layout and n-2≥2of where m is the edge of the layout rows and n is the column. Terms of the limit order facility selected as the center point is not in the edge but in the middle because on the side of the horizontal and vertical center point it will be contain neighborhood. Determination of the center point be selected at random and is the facility number 6 (diagonal right stripes), as in Figure5.
Fig. 5: Facility that already been chosen as center point.
The second step is to determine which facility will serve as the neighborhood. The neighborhood facility is directly adjacent facilities horizontally and vertically with the center point. Figure 6 is an example of that are the center point of the facility number6 (diagonal right stripes), with the neighborhood facility number 2, 5, 7, and10 (vertical stripes).
Fig. 6: Neighborhood Facility.
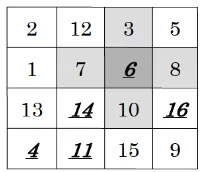
The third step is to determine which facilities will be exchanged with a neighborhood. Facilities that will be exchanged, with the neighborhood facilities should not facilities that already chosen as center point and are also not the neighborhood facilities. The selection of the facility must meet the requirements and they are selected randomly. Figure 7 shows some of the facilities that can be exchanged (vertical stripes) with neighborhood facilities (diagonal left stripes). The exchange facilities are calculated and the smallest moments will be selected. The exchange between facilities will occur as in Figure 8.
Fig. 8:The Exchange of Neighborhood Facilities with Selected Facilities.
Remarks:
Determine the initial temperature (temp0), cooling ratio (d), the number of iterations (i) and the target moments (etarget).
Calculating the initial moment (ebest)
Randomly exchanging the neighbor of the selected midpoint. Facilities were exchanged with the neighbor is not the midpoint and not the neighbor.
Start
Randomize the selection of the center point of the facility, provided M (row) >= 2, N (column) >= 2
Randomize the initial layout
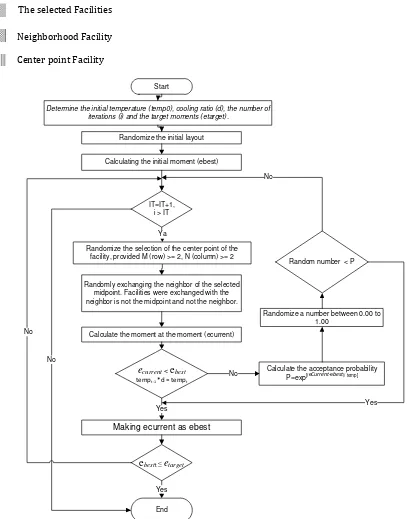
Fig. 9: Procedure of Simulated Annealing Neighborhood Generation (SANG) Algorithm. The selected Facilities
Neighborhood Facility
Procedure of Simulated Annealing Neighborhood Generation (SANG) Algorithm:
Simulated Annealing Neighborhood Generation algorithm has a similar concept to dealing with Simulated Annealing. Figure 9 shows the procedure of Simulated Annealing Neighborhood Generation algorithm. Researchers must determine the initial temperature denoted by temp0, cooling ratio is denoted by d, limit the number of iterations is denoted by i, and the target moments are denoted by etarget. The initial layout is generated randomly and the moment of the layout is calculated. This initial moment will be considered as the best moment while the denoted with ebest. The three steps of simulated annealing neighborhood generation algorithm are applied and the moment of current layout is calculated. The current moment is denoted by ecurrent. The next stage is the temperature at the previous iteration will be multiplied by the cooling ratio and it will be the new temperature. The cooling ratio in this study was 0.95. This stage will compare also whether ecurrent is smaller than ebest moment or not. If the moment of ecurrent is smaller than the final result will be accepted and it will be newebestvalue. The rest, the probability of acceptance by the formula P=EXP[(ecurrent-ebest) /temp] is calculated and compared with random numbers generated between 0.00 to 1.00. If random number is smaller than the probability of acceptance, the moment of ecurrent is accepted and replaces the ebest value. Ebest new value will be compared with the value etarget, if the value is not smaller than etarget then the program will proceed to the next iteration.
RESULT AND DISCUSSION
The data in this study is obtained from the data from previous research (Setiawan 2010). The data taken are the number of trips between two facilities and the distance between departments. There are 18 departments and 18 facilities. Frequency of transfer material between facilities can be seen in Figure 10. In this problem considered, the matrix flow is not symmetric because of precedence constraints and the distance matrix is symmetric. For example, the frequency between facility 1 and 5 is 0 since there is no transfer of material between the facilities. The highest frequency is 382, the transfer material from facilities 11 to facilities 12 and from facilities 4 to facilities 5.
Fig. 10: Frequency of transfer material (Setiawan, 2010).
The distance between department is shown in Figure 11. The longest distance is 103, distance from department 15 to department 16. The SANG algorithm was simulated using Microsoft Visual Basic 6. Verification is applied in order to check whether the program has been built appropriately or not. The validation is also done by checking the similarity with the calculated results of the program manually.
The target moment each module has a different value and the target moment is obtained by calculating the
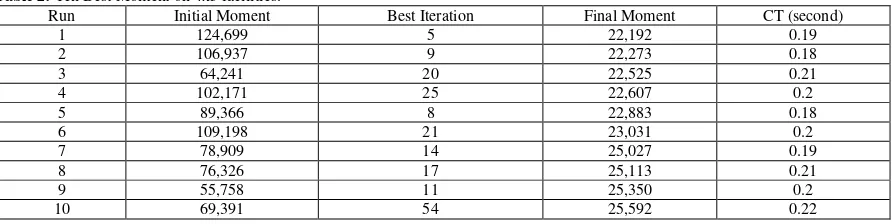
This 4x5 layout model can accommodate all the existing facilities at the beginning of the data since it can accommodate up to 20 facilities. The facilities derived from entry data there were only 18 other facilities so that two facilities will be dummy facilities. Dummy facilities will have the frequency of transfer material as 0. The ten best moments can be seen in Table 2. The average value of the initial moment and the average final moments are 89,855.04 and 43,044.91, respectively. The computational time of running this model is 0.2085 seconds.
Table2: Ten Best Moment on 4x5 facilities.
Run Initial Moment Best Iteration Final Moment CT (second)
1 124,699 5 22,192 0.19
The best moments of the value obtained from GA-SA method II and the average value of the moment are 46,653.0818 and 50,061.07, respectively (Setiawan, 2010). The comparison of moments can be seen in the Table 3. The best moment value and the average value of the moment obtained by Simulated Annealing algorithm Neighborhood Generation are 22,192 and 43,044.91, respectively. The result shows that Neighborhood Generation Simulated Annealing algorithm is smaller than the GA-SA algorithm II. Neighborhood Generation Simulated Annealing (SANG) algorithm aims various possible combinations at each iteration. Therefore, the opportunity in order to get the better result is large.
Table 3: Comparison of results Moment.
Solution Best Moment Average Moment
Initial Layout Company 73,533.79 -
GA-SA II 46,653.08 50,061.07
Simulated Annealing Neighborhood Generation 22,192 43,044.91
Conclusion:
In this paper we have compared Simulated Annealing Neighborhood Generation to the combination of Simulated Annealing and Genetic Algorithm in facility layout problem. We applied to a facility layout problem with eighteen locations, and simulate the algorithms for 400 iterations. The best moment value obtained with Simulated Annealing Neighborhood Generation algorithm as 22,192. The result shows that simulated Annealing Generation Neighborhood algorithm gives the better result than using GA-SA II algorithm in terms of moment. It occurs since simulated annealing neighborhood generation exchange eight chosen facilities directly. Therefore, it can lead to more extensive coverage of the exchange and the best moment can be found faster.
REFERENCES
Chibante, R., 2010. Simulated Annealing Theory with Applications. Rijeka: Sciyo.
Chutima, P., 2001. Genetic Algorithm for Facility Layout Design with Unequal Departmental Areas and Different Geometric Shape Constraints. Thammasat Int.J.Sc.Tech, 6(2): 33-43.
Chwif, L., M.R.P., Barretto and L.A., Moscato., 1998. A Solution to the Facility Layout Problem Using Simulated Annealing. Computers in Industri, 36: 125-132. Elsevier.
Fukushi†, T., H. Yamamoto., A. Suzuki and Y. Tsujimura, 2009. Efficient Algorithms for Solving Facility Layout Problem Using a New Neighborhood Generation Method Focusing on Adjacent Preference. IEMS, 8(1): 22-28
McKendall, A.R., J. Shang and S. Kuppusamy, 2006. Simulated Annealing Heuristics for the Dynamic Facility Layout Problem. Computer and Operation Research, 33: 2431-2444.
Setiawan, I.L. and H.C. Palit, 2010. PerbandinganKombinasi Genetic Algorithm-Simulated Annealing dengan Particle Swarm Optimization padaPermasalahan Tata Letak Fasilitas. Jurnal Teknik Industri UK Petra, 12(2): 119-124.