ISBN 978-602-1328-04-0
OUTLOOK ENERGI
INDONESIA ENERGY OUTLOOK 2015
Pengembangan Energi untuk Mendukung
Pembangunan Berkelanjutan
Energy Development in Supporting Sustainable Development
Editor:
Agus Sugiyono
Anindhita
M. Sidik Boedoyo
Adiarso
This publication is available on the WEB at:
www.bppt.go.id
PUSAT TEKNOLOGI PENGEMBANGAN SUMBER DAYA ENERGI
CENTER FOR ENERGY RESOURCES DEVELOPMENT TECHNOLOGY
BADAN PENGKAJIAN DAN PENERAPAN TEKNOLOGI
AGENCY FOR THE ASSESSMENT AND APPLICATION OF TECHNOLOGY
ISBN 978-602-1328-04-0
© Hak cipta dilindungi oleh undang-undang /
© All rights reserved
Boleh dikutip dengan menyebut sumbernya / May be cited with crediting the source
Diterbitkan oleh /
Published by
Pusat Teknologi Pengembangan Sumber Daya Energi (PTPSE)
Center for Energy Resources Development Technology
Badan Pengkajian dan Penerapan Teknologi (BPPT)
Agency for the Assessment and Application of Technology
Gedung BPPT II, Lantai 11
BPPT Building II, 11th floor
Jl. M.H. Thamrin 8, Jakarta 10340
Telp. : (021) 7579-1357
Fax : (021) 7579-1357
email : [email protected]
Perpustakaan Nasional RI: Katalog Dalam Terbitan (KDT)
Library of Congress Cataloging-in-Publication Data
Outlook energi indonesia 2015 : pengembangan
energi untuk mendukung pembangunan berkelanjutan =
Indonesia energy outlook 2015 : energy development in
supporting sustainable development / tim penyusun, M. Sidik
Boedoyo ... [et al.] ; editor, Agus Sugiyono ... [et al.].
Jakarta : Pusat Teknologi Pengembangan Sumberdaya Energi
BPPT, 2015.
103 hlm. ; 29 cm.
Bibliografi : hlm. ....
ISBN 978-602-1328-04-0
1. Politik energi. 2. Teknologi energi. I. Sidik Boedoyo, M.
II. Agus Sugiyono.
iii
2015
INDONESIA ENERGY OUTLOOK
Dengan mengucap puji syukur ke hadirat Allah SWT, saya menyambut gembira Badan Pengkajian dan
Penerapan Teknologi (BPPT) dapat menerbitkan buku Outlook Energi Indonesia (OEI) 2015 ini. BPPT secara
berkala telah dan akan menerbitkan buku OEI dan BPPT-OEI 2015 ini merupakan terbitan yang ketujuh. Secara
umum buku OEI membahas tentang permasalahan energi saat ini serta memberi gambaran kebutuhan dan
pasokan energi di masa mendatang untuk kurun waktu tertentu. Berbagai aspek dalam pengembangan energi
nasional yang merupakan isu-isu penting dipertimbangkan dan dikupas secara khusus dalam buku BPPT-OEI.
BPPT-OEI 2015 membahas antara lain proyeksi energi dalam kurun waktu 2015 sampai 2050, dengan
mengangkat topik bahasan “Pengembangan Energi untuk Mendukung Pembangunan yang Berkelanjutan”.
Penyusunan buku ini juga mempertimbangkan keterkaitan antara sektor energi dengan pembangunan
ekonomi, kebijakan serta teknologi yang prospektif untuk dikembangkan di masa mendatang.
Mudah-mudahan hasil pembahasan yang dituangkan dalam buku ini dapat menjadi masukan yang
bermanfaat bagi pemerintah dan masyarakat serta pihak terkait lainnya dalam pembangunan ekonomi
Indonesia, serta secara khusus bagi pihak yang mengelola dan mengembangkan sektor energi di Indonesia.
Tak lupa saya menyampaikan terima kasih dan penghargaan kepada tim penyusun serta semua pihak
yang telah memberi dukungan dan bantuan sehingga buku ini bisa diterbitkan. Kami menyadari
adanya kekurangan dan keterbatasan pada buku ini, untuk itu diharapkan sumbang saran maupun
kritik yang membangun untuk perbaikan dan penyempurnaan pada penerbitan buku berikutnya.
Jakarta, November 2015
Badan Pengkajian dan Penerapan Teknologi
Kepala
Dr. Ir. Unggul Priyanto, M.Sc.
SAMBUTAN
important issues to be considered and studied specifically in BPPT-OEI.
BPPT-OEI 2015 discusses, among others, energy projection in 2015-2050 periods with topic “Energy Development
in Supporting Sustainable Development”. BPPT-OEI 2015 also considers linkages between energy sector with
economic development, policies and prospective technologies to be developed in the future.
I am optimist that results of discussion which are outlined in BPPT-OEI 2015 will be a useful input for the
government, society and other stakeholders in the economic development of Indonesia, and in particular for those
who manage and develop the energy sector in Indonesia.
I would like to extend my appreciation and thanks to the authors and editors and all parties that have supported
and provided assistance so that this book can be published. We are aware of the limitations in this publication
and so we welcome all feedbacks as well as constructive criticisms for improvement and refinement of the next
publication.
Jakarta, November 2015
Agency for the Assessment and
Application of Technology
Chairman,
v
2015
INDONESIA ENERGY OUTLOOK
PENGARAH / STEERING COMMITTEE Kepala BPPT
Chairman of BPPT
Dr. Ir. Unggul Priyanto, M.Sc.
Deputi Kepala BPPT Bidang Teknologi Informasi, Energi dan Material (TIEM)
Deputy Chairman for Information, Energy and Material Technology
Dr. Ir. Hammam Riza, M.Sc.
PENANGGUNGJAWAB / PERSON IN CHARGE
Direktur Pusat Teknologi Pengembangan Sumber Daya Energi (PTPSE)
Director of Center for Energy Resources Development Technology
Dr. Adiarso
KOORDINATOR / COORDINATOR Kepala Bidang Perencanaan Energi
Head of Energy Planning Division
Ir. Agus Sugiyono, M.Eng.
TIM PENYUSUN / AUTHORS
Kebijakan Energi : Prof. Ir. M. Sidik Boedoyo, M.Eng.
Energy Policy Ir. Agus Sugiyono, M.Eng.
Kebutuhan dan Penyediaan Energi : Ira Fitriana, S.Si, M.Sc.
Energy Demand and Supply Dra. Nona Niode
Minyak dan Gas Bumi : Ir. Erwin Siregar
Oil and Gas Ari Kabul Paminto, S.T.
Batubara : Ir. Endang Suarna, M.Sc.
Coal
Ketenagalistrikan : Drs. Yudiartono, M.M.
Electricity
Pembangunan Berkelanjutan : Ir. La Ode M. Abdul Wahid
Sustainable Development Prima Trie Wijaya, S.Kom.
Suryani, S.Si.
Database dan Pemodelan : Anindhita, S.Si, M.S.
Database and Modelling Ira Fitriana, S.Si, M.Sc.
Drs. Yudiartono, M.M.
Grafik dan Layout : Nini Gustriani, A.Md.
Layout and Graphic
INFORMASI / INFORMATION Bidang Perencanaan Energi
Pusat Teknologi Pengembangan Sumber Daya Energi (PTPSE) Badan Pengkajian dan Penerapan Teknologi (BPPT)
Gedung 625, Klaster Energi, Kawasan Puspiptek, Kota Tangerang Selatan Telp./Fax. (021) 7579-1357
Email: [email protected]
TIM PENYUSUN
•
Ir. Sidqi Lego Pangesti Suyitno, MA, Plt. Direktur
Perencanaan Makro, Bappenas.
•
Ir. Hendry Ahmad, M.T., Direktur BBM, Badan
Pengatur Hilir Minyak dan Gas Bumi.
•
Ir. Agus Cahyono Adi, M.T., Direktur Pembinaan
Program Migas, Direktorat Jenderal Minyak dan
Gas Bumi, Kementerian ESDM.
•
Naufal Noor Rochman, ST. MOGE, Kepala Seksi
Pemanfaatan Minyak dan Gas, Divisi Perencanaan
Program, Direktorat Jenderal Minyak dan Gas
Bumi, Kementerian ESDM.
•
Bapak Albert Maknawi, Direktur Utama PT.
Listrindo Kencana, Tempilang, Bangka Barat.
•
Ir. Sidqi Lego Pangesti Suyitno, MA, Director
of Macro Planning Ad-interim, National
Development Planning Agency.
•
Ir. Hendry Ahmad, M.T., Director of Fuel, Oil and
Gas Downstream Regulatory Agency.
•
Ir. Agus Cahyono Adi, M.T., Director of Oil and
Gas Program Development, Directorate General
of Oil and Gas, Ministry of Energy and Mineral
Resources.
•
Naufal Noor Rochman, ST.MOGE, Section Head of
Development Program of Oil and Gas, Directorate
General of Oil and Gas, Ministry of Energy and
Mineral Resources.
•
Mr. Albert Maknawi, Director of PT. Listrindo
Kencana, Tempilang, West Bangka.
vii
2015
INDONESIA ENERGY OUTLOOK
Sambutan /
Foreword
.
.
.
.
.
.
.
.
.
.
Tim Penyusun /
Authors
.
.
.
.
.
.
.
.
.
.
Ucapan Terima Kasih /
Acknowledgment
.
.
.
.
.
.
.
Daftar Isi /
Table of Contents
.
.
.
.
.
.
.
.
.
Bab 1 Pendahuluan /
Introduction
.
.
.
.
.
.
.
.
1.1
Latar Belakang /
Background
.
.
.
.
.
.
.
1.2
Model dan Pemutakhiran Data /
Model and Data Update
.
.
.
.
1.2.1 Model Kebutuhan Energi /
Energy Demand Model
.
.
.
.
1.2.2 Model Penyediaan Energi /
Energy Supply Model
.
.
.
.
1.2.3 Pemutakhiran Data /
Data Update
.
.
.
.
.
1.3
Skenario dan Kasus /
Skenario and Case
.
.
.
.
.
.
1.3.1 Skenario Energi Berkelanjutan /
Sustainable Energy
Scenario
.
.
1.3.2 Kasus /
Case
.
.
.
.
.
.
.
.
Bab 2 Kondisi dan Permasalahan Energi Saat Ini
/
Current Energy Conditions and Issues
.
.
2.1
Produk Domestik Bruto dan Penduduk /
Gross Domestic Product and Population
.
2.2
Konsumsi Energi Final /
Final Energy Consumption
.
.
.
.
.
2.2.1 Konsumsi Energi Final per Sektor / Final Energy Consumption by Sector .
2.2.2 Konsumsi Energi Final per Jenis / Final Energy Consumption by Type
.
2.3
Ketenagalistrikan /
Electricity
.
.
.
.
.
.
2.4
Potensi Sumber Daya Energi /
Energy Resource Potential
.
.
.
.
2.4.1 Potensi Sumber Daya Energi Fosil /
Fossil Energy Resource Potential
.
2.4.2 Potensi Sumber Daya Energi Baru dan Terbarukan /
New and Renewable
Energy Resource Potential
.
.
.
.
.
.
2.5
Permasalahan Energi Saat Ini /
Current Energy Issues
.
.
.
.
2.5.1 Permasalahan Umum /
General Issues
.
.
.
.
.
2.5.2 Permasalahan Sektor Transportasi /
Transportation
Sector Issues
.
.
2.5.3 Permasalahan Ketenagalistrikan /
Electricity Issues
.
.
.
.
2.6
Kebijakan Energi Terkini /
Recent Energy Policy
.
.
.
.
.
2.6.1 Kebijakan Energi Nasional/
National Energy Policy
.
.
.
.
2.6.2 Program 35.000 MW /
Program of 35,000 MW
.
.
.
.
2.6.3 Diversifikasi Energi /
Energy Diversification
.
.
.
.
2.6.4 Konservasi Energi
/ Energy Conservation
.
.
.
.
.
2.6.5 Subsidi Energi
/ Energy Subsidy
.
.
.
.
.
.
2.6.6
Feed-in Tariff
.
.
.
.
.
.
.
.
2.6.7 Persentase Minimal Penjualan Batubara Domestik
/ Domestic Market
Obligation of Coal
.
.
.
.
.
.
.
Bab 3 Proyeksi Kebutuhan Energi
/
Energy Demand Projection
.
.
.
.
.
3.1
Kebutuhan Energi Per Jenis /
Energy Demand by Type
.
.
.
.
3.2
Kebutuhan Energi Per Sektor /
Energy Demand by Sector
.
.
.
.
3.2.1 Sektor Industri /
Industry Sector .
.
.
.
.
.
DAFTAR ISI
TABLE OF CONTENTS
iii
v
vi
vii
1
2
4
4
4
5
6
6
7
9
10
11
11
12
14
15
15
15
17
17
18
20
21
21
22
22
23
24
26
28
31
32
34
35
3.2.3 Sektor Rumah Tangga /
Household Sector
.
.
.
.
.
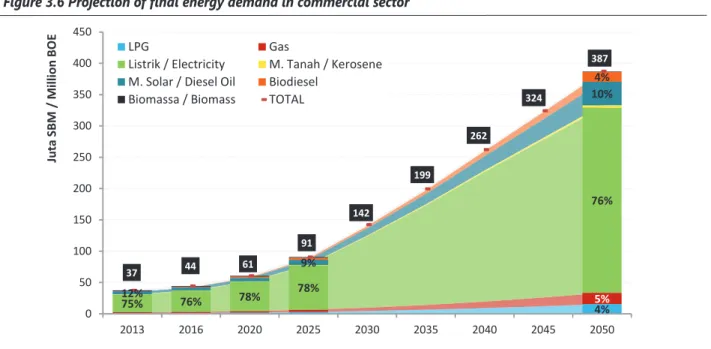
3.2.4 Sektor Komersial /
Commercial Sector .
.
.
.
.
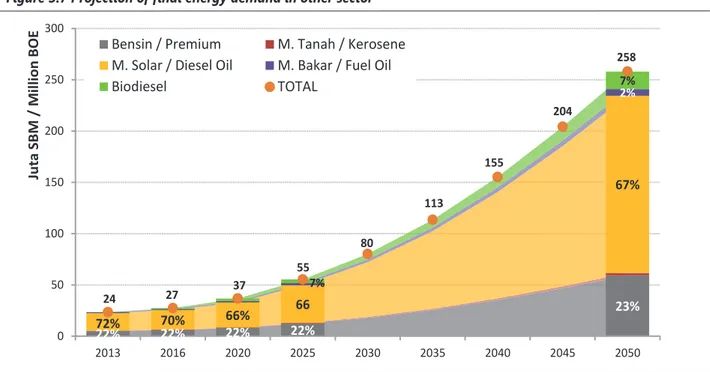
3.2.5 Sektor Lainnya /
Other Sector
.
.
.
.
.
.
Bab 4 Proyeksi Penyediaan Energi
/
Energy Supply Projection
.
.
.
.
.
4.1
Minyak Bumi dan BBM /
Crude Oil and Oil Fuels
.
.
.
.
.
4.1.1 Neraca Minyak Bumi /
Crude Oil Balance
.
.
.
.
.
4.1.2 Neraca Bahan Bakar Cair /
Liquid Fuels Balance
.
.
.
.
4.1.3 Pemanfaatan Bahan Bakar Cair /
Liquid Fuels Utilization
.
.
.
4.2
Gas Bumi, LNG dan LPG /
Natural Gas, LNG and LPG
.
.
.
.
4.2.1 Gas Bumi /
Natural Gas
.
.
.
.
.
.
.
4.2.2 LNG .
.
.
.
.
.
.
.
.
4.2.3 LPG .
.
.
.
.
.
.
.
.
4.3
Batubara /
Coal
.
.
.
.
.
.
.
.
.
4.3.1 Neraca Batubara /
Coal Balance .
.
.
.
.
.
4.3.2 Pemanfaatan Batubara /
Coal Utilization
.
.
.
.
.
4.4
Energi Baru dan Terbarukan /
New and Renewable Energy .
.
.
.
4.5
Energi Primer /
Primary Energy
.
.
.
.
.
.
.
4.5.1 Penyediaan Energi Primer /
Primary Energy Supply
.
.
.
.
4.5.2 Neraca Energi /
Energy Balance
.
.
.
.
.
.
Bab 5
Proyeksi Kebutuhan dan Penyediaan Energi di Sektor Ketenagalistrikan
/
Projection of
Energy Demand and Supply in Electricity Sector
.
.
.
.
.
.
5.1
Proyeksi Kebutuhan Listrik Per Sektor /
Projection of Electricity Demand by Sector .
5.2
Proyeksi Kapasitas Pembangkit Listrik /
Power Plant Capacity Projection
.
.
5.3
Proyeksi Produksi Listrik /
Projection of Electricity Production
.
.
.
5.4
Proyeksi Kebutuhan Bahan Bakar Pembangkit Listrik /
Fuel Demand Projection for
Power Plant
.
.
.
.
.
.
.
.
.
5.5
Tambahan Kapasitas Pembangkit /
Additional Capacity of Power Plant
.
.
Bab 6 Pengembangan Energi untuk Mendukung Pembangunan Berkelanjutan
/
Energy
Development in Supporting Sustainable Development
.
.
.
.
.
6.1 Ruang Lingkup /
Framework
. .
.
.
.
.
.
6.2
Sektor Penghasil Emisi, Jenis Emisi, dan Faktor Emisi GRK /
Emission Producing
Sector, Emissions Type, and Emission Factor of GHG
.
.
.
.
6.3
Emisi
Baseline
/
Baseline Emission
.
.
.
.
.
.
6.4
Emisi Mitigasi /
Mitigation Emission
.
.
.
.
.
.
6.5
Intensitas Emisi GRK /
GHG Emission Intensity
.
.
.
.
.
6.6
Optimalisasi Mitigasi GRK /
Optimization of GHG Mitigation
.
.
.
Bab 7 Penutup
/
Closing
.
.
.
.
.
.
.
.
.
Daftar Pustaka /
References
.
.
.
.
.
.
.
.
.
Photo Credits
.
.
.
.
.
.
.
.
.
.
.
38
39
40
41
42
42
44
45
46
46
49
49
51
51
52
54
56
56
59
63
64
66
70
72
74
75
76
77
78
79
80
81
89
93
95
Bab 1. Pendahuluan
2013 atau tumbuh rata-rata sebesar 3,46% per tahun. Selama kurun waktu 2000-2013, pertumbuhan konsumsi energi ini dibayangi oleh pemberian subsidi energi yang terus meningkat dan membebani anggaran belanja negara. Oleh karena itu pemerintah mengeluarkan berbagai kebijakan untuk mengurangi subsidi tersebut.
Kebijakan yang diambil pemerintah dalam bidang energi antara lain adalah konversi minyak tanah dengan LPG untuk sektor rumah tangga, penggunaan bahan bakar gas (BBG) untuk sektor transportasi, dan mandatori penggunaan bahan bakar nabati (BBN), yang berlaku untuk industri, transportasi dan pembangkit listrik. Namun demikian masih banyak kendala yang dihadapi dalam implementasinya mengingat kebutuhan bahan bakar minyak (BBM) dari tahun ke tahun terus meningkat.
Kebijakan lain adalah pengendalian subsidi, khususnya subsidi energi melalui kebijakan penyesuaian harga BBM bersubsidi dan tarif tenaga listrik, serta pengendalian volume konsumsi BBM bersubsidi melalui substitusi BBM dengan menggunakan bahan bakar alternatif. Penerapan kebijakan ini diharapkan dapat menurunkan konsumsi BBM bersubsidi pada RAPBN-P 2015 yang mencapai Rp81.815,9 miliar, atau penurunan sebesar Rp194.197,3 miliar dibandingkan dengan pagunya Rp276.013,2 miliar pada APBN tahun 2015.
Sementara itu, beban subsidi listrik dalam RAPBN-P tahun 2015 diperkirakan mencapai Rp76.619,8 miliar, yang berarti mengalami peningkatan sebesar Rp7.930,1 miliar bila dibandingkan dengan pagunya dalam APBN tahun 2015 sebesar Rp 68.689,7 miliar.
Berbagai permasalahan energi saat ini dan yang mungkin muncul dimasa depan memerlukan solusi yang tepat dengan pendekatan yang komprehensif. Perencanaan dan pengembangan energi serta analisis terhadap pelaksanaan kebijakan yang ada perlu terus dilanjutkan guna merealisasikan penerapan teknologi energi bersih yang andal, berkelanjutan, dan terjangkau dalam rangka
by an average of 3.46% per year. During the period 2000-2013, energy consumption growth was overshadowed by energy subsidy that continues to rise and burden the national budget. Therefore, the government issued various policies to reduce such subsidies.
Policies taken by the government in energy sector include the conversion of kerosene to LPG in household sector, the use of CNG in transport sector, and the mandatory use of biofuels, which applies to industry, transport and power generation sectors. However, there are still many obstacles encountered in its implementation considering the rapid growth of oil fuel demand.
One of the policies taken is the subsidies control, especially in energy subsidies through the price adjustment policy of
oil fuel subsidy and electricity tariffs, as well as control the
volume of subsidized oil fuel through fuel substitution by using alternative fuels. Implementation of this policy is expected to reduce consumption of subsidized oil fuel as stated in the Revised National Budget 2015 reached Rp81,815.9 billion, a decrease of Rp194,197.3 billion compared with the limit Rp276,013.2 billion in National Budget 2015.
Meanwhile, the electricity subsidy in the Revised National Budget 2015 is estimated to reach Rp76.619,8 billion, which represented an increase of Rp7.930,1 billion compared with the Rp68.689,7 billion budget.
Various energy problems nowadays and that may emerge in the future require appropriate solutions with a comprehensive approach. Proper planning and development of energy as well as analysis about implementation of the existing policies should be continued in order to realize the application of clean energy technology that is reliable, sustainable
Introduction
3
2015 INDONESIA ENERGY OUTLOOK
mendukung penyusunan Rencana Umum Energi Nasional (RUEN) maupun Rencana Umum Energi Daerah (RUED) sesuai amanat UU No. 30 tahun 2007 tentang energi. Disamping itu, perlu mendukung kebijakan pemerintah dalam Perpres No. 61 Tahun 2011 tentang Rencana Aksi Nasional Penurunan Emisi Gas Rumah Kaca (RAN GRK) dalam upaya melaksanakan pembangunan yang berwawasan lingkungan.
Untuk tujuan itu, BPPT berusaha memberikan kontribusi melalui penerbitan secara berkala Buku Outlook Energi Indonesia. Outlook Energi Indonesia 2015 (BPPT-OEI 2015) memuat neraca energi, kebutuhan dan penyediaan energi, serta infrastruktur energi jangka panjang untuk kurun waktu 2013-2050 dengan mempertimbangkan potensi cadangan dan sumber daya energi, pertumbuhan ekonomi serta faktor-faktor yang berpengaruh lainnya. BPPT-OEI 2015 tidak berisi tentang kebijakan pemerintah di masa depan namun berisi analisis untuk melihat berbagai opsi untuk jangka panjang dan upaya-upaya yang perlu dilakukan untuk mencapai target yang ditetapkan.
Model energi untuk membuat proyeksi dengan jangka waktu yang sangat panjang akan menghadapi ketidakpastian yang cukup besar. Hal ini terkait dengan adanya transisi masyarakat yang cepat yang didorong oleh perubahan sosial, ekonomi, lingkungan, dan teknologi. Masa depan jangka panjang dapat didominasi oleh faktor-faktor yang sangat berbeda dari kondisi saat ini dan sulit untuk dibayangkan berdasarkan pengalaman saat ini. Model akan membantu untuk menentukan komponen kunci dari interaksi sistem yang berubah dari waktu ke waktu. Pembuatan skenario dalam model akan menyediakan kerangka pikir dalam menjawab pertanyaan
“what-if” mengenai berbagai kemungkinan tentang masa
depan yang mengandung ketidakpastian.
General Plan of National Energy (RUEN) and the General Plan for Regional Energy (RUED) as mandated by Law No. 30 of 2007 on energy. In addition, it is important to support the government policy in Presidential Decree No. 61 of 2011 on the National Action Plan for Reducing Emissions
of Greenhouse Gases (RAN GRK) in efforts to implement
environmentally sound development.
For that purpose, BPPT attempt to contribute by publishing Indonesia Energy Outlook annually. Indonesia Energy Outlook 2015 (BPPT-OEI 2015) discusses the energy balance, demand and supply of energy, as well as long-term energy infrastructure for the period 2013-2050 with taking into account the energy reserves and resource, economic
growth and other influencing factors. BPPT-OEI 2015 does
not propose government policies, but provides analysis of
various long-term options and efforts needed to achieve the
target set.
Energy model used to make projections with a long period of time will have a considerable uncertainty factor. This is related to the rapid transition of people who are driven by changes in social, economic, environmental, and technological. Long-term future may be dominated by factors which are very
different from the current conditions. The model will help
determine the key components of the system interactions that change from time to time. Making the scenario in the model will provide the framework in answering “what if” question about the various possibilities of the future.
Proyeksi kebutuhan energi dalam buku ini dilakukan dengan menggunakan model BPPT-MEDI (BPPT Model of Energy Demand for Indonesia). Asumsi-asumsi yang dipakai dalam BPPT-MEDI adalah sebagai berikut:
• Data konsumsi energi tahun dasar 2013 diperoleh
dari Handbook of Energy and Economic Statistics of Indonesia 2014, Kementerian ESDM.
• Pertumbuhan penduduk untuk periode 2013-2035
mengikuti proyeksi jangka panjang dari Bappenas dan BPS, sedangkan pertumbuhan untuk periode 2036-2050 disesuaikan dengan trend pertumbuhan sebelumnya.
• Rasio elektrifikasi dan elastisitas kebutuhan listrik
untuk periode 2013-2024 mengikuti Rencana Usaha Penyediaan Tenaga Listrik (RUPTL) PT. PLN (Persero). Sedangkan pertumbuhan kebutuhan listrik untuk periode 2025-2050 disesuaikan dengan trend pertumbuhan sebelumnya.
• Proyeksi pertambahan kereta api (baik kereta
penumpang maupun barang) mengikuti rencana PT. KAI.
• Angkutan masal yang dipertimbangkan adalah Mass
Rapid Transit (MRT) dan proyeksi pertambahannya mengikuti rencana PT. MRT Jakarta.
• Kebutuhan BBM tidak dibedakan antara BBM subsidi
dan non subsidi.
1.2.2 Model Penyediaan Energi
Untuk memenuhi kebutuhan energi, sumber-sumber energi primer yang ada di Indonesia dioptimasi dengan menggunakan model penyediaan energi. Asumsi penting yang dimasukkan ke dalam model penyediaan energi adalah:
• Pasokan dan kebutuhan gas bumi mengikuti Peta
Jalan Kebijakan Gas Bumi Nasional 2014-2030 (Kementerian ESDM), sedangkan untuk 2031-2050 mengikuti trend gas delivery dan proyeksi temuan eksplorasi. Ekspor gas bumi juga mengikuti Peta Jalan
Projections of energy demand in this outlook are done by using BPPT-MEDI (BPPT Model of Energy Demand for Indonesia) model. Assumptions used in BPPT-MEDI are as follows:
• Data of energy consumption at base year 2013 is
obtained from the Handbook of Energy and Economic Statistics of Indonesia 2014, Ministry of Energy and Mineral Resources (MEMR).
• The population growth for the period 2013-2035
follows the long-term projections of Bappenas and BPS, while for period 2036-2050 the growth is adjusted to the previous growth trend.
• The electrification ratio and demand elasticity of
electricity for the period 2013-2024 follow the Electrical Power Supply Business Plan (RUPTL) PT. PLN (Persero). As for the period 2025-2050, the electricity demand growth is adjusted to the previous growth trend.
• Projections on additional trains, both passenger and
freight trains, are following PT. KAI’s plans.
• Public transport being considered is the Mass Rapid
Transit (MRT) and its development projection follows the plan of PT. MRT Jakarta.
• The demand for oil fuel is not differentiated between
subsidized and non-subsidized fuel.
1.2.2 Energy Supply Model
To meet the energy demand, primary energy resources in Indonesia are optimized by using energy supply model. Important assumptions incorporated into the energy supply model are:
• The demand and supply of natural gas follow the
Roadmap of National Gas Policy 2014-2030 (M EMR), and for 2031-2050 it follows the trend of gas delivery
and projection of gas exploration finding. Export of
Introduction
5
2015 INDONESIA ENERGY OUTLOOK
1.2.3 Pemutakhiran Data
Sektor energi merupakan sektor yang dinamis. Banyak perubahan yang terjadi hanya dalam selang waktu satu tahun, baik dari segi sumber daya, sosial-ekonomi, maupun kebijakan. Oleh karena itu pemuktahiran data sangat diperlukan. Data-data yang telah dimutakhirkan dalam BPPT-OEI 2015 adalah data PDB, demografi, kilang minyak, FSRU (Floating Storage Regassification Unit), cadangan strategis dan potensi sumber daya energi, baik fosil maupun EBT, serta data ketenagalistrikan.
• Data cadangan batubara diperoleh dari Badan
Geologi tahun 2013. Sementara data minyak bumi mengikuti data Kementerian ESDM tahun 2014. Cadangan minyak yang dipertimbangkan adalah cadangan terbukti. Sedangkan cadangan batubara yang dipertimbangkan adalah cadangan terkira dan cadangan terbukti.
• Harga minyak mentah (harga berlaku) berdasarkan
data tahun 2014 sebesar 97,5 dolar per barel dan diasumsikan naik secara bertahap menjadi 189 dolar per barel pada tahun 2050.
• Pengembangan CBM berdasarkan data dari IATMI
(Ikatan Ahli Teknik Perminyakan Indonesia) yang dipresentasikan dalam The 5th International Indonesia CBM 2014.
• Teknologi coal to liquid (CTL) yang dipertimbangkan:
proses indirect coal liquefaction dengan kapasitas produksi 50 ribu barel per hari. CTL diasumsikan mulai beroperasi tahun 2030.
• Penambahan kilang minyak baru berdasarkan Renstra
Kementerian ESDM tahun 2015-2019. Setelah tahun 2025, penambahan kilang diasumsikan berlangsung setiap lima tahun dengan kapasitas 300 ribu barel per hari.
• Pembangkit listrik super-critical boiler untuk PLTU
batubara 1000 MW di wilayah Jawa mulai beroperasi tahun 2018.
• Konservasi energi di sisi kebutuhan maupun di
sisi penyediaan sudah dipertimbangkan melalui pemanfaatan teknologi yang efisien.
1.2.3 Data Update
Energy sector is one of the dynamic sectors in Indonesia. Many changes take place in the interval of one year, such in energy resources, socio-economic, and energy policy. Therefore, data updating is necessary. The data updated
in BPPT-OEI 2015 are GDP, demographics, oil refinery installations, FSRU (Floating Storage Unit Regassification),
strategic reserves and potential data of energy resources, both fossil and renewable energy, as well as electricity data.
• Data on coal reserves is obtained from the Geological
Agency in 2013. While the data of crude oil follows the 2014 data from the MEMR. Oil reserves being considered are the proven reserves and for coal reserves are the probable and proven reserves.
• Crude oil price is based on 2014 data with 97.5 dollar
per barrel (current price) and it assumed to rise gradually to 189 dollar per barrel in 2050.
• Development of CBM is based on data from IATMI
(Association of Indonesian Petroleum Engineers) presented at the 5th International Indonesia CBM 2014.
• Technology for coal to liquid (CTL) that is considered
includes indirect coal liquefaction process with production capacity of 50 thousand barrels per day. CTL is assumed to operate starting 2030.
• Addition of new oil refineries follows the Resources
Strategic Plan 2015-2019 of MEMR. The addition after
2025 is assumed to take place every five years with a
capacity of 300 thousand barrels per day.
• Super-critical boiler power plant for 1000 MW coal
power plant in Java region is to be utilized starting 2018.
• Conservation of energy on demand and supply side
has been considered through the use of efficient
model adalah tahun 2013 dengan kurun waktu proyeksi 2014-2050.
• Pembahasan dalam BPPT-OEI 2015 mencakup
skenario energi berkelanjutan (skenario EB) dan kasus emisi baseline.
• Skenario EB sudah mempertimbangkan substitusi
minyak tanah ke LPG, realisasi program percepatan pembangunan pembangkit listrik 10.000 MW tahap pertama untuk pembangkit berbahan bakar batubara, tahap kedua untuk mendorong penggunaan EBT, serta program 35.000 MW.
• Pada skenario EB pertumbuhan PDB
mempertimbangkan skenario progressive reform 2015-2019 dari Bappenas. Pada kurun waktu tersebut PDB meningkat rata-rata pertumbuhan sebesar 5,3% per tahun. Pertumbuhan PDB untuk kurun waktu 2020-2050 mengikuti trend tahun sebelumnya.
2014-2050.
• The discussion in BPPT-OEI 2015 covers the sustainable
development scenario (SE scenario) and the baseline emissions case.
• SE scenario considered several policies which include
the kerosene to LPG substitution program, realization
of 10,000 MW coal-fired power plants from the first
phase of fast track power development program, the second phase that encourage the use of renewable energy in power generation sector, and the 35,000 MW program.
• GDP growth in SE scenario considers the progressive
reform scenario 2015-2019 of Bappenas. GDP growth in that period increases by an average of 5.3% per year. The growth for period 2020-2050 is adjusted to the trend of previous years.
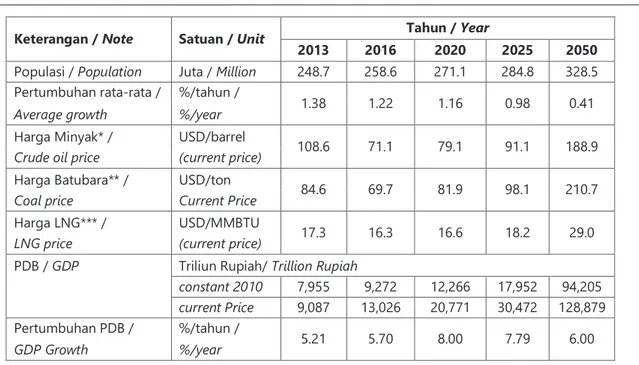
Tabel 1.1 Asumsi pertumbuhan populasi, harga energi dan PDB Table 1.1 Growth assumptions for population, energy price, and GDP
Catatan/ Note : *) Brent Price **) Australian Coal ***) CIF on Japan
Sumber: Diolah berdasarkan World Bank (2015), IMF (2015) dan Knoema (2015) / Source: Calculated based on World Bank (2015), IMF (2015) and Knoema (2015)
Keterangan / Note Satuan / Unit Tahun / Year
2013 2016 2020 2025 2050
Populasi / Population Juta / Million 248.7 258.6 271.1 284.8 328.5 Pertumbuhan rata-rata / %/tahun /
1.38 1.22 1.16 0.98 0.41
Average growth %/year
Harga Minyak* / USD/barrel 108.6 71.1 79.1 91.1 188.9
Crude oil price (current price)
Harga Batubara** / USD/ton 84.6 69.7 81.9 98.1 210.7
Coal price Current Price
Harga LNG*** / USD/MMBTU 17.3 16.3 16.6 18.2 29.0
LNG price (current price)
PDB / GDP Triliun Rupiah/ Trillion Rupiah
constant 2010 7,955 9,272 12,266 17,952 94,205 current Price 9,087 13,026 20,771 30,472 128,879
Pertumbuhan PDB / %/tahun / 5.21 5.70 8.00 7.79 6.00
Introduction
7
2015 INDONESIA ENERGY OUTLOOK
1.3.2 Kasus
1.3.2 Case
Kasus yang akan dibahas dalam BPPT-OEI 2015 adalah kasus emisi baseline. Pembahasan kasus ini difokuskan pada perkiraan proyeksi emisi gas rumah kaca (GRK) tanpa mempertimbangkan pemanfaatan teknologi mitigasi dalam kurun waktu 2014-2050 yang dapat menyebabkan terjadinya penurunan emisi GRK. Hasil analisis diharapkan dapat menjadi sumbangsih sektor energi dalam mendukung komitmen pemerintah Indonesia untuk menurunkan emisi GRK pada tahun 2020 sebesar 26% dengan upaya sendiri dan sebesar 41% apabila ada dukungan internasional.
The case discussed in the BPPT-OEI 2015 is case of baseline emissions. The discussion in this case is focused on projected emission levels of greenhouse gases (GHG) without any mitigation technologies in the period 2014-2050 which could lead to a decrease in GHG emissions. Results of the analysis are expected to be considered as contribution of energy sector in supporting Indonesian government’s commitment
to reduce GHG emissions in 2020 by 26% by its own efforts
and by 41% if there is international support.
Gambar 1.1 Asumsi pertumbuhan ekonomi Figure 1.1 Assumptions of economic growth
Sumber : CDIEMR (2014) dan asumsi sendiri /
Source : CDIEMR (2014) and own assumption Pendapatan per
kapita / Income per
capita 2000 2005 2010
2015 2020 2025
2050
Pendapatan Tinggi /
High Income
Pendapatan Menengah Atas/
Upper Middle Income
Pendapatan Menengah Bawah /
Lower Middle Income
Pendapatan Rendah / Lower Income $ 706 2000 $12,616 $1,036 $4,086 2005 $ 1,284
Middle income trap 2010 $ 3,006 2050 $220,120 2020 $ 6,727 Catatan / Note: 2015-2050: 1$ = Rp12,000 2025 $ 12,317 2030 $ 22,415 2013 $ 2,997
Bab 2. Kondisi dan Permasalahan Energi Saat Ini
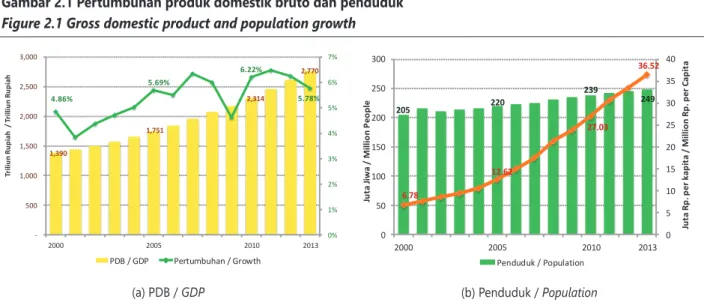
2000 menjadi mencapai 2.770 triliun rupiah pada tahun 2013. Pertumbuhan PDB selama kurun waktu 2000-2013 rata-rata mencapai 5,45% per tahun. Pada tahun 2013, pertumbuhan ekonomi nasional meningkat menjadi sebesar 5.78% per tahun. Pada tahun 2015 Bank Indonesia memprediksi pertumbuhan ekonomi sekitar 5.4% - 5.8% per tahun yang lebih optimis dari pada prediksi dari IMF yang hanya sebesar 5,1%, Bank Dunia 5.2% dan INDEF antara 5.3 %-5,6% (Setjen DPR, 2015).
Penduduk Indonesia mencapai 205 juta jiwa pada tahun 2000 dan meningkat menjadi lebih dari 254 juta jiwa pada 2013. Pertumbuhan penduduk dalam kurun waktu 2000-2013 tersebut rata-rata sebesar 1,66% per tahun.
PDB per kapita (harga berlaku) meningkat dari 6,78 juta rupiah per kapita pada tahun 2000 menjadi 36,52 juta rupiah per kapita pada tahun 2013. PDB per kapita dalam dolar terjadi penurunan dari 3.469 dolar per kapita pada tahun 2012 menjadi sebesar 2.997 dolar per kapita pada tahun 2013. Penurunan ini disebabkan karena kenaikan kurs dolar terhadap rupiah dari sebesar 9.670 rupiah per dolar pada tahun 2012 menjadi 12.189 rupiah per dolar pada tahun 2013. Berdasarkan kriteria Bank Dunia, Indonesia pada tahun 2013 termasuk negara berpendapatan menengah bawah.
in 2013. GDP growth over the period 2000-2013 reached an average of 5.45% per year. In 2013, the national economic growth increased to 5.78% per year. Bank Indonesia in 2015 predicts economic growth of around 5.4% - 5.8% per year that is more optimistic than predictions of the IMF which is only 5.1%, the World Bank 5.2% and INDEF between 5.3% -5.6% (Setjen DPR, 2015).
Indonesia’s population reached 205 million in 2000 and increased to more than 254 million by 2013. The average population growth on the period 2000-2013 is 1.66% per year.
GDP per capita (current price) has increased from 6.78 million rupiah per capita in 2000 to 36.52 million rupiah per capita in 2013. GDP per capita in dollar decreased from 3,469 dollar per capita in 2012 amounted to 2,997 dollar per capita in 2013. The decrease is due to the increase in the exchange rate of dollar against rupiah from 9,670 rupiah per dollar in 2012 to 12,189 rupiah per dollar in 2013. Based World Bank criteria, Indonesia in 2013 was included in the lower middle income countries.
Gambar 2.1 Pertumbuhan produk domestik bruto dan penduduk Figure 2.1 Gross domestic product and population growth
1,390 1,751 2,314 2,770 4.86% 5.69% 6.22% 5.78% 0% 1% 2% 3% 4% 5% 6% 7% 500 1,000 1,500 2,000 2,500 3,000 2000 2005 2010 2013 Tr ili un Ru pi ah / Tr ill iu n Ru pi ah PDB / GDP Pertumbuhan / Growth 205 220 239 249 6.78 12.62 27.03 36.52 0 5 10 15 20 25 30 35 40 0 50 100 150 200 250 300 2000 2005 2010 2013 Ju ta Ji w a / M ill io n Peo pl e Penduduk / Population Ju ta Rp . p er k ap ita / M ill io n Rp . p er C ap ita
11
2015 INDONESIA ENERGY OUTLOOK
764 835 1,011 1,152 0 200 400 600 800 1,000 1,200 1,400 2000 2005 2010 2013 Ju ta SB M / M ill ion BO E Lainnya / Other Komersial / Commercial Transportasi / Transportation Rumah Tangga / Household Industri / Industry Total
2.2 Konsumsi Energi Final
Final Energy Consumption
2.2.1 Konsumsi Energi Final per Sektor
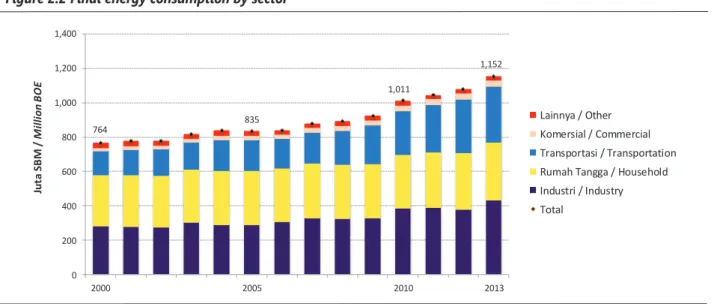
Konsumsi energi final (termasuk biomassa) pada periode 2000-2013 meningkat dari 764 juta SBM pada tahun 2000 menjadi 1.151 juta SBM pada tahun 2013 atau meningkat rata-rata 3,20% per tahun. Konsumsi energi final tersebut
tidak mempertimbangkan other petroleum products, seperti
pelumas, aspal, dan lainnya, di sektor industri.
Pada tahun 2013 pangsa terbesar penggunaan energi adalah sektor industri (37,17%) diikuti oleh sektor rumah tangga (29,43%), transportasi (28,10%), komersial (3,24%), dan lainnya (2,04%). Selama kurun waktu 2000-2013, sektor transportasi mengalami pertumbuhan terbesar yang mencapai 6,71% per tahun, diikuti sektor komersial (4,65%), dan sektor industri (3,35%). Sedangkan untuk pertumbuhan di sektor rumah tangga hanya sebesar 1,03%, dan sektor lainnya mengalami penurunan sebesar 1,65%.
Tingginya pertumbuhan konsumsi energi sektor transportasi disebabkan pesatnya pertumbuhan kendaraan bermotor sebesar 13,99% per tahun dalam kurun waktu 2000-2013 yang didominasi oleh kendaraan pribadi dan tranportasi komersial (bis dan truk). Sektor rumah tangga mempunyai pertumbuhan konsumsi energi yang rendah karena adanya pemanfaatan peralatan dan teknologi yang lebih efisien seperti penggunaan LPG dan listrik.
2.2.1 Final Energy Consumption By Sector
Final energy consumption (including biomass) in the period 2000-2013 increased from 764 million BOE in 2000 to 1,151 million BOE in 2013 or grow an average of 3.20% per year.
The final energy consumption does not take account of
other petroleum products, such as lubricant, asphalt, etc., in industry sector.
In 2013, the largest share of energy demand was industry sector (37.17%) followed by household (29.43%), transportation (28.10%), commercial (3.24%), and other sector (2.04%). During the period 2000-2013, transportation sector experienced the largest growth reached 6.71% per year, followed by commercial sector (4.65%), and industry sector (3.35%). The growth in household sector amounted to only 1.03%, and other sectors decreased by 1.65%.
The high rate growth of final energy consumption in
transportation sector due to the rapid growth of motor vehicles to reach about 13.99% per year in the period 2000-2013, which was dominated by private vehicles and commercial transport (bus and truck). Energy consumption
growth of household sector is low due to efficiency
improvement in equipment and technologies such as the use of LPG and electricity.
Gambar 2.2 Konsumsi energi final per sektor Figure 2.2 Final energy consumption by sector
2.2.2 Konsumsi Energi Final Per Jenis
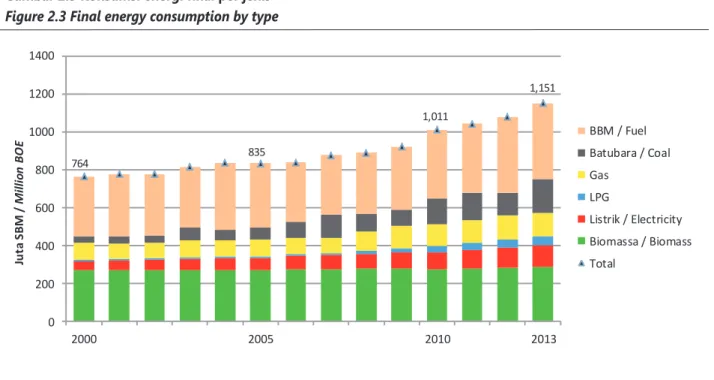
Konsumsi energi final menurut jenis selama tahun 2000-2013 masih didominasi oleh BBM (bensin, minyak solar, IDO, minyak tanah, minyak bakar, avtur dan avgas). Selama kurun waktu tersebut, total konsumsi BBM meningkat dari 315 juta SBM pada tahun 2000 menjadi 399 juta SBM pada tahun 2013 atau meningkat rata-rata 1,83% per tahun. Pada tahun 2000, konsumsi minyak solar mempunyai pangsa terbesar (38,7%) disusul minyak tanah (23,4%), bensin (23,0%), minyak bakar (9,6%), IDO (3%) dan avtur (2,2%). Selanjutnya pada tahun 2013 menjadi minyak solar (45,4%), bensin (44,5%), avtur (6,1%), dan minyak tanah serta minyak bakar masing-masing sebesar 1,9%.
Perubahan pola konsumsi BBM tersebut disebabkan oleh tingginya laju konsumsi bahan bakar untuk kendaraan pribadi dan pesawat udara. Konsumsi BBM di sektor transportasi memiliki pangsa yang sangat tinggi yaitu 81% dari total konsumsi BBM. Sedangkan di sektor yang lain sudah dilakukan berbagai program untuk mengurangi BBM seperti diversifikasi energi di sektor industri dan program substitusi minyak tanah dengan LPG di sektor rumah tangga.
Konsumsi batubara meningkat pesat dari 36,1 juta SBM pada tahun 2000 menjadi 178,8 juta SBM pada tahun 2013 atau meningkat rata-rata 13,1% per tahun. Sebagian besar batubara tersebut digunakan untuk memasok kebutuhan energi sektor industri serta mendukung proyek pembangkit listrik 35 ribu MW karena sebagian besar bahan bakar pembangkit berasal dari batubara.
Konsumsi gas bumi periode 2000-2013 meningkat dengan laju pertumbuhan rata-rata 2,8% per tahun. Rendahnya
pertumbuhan tersebut disebabkan keterbatasan
infrastruktur jaringan gas nasional yang mengakibatkan pasokan gas bumi untuk memenuhi kebutuhan industri terbatas. Besarnya konsumsi gas bumi untuk kebutuhan domestik mencapai 59,45% dan sisanya dialokasikan untuk ekspor. Pemanfaatan gas bumi diharapkan memproritaskan kebutuhan dalam negeri dengan mempertimbangkan ketersediaan infrastruktur, cadangan dan keekonomian yang didukung oleh regulasi pemerintah.
2.2.2 Final Energy Consumption By Type
Final energy consumption by type, during the years 2000-2013, was dominated by oil fuel (gasoline, diesel oil, IDO, kerosene, fuel oil, avtur and avgas). During this period, the total oil fuel consumption increased from 315 million BOE in 2000 to 399 million BOE in 2013, increased of an average of 1.83% per year. In 2000, the consumption of diesel oil has the largest share (38.7%) followed by kerosene (23.4%), gasoline (23.0%), fuel oil (9.6%), IDO (3%) and avtur (2.2%). Subsequently in 2013 the order is shifted into diesel oil (45.4%), gasoline (44.5%), avtur (6.1%), kerosene (1.9%), and fuel oil (1.9%).
Patterns change on oil fuel consumption is due to the high rate consumption of gasoline by private cars and aircraft. The oil fuel consumption in the transport sector has a very high share of 81% of total oil fuel consumption. Meanwhile, other sectors have been carried out various programs to
reduce oil fuel such as energy diversification in the industrial
sector and substitution of kerosene with LPG program in the household sector.
Coal consumption increased from 36.1 million BOE in 2000 to 178.8 million BOE in 2013, rise with an average of 13.1% per year. The consumption of coal is mainly used to meet the energy demand of industry sector and supports the project of 35 thousand MW power plant as most plant fuel comes from coal.
Consumption of natural gas in period 2000-2013 increased with an average growth rate of 2.8% per year. Limitation in infrastructure and distribution of national gas transmission has also limited natural gas supply to meet the demand of industry. Consumption of natural gas for domestic consumption reached 50.3% and the remainder is allocated for export. Utilization of natural gas is expected to prioritize domestic demand with taking into account the availability of infrastructure, reserves and economics which are supported by government regulation.
Current Energy Conditions and Issues
13
2015 INDONESIA ENERGY OUTLOOK
764 835 1,011 1,151 0 200 400 600 800 1000 1200 1400 2000 2005 2010 2013 Ju ta S BM / M ill io n BO E BBM / Fuel Batubara / Coal Gas LPG Listrik / Electricity Biomassa / Biomass Total
Konsumsi listrik dalam kurun waktu tahun 2000-2013 mengalami pertumbuhan rata-rata 6,8% per tahun, masih lebih rendah dibanding batubara (13,1%), dan LPG (14,5%). Hal ini menyebabkan rasio elektrifikasi nasional masih 80,4% pada tahun 2013 yang berarti 19,6% penduduk Indonesia belum dialiri listrik. Kondisi lain juga terlihat pada konsumsi listrik per kapita di Indonesia yang masih rendah dibandingkan beberapa negara ASEAN. Konsumsi listrik di Indonesia sebesar 733 kWh/kapita, Thailand (2.479 kWh/ kapita), Malaysia (4.313 kWh/kapita), Singapura (8.690 kWh/kapita), dan Brunai Darussalam (8.944 kWh/kapita). Adanya rencana pembangkit 35 ribu MW diharapkan dapat memenuhi kekurangan elektrifikasi dan mendorong perekonomian nasional.
Electricity consumption during the period 2000-2013 had an average growth of 6.8% per year, which was still lower than coal (13.1%), and LPG (14.5%). This led to the
national electrification ratio that only reach 80.4% in 2013.
This means that 19.6% of the Indonesian population has
not been electrified yet. Electricity consumption per capita
in Indonesia was also still low compared to some ASEAN countries. Electricity consumption in Indonesia was 733 kWh/capita as to Thailand (2,479 kWh/capita), Malaysia (4,313 kWh/capita), Singapura (8,690 kWh/capita), and Brunai Darussalam (8,944 kWh/capita). The planned 35 thousand MW power plant is expected to meet the shortage
of the electrification and stimulate the national economy.
Gambar 2.3 Konsumsi energi final per jenis Figure 2.3 Final energy consumption by type
mata dilakukan oleh PT PLN (Persero) saja, tetapi juga dilakukan oleh pihak swasta, yaitu Independent Power Producer (IPP), Private Power Utility (PPU) dan Ijin Operasi (IO) non BBM.
Pada tahun 2013 kapasitas total pembangkit nasional (PLN, IPP, PPU, IO non BBM) di wilayah Indonesia adalah sebesar 45,3 GW. Sekitar 74% diantaranya berada di wilayah Jawa Bali, 15% di wilayah Sumatera, 3% di wilayah Kalimantan dan sisanya di wilayah Pulau Lainnya (Sulawesi, Maluku, NTB-NTT, dan Papua). Dilihat dari segi input bahan bakar, pembangkit berbahan bakar batubara dan gas mempunyai pangsa yang paling tinggi, yaitu masing-masing sebesar 44% (20 GW) dan 26% (12 GW), diikuti kemudian oleh pembangkit berbahan bakar minyak dengan pangsa sekitar 15% (6,8 GW). Masih tingginya pangsa pembangkit BBM diimbangi dengan makin meningkatnya pangsa pembangkit berbahan bakar energi terbarukan, seperti PLTP, dengan pangsa mendekati 3% (1,3 GW), serta PLTA dengan pangsa dikisaran 11% (5,1 GW). Disamping itu, pembangkit listrik EBT lainnya (PLTS, PLTB, PLTSa, PLTMH, PLTU Biomassa) juga sudah mulai banyak beroperasi dengan kapasitas total 148 MW.
Selanjutnya, dari sisi penyediaan tenaga listrik, pada tahun 2013 tersebut pembangkit listrik PLN masih mendominasi dengan pangsa lebih dari 76% (34,2 GW), pembangkit listrik IPP dikisaran 17% (7,7 GW), serta sisanya diisi pembangkit listrik PPU dan pembangkit listrik IO non BBM dengan pangsa dikisaran 7% (3,4 GW).
by the private sector, namely Independent Power Producer (IPP), Private Power Utility (PPU) and Operation Permit (IO) non oil fuel.
In 2013 the total national power generation capacity (PLN IPP, PPU, and IO non oil fuel) in Indonesia was of 45.3 GW. Approximately 74% of them are in Java and Bali, as well as 15% in Sumatera, 3% in Kalimantan. The rest are in Other Islands (Sulawesi, Maluku, NTB-NTT, and Papua). In
terms of input fuel, coal-fired plants and gas has the highest
share, which amounted to 44% (20 GW) and 26% (12 GW),
followed by oil-fired plants with a share of around 15% (6.8
GW). The still high share of oil fuel plants was balanced by the increasing share of renewable energy power plants, such as geothermal, with a share of close to 3% (1.3 GW), as well as hydro-based generation with a share of 11% (5.1 GW). In
addition, other NRE pp such as solar pp, wind pp, landfill pp,
micro hydro pp, biomass pp have also started operating with a total capacity of 148 MW.
Furthermore, in terms of electricity supply, by 2013 electricity generation by PLN still dominates with a share of more than 76% (34.2 GW), IPP power plants with a share of 17% (7.7
GW), and the rest filled with the PPU and IO non oil fuel
15
2015 INDONESIA ENERGY OUTLOOK
2.4 Potensi Sumber Daya Energi
Energy Resources Potential
2.4.1 Potensi Sumber Daya Energi Fosil
Indonesia memiliki potensi energi fosil yang cukup beragam yaitu minyak bumi, gas bumi dan batubara. Cadangan terbukti minyak bumi sebesar 3,6 miliar barel, gas bumi sebesar 100,3 TCF dan cadangan batubara sebesar 31,35 miliar ton. Bila diasumsikan tidak ada penemuan cadangan baru maka minyak bumi akan habis dalam 13 tahun, gas bumi 34 tahun dan batubara 72 tahun. Energi fosil telah menjadi penggerak pertumbuhan ekonomi Indonesia dimasa lalu dan saat ini, dimasa depan masih
ada potensi energi lainnya seperti coal bed methane, shale
gas, dan energi baru terbarukan yang perlu dioptimalkan
pemanfaatannya.
2.4.1 Fossil Energy Resource Potential
Fossil energy potential in Indonesia is quite diverse, namely oil, natural gas and coal with proven oil reserves of 3.6 billion barrels, 100.3 TCF of natural gas and 31.35 billion tonnes
of coal specifically. Assuming there is no discovery of new
reserves, the oil will run out in 13 years, natural gas in 34 years and coal in 72 years. Fossil energy has been the driving force of economic growth in Indonesia. Moreover there are still abundant energy potential such as coal bed methane, shale gas, and renewable energy that their utilization still needs to be optimized.
Tabel 2.1 Sumber daya energi fosil Table 2.1 Fosil energy resources
No. Jenis Energi/
Energy Type Satuan / Unit Sumber Daya / Resource Cadangan / Reserve
1 Minyak Bumi / Miliar Barel / 151 Proven 3.6
Oil Billion Barrel +Potential 7.4
2 Gas Bumi / TSCF 487 Proven 100.3
Gas +Potential 149.3
3 Batubara /
Coal Miliar Ton / Billion Ton 120.5 31.35
Sumber / Source: KESDM (2015)
2.4.2 Potensi Sumber Daya Energi Baru dan
Terbarukan
Selama ini peranan energi fosil masih mendominasi pemanfaatan energi Indonesia. Diperlukan adanya perubahan paradigma pengelolaan energi yang mengedepankan diversifikasi dan konservasi energi sehingga peran EBT akan lebih maksimal. EBT diharapkan dapat menjadi penopang utama penyediaan energi nasional di masa depan. Oleh karena itu sebagai langkah awal, proses pemetaan potensi EBT Indonesia penting untuk dilakukan.
2.4.2 New and Renewable Energy Resource
Potential
Role of fossil fuels still dominate the energy utilization in
Indonesia. A paradigm shift that emphasizes diversification
of energy management and energy conservation is necessary so that the role of renewable energy can be maximized. NRE is expected to be the main pillar of the national energy
supply in the future. Therefore, as a first step, the process of
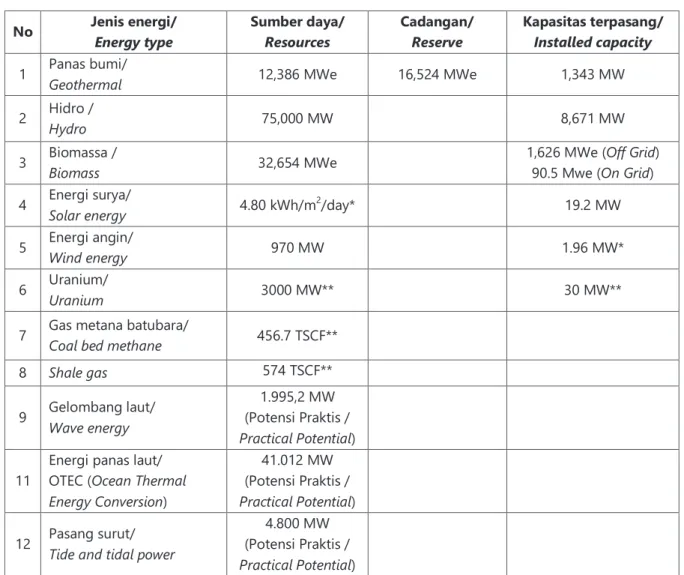
Tabel 2.2 Sumber daya energi baru dan terbarukan Table 2.2 New and renewable energy resources
Sumber / Source: Ditjen EBTKE, 2014 / Directorate General of NRE&EC, 2014
*) Ditjen EBTKE, 2013 / Directorate General of NRE&EC, 2013
**) KESDM, 2013 / MEMR, 2013
No Jenis energi/ Energy type Sumber daya/ Resources Cadangan/ Reserve Kapasitas terpasang/ Installed capacity
1 Panas bumi/ Geothermal 12,386 MWe 16,524 MWe 1,343 MW
2 Hidro / Hydro 75,000 MW 8,671 MW
3 Biomassa / Biomass 32,654 MWe 1,626 MWe (90.5 Mwe (On GridOff Grid) )
4 Energi surya/ Solar energy 4.80 kWh/m2/day* 19.2 MW
5 Energi angin/ Wind energy 970 MW 1.96 MW*
6 Uranium/ Uranium 3000 MW** 30 MW**
7 Gas metana batubara/ Coal bed methane 456.7 TSCF** 8 Shale gas 574 TSCF**
9 Gelombang laut/ Wave energy
1.995,2 MW (Potensi Praktis /
Practical Potential) 11
Energi panas laut/
OTEC (Ocean Thermal
Energy Conversion)
41.012 MW (Potensi Praktis /
Practical Potential) 12 Pasang surut/ Tide and tidal power (Potensi Praktis / 4.800 MW
17
2015 INDONESIA ENERGY OUTLOOK
2.5 Permasalahan Energi Saat Ini
Current Energy Issues
• Jumlah penduduk Indonesia pada tahun 2013
mencapai 242 juta jiwa meningkat dari 205 juta jiwa pada tahun 2000 dengan pertumbuhan rata-rata 1,24% per tahun. Sekitar 57% penduduk tinggal di pulau Jawa dengan luas wilayah 129.438 km2 atau sekitar 6,7% wilayah daratan Indonesia.
• Produksi minyak terus menurun sementara permintaan
BBM terus tumbuh yang menyebabkan peningkatan impor minyak mentah dan produk olahan. Sampai tahun 2014 subsidi energi terus meningkat, yang disebabkan oleh peningkatan konsumsi domestik, kenaikan harga minyak internasional dan penurunan nilai tukar rupiah terhadap dolar AS dan valuta asing lainnya. Dalam rangka mengoptimalkan anggaran untuk kesejahteraan rakyat, sejak tahun 2015 Pemerintah melaksanakan pengendalian subsidi, khususnya subsidi energi melalui kebijakan penyesuaian harga BBM bersubsidi dan tarif dasar listrik, serta volume konsumsi BBM bersubsidi. Sehingga alokasi pengurangan subsidi dapat dimanfaatkan untuk peningkatan infrastruktur dan kebutuhan lainnya.
• Potensi gas bumi yang dimiliki Indonesia cukup besar
tetapi pemanfaatan gas bumi dalam negeri masih belum optimal. Terminal penerimaan dan regasifikasi
LNG serta Floating Storage and Regasification Unit
(FSRU) perlu diperluas di beberapa tempat untuk meningkatkan pemanfaatan gas dalam negeri.
• Pemanfaatan LPG untuk kapal perikanan nelayan kecil,
pemanfaatan gas untuk transportasi serta perluasan jaringan pipa gas kota merupakan beberapa hal yang perlu mendapat perhatian. Distribusi gas di daerah terpencil dalam bentuk LPG dan gas bumi akan memerlukan sistem distribusi yang memadai termasuk infrastruktur pemasok dan pengguna gas, agar pembangunan di daerah bisa berjalan dengan baik.
• The population of Indonesia in 2013 reached 242
million increased from 205 million in 2000 with an average growth of 1.24% per year. Approximately 57% of the population lives on the island of Java with an area of 129,438 km2, or about 6.7% of Indonesia’s land.
• Oil production continues to decline while the demand
for oil fuel continues to grow which causes an increase
in imports of crude oil and refined products. Therefore,
in 2014, fuel subsidies were relatively high, due to the increase in domestic consumption, the increase in international oil prices and the decline of the rupiah against the US dollar and other foreign currencies. In order to optimize the budget for public welfare, in 2015 the Government is planned to control the subsidies, especially energy subsidies through price adjustment
policy of oil fuel subsidy and electricity tariffs, as well
as the volume of subsidized oil fuel consumption. So that the allocation of subsidy reduction can be utilized for the improvement of infrastructure and other needs.
• The potential of natural gas owned by Indonesia
is quite large but its domestic utilization is still not
optimal. Floating Storage and Regasification Unit
(FSRU) need to be built to improve the utilization of gas in the country.
• Utilization of LPG for small fishing boats, the use of gas
for transportation as well as the expansion of city gas pipeline network need special attention. Distribution of natural gas in remote areas in the form of LPG and gas will require adequate and reliable gas distribution system, including infrastructure for gas suppliers and users, in order to smooth regional development.
2.5.1 Permasalahan Umum
Secara umum sektor energi saat ini menghadapi tantangan baik secara global maupun dalam lingkup nasional. Beberapa permasalahan aktual saat ini diantaranya :
2.5.1 General Issues
In general, energy sector is currently facing challenges in both global and national scope. Some actual problems are:
• Mengingat pengembangan energi terbarukan memiliki kendala yang cukup berat, antara lain potensi yang kecil dan tersebar, investasi yang tinggi dan letak kebutuhan energi jauh dari lokasi potensi energi. Target pengembangan energi terbarukan yang relatif tinggi akan memerlukan perhatian dalam pelaksanaan pembangunannya.
• Dalam program kelistrikan target pengembangan 35
GW dalam 5 tahun memerlukan perhatian, khususnya dalam perijinan, pembebasan lahan, investasi, serta alih teknologi dalam rangka kemandirian energi.
• Peningkatan pembangkit listrik tenaga uap batubara
akan memerlukan jaminan dalam pembiayaan. Hal ini disebabkan lembaga finansial seperti World Bank segan untuk memberikan bantuan pendanaan sejalan dengan kecenderungan dunia untuk mengurangi penggunaan batubara yang dianggap sebagai pengotor lingkungan.
• Dalam kaitan pengembangan cadangan energi
nasional yang terdiri dari cadangan strategis, cadangan penyangga dan cadangan operasional, maka saat ini Indonesia hanya memiliki cadangan operasional BBM yang hanya untuk 13 - 33 hari (premium, avtur, dan FO 13 hari, solar 15 hari, dan minyak tanah 33 hari) tidak termasuk cadangan untuk operasional kilang adalah sangat mengkuatirkan. Sementara itu gagasan untuk mengembangkan cadangan operasional rata-rata 30 hari akan sulit direalisir dan harus direncanakan secara hati hati dan konsisten karena meliputi perencanaan luas yang meliputi lokasi, volume penyimpanan, penyiapan infrastruktur baik pelabuhan, tanki minyak dan BBM, kapal, pendanaan dan lainnya.
• Development of renewable energy has a fairly severe
constraints, i.e. the potency is small and scattered, high investment and the energy demand location is far from energy potential location. The development target of renewable energy is high, thus it will need extra attention in the implementation of its development.
• In the electricity program, development targets of 35
GW in the next 5 years require attention, particularly in the permitting, land acquisition, investment, and technology transfer in the context of energy independence.
• Development of coal fired power generation will require
a guatartee for funding. Financial institutions such as
the World Bank are reluctant to provide financial loan
considering the world’s trend to reduce the use of coal which is considered as environment pollutant.
• Relating to the development of national energy
reserves that consist of strategic reserves, reserve
buffer and operational reserves, Indonesia has only
13-33 days of operational reserves of oil fuel (gasoline, avtur, and FO for 13 days, HSD 15 days, and kerosene
33 days) excluding the crude oil reserves for refinery’s
operations which is very worrying. Meanwhile, the idea to develop a operation reserve at an average of
30 days will be difficult to be realized and should be
planned carefully and consistently because it includes extensive planning, including the location, the volume of storage, preparation of infrastructure such as ports, crude oil and oil fuels tankers, ship, funding and others.
2.5.2 Permasalahan Sektor Transportasi
Sektor yang langsung berpengaruh dan dipengaruhi oleh pembangunan ekonomi melalui pengembangan industri, pertumbuhan penduduk dan pertambangan dan pertumbuhan sektor komersial adalah sektor transportasi.
2.5.2 Transportation Sector Issues
Sectors that directly affect and are affected by economic
development through industrial, mining and commercial sector development, population growth is the transportation sector.