Food Security Development : Case Study in
Bandung City
Roni Kastaman
1), Insy Alimatun Hasanah
2), Totok Pujianto
1), Efri Mardawati
1) 1)Academic Staff of Agroindustrial Technology Department,Faculty of Agroindustrial Technology, Padjadjaran University Jln. Raya Bandung Sumedang KM 21, Jatinangor 45363 – Indonesia.
E-mail : [email protected]
2)Alumni of Faculty of Agroindustrial Technology, Padjadjaran University
Jln. Raya Bandung Sumedang KM 21, Jatinangor 45363 – Indonesia. E-mail : [email protected]
Abstract
In orther to evaluation the food security development in Bandung, researcher has been conducted in the form of software design to measure the performance of food security development from the aspect of food availability, food accessibility and the utilization and quality of food. The software is created in Microsoft Excel base as an analytics tool. The data used as the material of analysis was taken from the report of the institutions related to the food security development. Data here, is a source for scoring and weghting of the 3 food security dimensions which is filled in the software. List of contents for the analysis of food availability, food access and utilization and quality of food aspect are consist of 27 criteria, 12 criteria and 12 criteria respectively. The evaluation is done based on the calculation of the total value of weight multiplication with the score of each criteria, where the maximum total value is 5000 and minimum 1000. Justification of performance condition of food security performance described in the software is based on 5 categories class, that is from 1000 to 1800 total value performance for unsafe conditions , then 1800 to 2600 for unsafe conditions , 2600 to 3400 for fairly safe conditions , 3400 to 4200 for safe conditions and 4200 to 5000 for very safe conditions . The result of evaluation by using data in Bandung City of year 2012 and year 2015 indicate that condition of Bandung food security in terms of availability is fairly safe , food access is safe and the utilization and quality of food is in
fairly safe condition.
Keyword : Food security software, food availability, food accessibility, food utilization
1. INTRODUCTION
The term of Food availability is related with the availability of sufficient quantities of food of appropriate quality, supplied through domestic production or imports including food aid . Meanwhile the term of Food accessibility is about Access by individuals to adequate resources (entitlements) for acquiring appropriate foods for a nutritious diet . And The trem of food Utilization is about Utilization of food
through adequate diet, clean water, sanitation and health care to reach a state of nutritional well-being where all physiological needs are met .(FAO, [1]).
In fact, it is not easy to measure food security performance due to many variable relate with those aspect it is because the availability of data.
Negative impact of food security condition can give food insufficiency, lack of nutritional quality, lack of food, lack of the quality of life of urban residents and also impact to economic value especially on purchasing power (Brown et.al. [2]).
There are several factors can affect to food security situation such as droughts, pro-longed dry spells, limited access to inputs, as well as urban poverty. So that the factors could be considered as evaluation variable in this method (Hanyani-Mlambo and Odreck Mukorera, [3]).
In order to monitor and evaluation of food security condition, every city in many country hopefully makes preparation tool to control it periodically. In digital era, monitoring process and evaluation can be easier to do by using information technology.
In relation with this issue, Bandung as a small city with a big population also has masterplan to monitor and evaluation of food security. In 2012, Bandung Planning Agency (Bapeda Kota Bandung), has cooperated with researcher from LPPM of Padjadjaran University to make grand design food security.
In that occasion, focus of the research was how to measure food security in easiest, effective and efficient. The back ground was that reality condition in Bandung city that based on Kastaman et.al. [4], the city of Bandung is only able to supply food needs from internal food production about 15%. While the rest food supply imported from other regions.
Accordance with the dimensions of
FAO’s food security, to carry out periodic evaluation of food security condition in Bandung, since 2012 Bapeda (Bandung Regional Planning Agency) along with the Agriculture and Food Security Board has measured food security condition with specific food security model (Bapeda Kota Bandung, [5]). The measurement has a role to the urban agriculture of Bandung .
This action is very important to support the food security from household level to the community level. Therefore, even small agricultural activity in the city will be meaningful for the development of food security in the future (CFSUAC, [6]).
In measuring food security, the situation and conditions in a different area can affect indicator and variable size used on the field (Rachman and Mewa, [7]).
The measurement of food security in Bandung is needed as material to make a good government policy related to the development of food security in the year to come.
2. MATERIALS AND METHODS
The research was conducted in the city of Bandung as a case study with data collected from BPS data in 2012 and 2015 base year. [Bapeda, [8] [9]). The study has done at the Laboratory of Information Systems and Management Faculty of Agro Industrial Technology, University of Padjadjaran. The method used in this research is descriptive analytic method with the primary data used in this research is based on respond from decision maker in Bandung Agriculture and Food Security Board as one of stakeholders of Food Security Board of Bandung Government.
Primary data were collected for the system from direct interviews with government officials especially from : Bandung Agriculture and Food Security Board, BPS, Trade and Industry Agency, Bapeda, Communication and Information Agency and Transportation agency. While secondary data obtained from Food Balance, Score Dietary Pattern Hope (PPH Score), the Minimum Service Standards (SPM).
scoring and weighting of several variables form 3 dimension of food security such as Food Avalibility, Food Accessibility and Food Quality.
The basic of designing software for analizing condition of food security is how to count the total value of weight multiplying score of each criteria from each dimension of food security. Software using Microsoft Excel© as a tool for
analysis and counting the value.
There are several step to program the food security dimension score, weight and value, i.e.:
1.
Determine the dimensions, criteria and indicators.2.
Determine the criteria component assessment based on indicators of each dimension.3.
Determine the criteria weight.4.
Fill in the scores and weights of each indicator and criteria.5.
Calculate the performance value of food security dimensions.6.
Grouping performance value categories in the food security conditions group.7.
Combining the scoring categories of the 3 dimensions of food security.8.
Evaluate the condition of food securityperformance according to monitoring and evaluation year data.
To make score of the dimension criteria is done by determining the scale of the assessment for the variable criteria in each dimension. While the determination of the weight is done by using preference degree of importance of each criterion. Every score and weight is analized and separate by each worksheet for each dimension of food security.
The grading scale used for weighting and scoring given by score range between 10, to 50. Weight in this occasion is determined by preference degree of importance of each aspect of food security in the following way (Kastaman et.al. [10]):
1) The basis of determining the degree of importance
Priority is not primary = 1 Priority is somewhat less = 2 Priotitas quite important = 3
High Priority = 4
So that range of food security indicators as follows:
3. RESULTS AND DISCUSSION
3.1.Determine the dimensions, criteria and indicators.
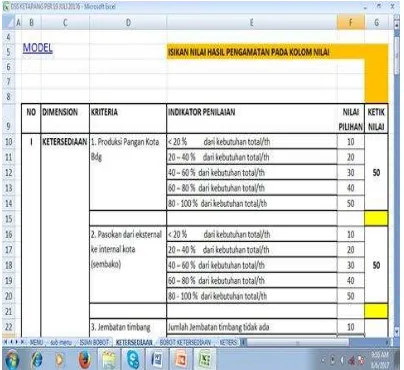
The dimensions of food security such as food availability, food access and food utility and quality is placed in every Excel worksheet. Meanwhile, in every work sheet, the component of criteria also attach to describe what condition cound be happened based on year account. Every component of criteria has indicator that taken into account as a score as what describe in Figure 1.
Figure 1. Screenshoot Example of Dimension, Criteria, Indicator and Score
for each Dimension of Food Security
Kastaman et.al. [10] descibe that the component of criteria for each food security dimension can be divided are as follow :
3.1.1. Aspect Of Food Availability [ ]
1.
Bandung Food Production2.
Supply from external to internal city of nine primary food stuff (sembako)3.
Weighbridge4.
Transportation Facilities for commodity transportation5.
Quarantine Center6.
City food stock (provincial government)7.
Food Stock City (City Government)8.
Food stock of granary subdistrict9.
Food stock of village granary10.
Food stocks at traders, groups11.
Main Market12.
Traditional Markets13.
Modern Markets / Hypermarkets14.
Food price subsidy15.
Number of city dwellers / km216.
Area of harvest17.
Productivity18.
Product Diversification19.
Irrigation system20.
Agricultural technology21.
Farming Credit22.
Means of production23.
Commission on the supervision of fertilizers and pesticides24.
Climate25.
Pests26.
Illness27.
Disaster3.1.2. Aspect Food Accessibility [ ]
1.
Average per capita income2.
Percentage of unemployment topopulation
3.
Food Price (HPP rice) is seen from the inflation rate4.
Existence of monitoring of commodity prices5.
Transportation Facilities and Infrastructure transportation, communication and transportation) supporting distributionfood
6.
Volume of motor vehicles is associated with the condition road7.
Intensity of socialization activities and building of resilience food per year per sub district (frequency)8.
Measures on the possibility of Disaster influence,9.
Conflict etc. within 1 year10.
Flood Intensity per year11.
Drought Intensity per year12.
Earthquake Intensity per year3.1.3. Aspect Utility / Food Quality [ ]
1.
Energy Sufficiency (Average)2.
Adequacy of Nutrition3.
Variation of food in one week / household4.
The incidence of malnutrition cases include poisoning / year cases in percentage form5.
Violation of food safety cases within 1 year6.
Health Facilities7.
Health Services8.
Adequacy of Clean Water9.
Sanitation10.
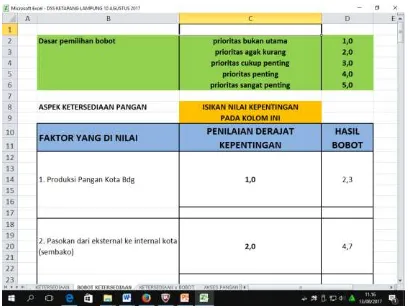
Life Expectations3.2. Weight Criteria
As what mentioned in the methods, the weight fill in every sheet in relation with dimension measured. The weight fill in separate sheet as describe in Figure 2.
Figure 2. Example Feature of Scoring and Weighting Every Dimension of Criteria
3.3.Performance Value Dimension
Performance value of each food security dimension is obtained by multiplying score with its weighting result. Here, the score and weight is given by respondent or user who related with food security concern in the goverment for example the Chief of Food and Agriculture Agency.
The data fill in the system depend on data availability and interpretation of user in relation with food security experience in their field. So that before data analysis, user obtain tutorial at glance to make the system effective to give comprehensive information on the final result.
Performance value of each food security dimensions views in below of the sheet with specific justification. For example if the final performance value is 3186 then the justification for that
condition is faily safe as what
mentioned in the methods for range of food security indicators 2600 to 3400 is
Fairly Safe . The example of this account is what desribe in Figure 3.
Figure 3. Example Result of Performance Value Dimension
3.4. Using the Software to Evaluate Food Condition of Bandung City in 2012 and 2015.
been taken into account for specific evaluation. For this purpose, the system analized data from year of 2012 and 2015 in Bandung then the result as what presented in Tabel 1.
Table 1. The Result Of Food Security Measure In Bandung City on
year of 2012 and 2015
Aspect 3.123,29 3.129,53
Fairly Safe Food
Accessibity 4.171,43 3.969,33 Safe
Food Utility 3.130,43 3.337,14 Fairly Safe Source : [10]
The results of measurement using this software describe that for 2012 and 2015, food security conditions in Bandung did not changes in their performance values. However, specifically in each dimension there are specific changes in the number of indicators present in each dimension. For example, in food availability dimension, there was performance increase in food productivity indicators, then food price subsidies and subsidies of agricultural technology factors. While on the food access dimension there was performance decrease in the indicator due to rise of inflation and increase of motor vehicles population.
In the dimension of food utilization and quality, the increase of performance occurred in indicator of malnutrition case decrease, the poisoning case decrease and food safety and infant mortality rate case decrease.
4. Conclussions
Based on results of the research, there are several things as a conclussions, such as follows:
1.
Software with Microsoft Excel analysisbase can be used to get a description of
food security performance in a specific city.
2.
The results of the analysis can showthe problem map based on the indicator of the dimensions of food security as measured and also the performance value obtained in general from each dimension of food security.
3.
By using the example of food securitycase in Bandung City with data of year 2012 and 2015, in fact that there were no difference of food security condi - tions in Bandung.
4.
The Differences occured only on someperformance indicators of the criteria component of each dimensions. For example: on the food availability indicators and the food utilization and quality indicator, there was an increased in 2015, while in the food access indicator decreased.
ACKNOWLEDGEMENT
The researchers would like to express gratitude to Bapeda Bandung that allows for cooperation and funding this research coolaboration in the framework of preparation on Designing of Bandung Food Security Master Plan for 2013 to 2018 planning.
mented by IFRC & ZRCS. Final Report. February 2013. Cooperation Between Zimbabwe Red Cross Society, International Federation of Red Cross and Red Crescent Society and AEMA Development Consultant [4] Kastaman, Roni. Asep D. Soetrisno,
Entang Sastraatmadja, 2012. Perancangan Model Rencana Induk Pembangunan Bidang Ketahanan Pangan (Studi Kasus Kota Bandung). Paper Jurnal Teknotan Vol.7 No.3. September 2013. ISSN : 1978-1067. Pp. 1056-1066.
[5] Bapeda Kota Bandung. 2012. Penyusunan Rencana Induk (Master Plan) Ketahanan Pangan Kota Bandung. Laporan Akhir Kajian Kerjasama Bagian Ekonomi Bapeda Kota Bandung dengan LPPM Universitas Padjadjaran.
[6] CFSUAC. 2003. Urban Agriculture and Community Food Security in the United States: Farming from the City Center to the Urban Fringe A Primer Prepared by the Community Food
Security Coalition’s North American
Urban Agriculture Committee. October 2003
[7] Rachman, Handewi P.S. and Mewa Ariani, 2002. Ketahanan Pangan: Konsep, Pengukuran dan Strategi FAE. Volume 20 No. 1, Juli 2002: 12 – 24. Acces on June 30, 2017 at : http://ejurnal.litbang.pertanian.go. id/index.php/fae/article/download /4280/3616
[8] BPS. 2012. Bandung dalam Angka. Seri Publikasi BPS kota Bandung [9] BPS. 2015. Bandung dalam Angka.
Seri Publikasi BPS kota Bandung. [10] Kastaman, Roni, Insy Alimatun
Hasanah, Totok Pujianto, Efri Mardawati. 2017. The City of Bandung Food Security Evaluation in 2012 and 2015 Using Food Security Evaluation Software. Paper Presented in UNILA - ISABE International Seminar 2017. Bandar Lampung. 10 – 12 August 2017.