ESS
–
E
XTENSION OF
S
OCIAL
S
ECURITY
Universal Social Protection Floors:
Costing Estimates and Affordability
in 57 Lower Income Countries
Isabel Ortiz
Fabio Durán-Valverde
Karuna Pal
Christina Behrendt
Andrés Acuña-Ulate
ESS ─ Working Paper
No. 58
Social Protection Department
Copyright © International Labour Organization 2017
First published 2017
Publications of the International Labour Office enjoy copyright under Protocol 2 of the Universal Copyright Convention. Nevertheless, short excerpts from them may be reproduced without authorization, on condition that the source is indicated. For rights of reproduction or translation, application should be made to ILO Publications (Rights and Licensing), International Labour Office, CH-1211 Geneva 22, Switzerland, or by email: [email protected]. The International Labour Office welcomes such applications.
Libraries, institutions and other users registered with a reproduction rights organization may make copies in accordance with the licences issued to them for this purpose. Visit www.ifrro.org to find the reproduction rights organization in your country.
ILO Cataloguing in Publication Data
Universal social protection floors: Costing estimates and affordability in 57 lower income countries/ Isabel Ortiz, Fabio Durán-Valverde, Karuna Pal, Christina Behrendt, Andrés Acuña-Ulate; International Labour Office. - Geneva: ILO, 2017 (Extension of Social Security Series No. 58)
ISSN 1020-9581 ; 1020-959X (web pdf)
social protection / social security systems / social protection floors / child allowances / orphan benefits / maternity benefits / disability benefits / social pensions / public expenditures / developing countries / universal policies / SDGs
The designations employed in ILO publications, which are in conformity with United Nations practice, and the presentation of material therein do not imply the expression of any opinion whatsoever on the part of the International Labour Office concerning the legal status of any country, area or territory or of its authorities, or concerning the delimitation of its frontiers.
The responsibility for opinions expressed in signed articles, studies and other contributions rests solely with their authors, and publication does not constitute an endorsement by the International Labour Office of the opinions expressed in them.
Reference to names of firms and commercial products and processes does not imply their endorsement by the International Labour Office, and any failure to mention a particular firm, commercial product or process is not a sign of disapproval.
Information on ILO publications and digital products can be found at: www.ilo.org/publns.
The editor of the series is the Director of the Social Protection Department, ILO. For more information on the series, or to submit a paper, please contact:
We are determined to strengthen the social dimension of globalization. We firmly believe that employment and social inclusion must be at the heart of our actions and policies to
restore growth…We recognize the importance of social protection floors in each of our
countries, adapted to national situations. G20 Leaders Declaration, 3-4 November 2011.
Adding to ILO social security standards, governments, workers and employers from 185 countries adopted the Social Protection Floors Recommendation, 2012 (No. 202) at the 101st Session of the International Labour Conference in Geneva (Switzerland) in 2012.
SDG 1.3 commits all countries to “implement nationally appropriate social protection
systems and measures for all, including floors” as part of Goal 1: End Poverty in All its Forms Everywhere, United Nations, 2015. SDG 10.4 commits all countries to “adopt
policies, especially fiscal, wage and social protection policies, and progressively achieve
greater equality” as part of Goal 10: Reduce Inequality Within and Among Countries
(United Nations, 2015).
Universal coverage and access to social protection are central to ending poverty and
boosting shared prosperity… Many countries have embarked in expanding social protection coverage… It is time for universal social protection.The Global Partnership for Universal
Social Protection, led by the ILO and the World Bank Group, with other major development
Contents
Page
Acknowledgements ... ix
Executive summary ... xi
1. Universal social protection floors to achieve the SDGs ... 1
Objective and scope of this paper ... 2
The big picture: Universal social protection floors in 101 middle- and low-income developing countries ... 3
The time is ripe: A historical comparison of the development of universal social protection systems, including floors ... 4
2. Universal child and orphan benefits ... 7
Rationale ... 7
Assumptions ... 10
Results in low-income and lower middle income countries ... 10
Current public social protection expenditure for children ... 12
3. Universal maternity benefits ... 14
Rationale ... 14
Assumptions ... 16
Results in low-income and lower middle-income countries ... 16
4. Universal disability benefits ... 18
Rationale ... 18
Assumptions ... 19
Results in low-income and lower middle-income countries ... 19
5. Universal old-age pensions ... 22
Rationale ... 22
Assumptions ... 24
Results in low-income and lower middle-income countries ... 24
Current public social protection expenditure for older persons ... 26
6. Social protection floors: Aggregate results for 57 lower income countries ... 28
7. Fiscal space analysis: Fiscal space for social protection floors exists even in the poorest countries ... 32
Tax and ODA ... 32
Debt ... 34
Reallocating expenditures ... 36
Curtailing illicit financial flows ... 38
Political priority to extend social protection floors ... 40
Annexes
I. A global review of administration costs ... 49
II. Scope and definition of the comparable set of benefits ... 54
III. Country results ... 57
IV. Methodology ... 59
Tables 1.1. Cost of the set of Universal Social Protection Floors cash benefits by world region/sub-region for 101 developing countries, in percentage of GDP ... 4
7.1. Resource availability (tax and ODA) and Social Protection Floors costs, ratio, by country .. 33
7.2. Debt service spending to Social Protection Floors costs (ratio), by country ... 35
7.3. Military spending as a share of Social Protection Floors costs, by country ... 37
7.4. Willingness to support social investments indicator: share of spending in public health and public education, as a percentage of total government spending ... 41
A.I.1. Comparative analysis of the administration costs of universal near cash social assistance schemes ... 50
A.I.2. Comparative analysis of the administration costs of targeted near cash social assistance schemes ... 51
A.III.1. Total cost of universal social protection floors cash benefits by region in per cent of GDP ... 57
A.IV.1. Determination of demographic ratios ... 61
A.IV.2. Determination of economic ratios ... 62
Figures Figure 1.1.Comparison of GDP per capita in developing countries circa 2010 (blue bars) and GDP per capita in developed countries at the time when their main social security systems were established (black bars) (in 1990 US dollars) ... 5
Figure 2.1.Cost of universal child benefits and orphan benefits, as a percentage of GDP, and children (as a proportion of the population), 2015 ... 11
Figure 2.2.Cost of a universal child (0─4) benefit and orphan benefit and past expenditure on social protection for children and families, 2015 (as a percentage of GDP) ... 12
Figure 3.1.Cost of universal maternity cash benefits during 4 months at 100 per cent of the poverty line (as a percentage of GDP), and beneficiaries (as proportion of population) 2015 ... 17
Figure 4.1.Cost of universal disability cash benefits for persons with severe disabilities at 100 per cent of the national poverty line (as a percentage of GDP) and beneficiaries (as proportion of the population), 2015 ... 20
Figure 5.1.Cost of universal old-age pension benefits at 100 per cent of the poverty line (as a percentage of GDP) and beneficiaries (as proportion of the population), 2015 ... 25
Figure 5.2.Cost of universal non-contributory old-age pension benefits as percentage of GDP for 2015, and reported public social protection expenditure for older persons (latest available year) ... 26
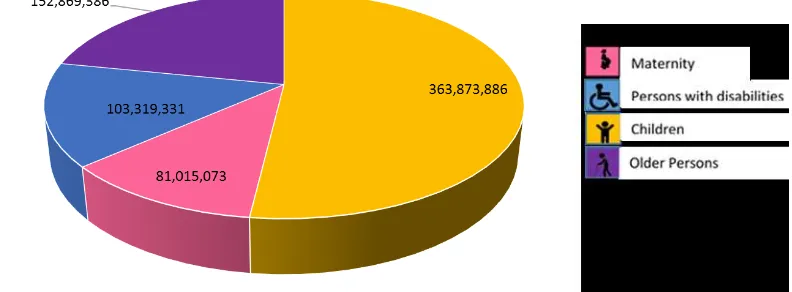
Figure 6.1.Direct beneficiaries of universal social protection floors cash benefits in 57 countries (number of persons), 2015... 29
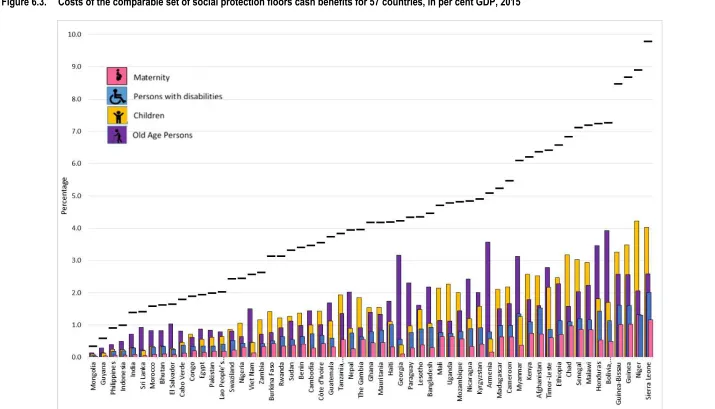
Figure 6.3.Costs of the comparable set of social protection floors cash benefits for 57 countries, in per
cent GDP, 2015 ... 31
Figure 7.1.Illicit inflows and outflows in comparison to average Social Protection Floors cost (per cent of GDP) ... 39
Figure A.II.1.National poverty lines compared to the World Bank international poverty threshold, in relation to GDP per capita (various years) ... 55
Boxes Box 2.1. Mongolia: Universal Child Money Programme ... 8
Box 2.2. Argentina: Reaching universal coverage through a combination of schemes ... 9
Box 3.1. Argentina, India and Bangladesh: Non-contributory maternity benefit schemes ... 15
Box 4.1. The right to a disability grant in South Africa ... 18
Box 4.2. Universal Pensions for Persons with Disabilities in Timor-Leste ... 19
Box 5.1. Universal pension schemes in developing countries ... 22
Box 5.2. Namibia: The universal Basic Social Grant for all older persons ... 23
Acknowledgements
This policy paper provides a new and more extended version of ILO’s best-seller Can
Low-Income Countries Afford Basic Social Protection? (Pal et al., 2005, Mizunoya et al.,
2006, and ILO, 2008) produced more than a decade ago. They were a first exploration into the costs of social protection floors, covering 12 countries, developed by a team led by Michael Cichon, at the time Director of ILO’s Social Security Department. That pioneering work was quoted by many UN reports.
This paper now covers 101 developing countries, with a focus on 57 lower income countries. Further, the paper comes with a companion Social Protection Floors Calculator, available online at http://www.social-protection.org/gimi/gess/SPFCalculReport.action (in English, French and Spanish), an easy to use tool to encourage national dialogue on social protection.
This work was produced by a team led by Isabel Ortiz, Director of the ILO Social Protection Department; and consisting of Karuna Pal, Head of the Programming, Partnerships and Knowledge-Sharing Unit; Christina Behrendt, Head of the Social Policy Unit at the Social Protection Department, both of whom also worked on the original 2005, 2006 and 2008 costing studies; Fabio Durán-Valverde, Head of the Public Finance, Actuarial and Statistics Unit, and especially Andrés Acuña-Ulate, Social Security Actuary, who is also the creator of the ILO Social Protection Floors Calculator.
Substantial inputs to the report were received from José Francisco Pacheco, Public Finance Specialist/consultant. The report also benefited from comments from Sandra Polaski, former Deputy Director-General, and Anne Drouin, Director of the ILO’s Global Programme on Employment Injury. Sven Nef set the online Social Protection Floors Calculator in its online version and Victoria Giroud-Castiella was indispensable for the publication of this series.
Special thanks to Deborah Greenfield, ILO Deputy Director-General for Policy, for her support.
Executive summary
This paper presents the results of costing universal social protection floors in 34 lower middle-income, and 23 low-income countries, consisting of: (i) allowances for all children and all orphans; (ii) maternity benefits for all women with newborns; (iii) benefits for all persons with severe disabilities, and (iv) universal old-age pensions. The levels of this comparable set of benefits are based on nationally-defined poverty lines, and .presented as a percentage of GDP. The paper additionally reviews potential areas of fiscal space for the necessary extension of social protection systems, and concludes that universal social protection floors are feasible in the majority of developing countries.
Key results
1. All developing countries: A sample of 101 developing countries shows that universal
social protection floors are generally affordable. When upper middle-income countries are included, the average costs vary regionally from 0.9 per cent of GDP in Eastern Asia and the Pacific, to over 2 per cent of GDP in the Middle East and Northern Africa, Eastern Europe and Central Asia, Latin America and the Caribbean, and Southern Asia; upto 2.9 per cent of GDP in Sub-Saharan Africa. It can be concluded that universal social protection floors are generally affordable given that costs stand at an average of 1.6 per cent of GDP for the sample of developing countries. This is due to the high GDP level of high middle-income countries.
2. Lower income countries: However, are universal social protection floors affordable
in low-income and lower middle-income countries, where GDP is lower and poverty levels are higher? The results for 57 lower income countries are presented below:
2.a. Universal cash transfers for children 0─5 years of age cost on average 1.4 per cent of GDP, with the benefit for each child set at 25 per cent of the poverty line. A universal benefit for all orphans 0─15 years, estimated at 100 per cent of the national poverty line, would add only 0.04 percentage points of GDP to the cost;
2.b. Universal maternity benefit for all women with newborns costs on average 0.4 per cent of GDP, with a cash benefit equivalent to 100 per cent of the national poverty line for a duration of 4 months;
2.c. A universal benefit for persons with severe disabilities costs on average 0.8 per cent of GDP with a benefit level of 100 per cent of the national poverty line;
2.d. Universal pensions for older persons over 65 years of age, set at a level of 100 per cent of the national poverty line, would require on average 1.6 per cent of GDP for the 57 lower income countries in the sample.
The cost of the full set of benefits for the 57 low-income and lower middle-income countries ranges from 0.3 per cent of GDP for Mongolia to 9.8 per cent of GDP for Sierra Leone – with an average cost of 4.2 per cent of GDP. The full implementation of the 227 benefit programmes described would cover a total of 702 million direct beneficiaries.
and illicit financial flows. National social dialogue is fundamental to generate political will to explore all possible fiscal space options in a country, and adopt the optimal policy mix.
The time is ripe. Today, Botswana, Indonesia and Peru are richer than the United Kingdom in 1911 or Australia in 1908, when these countries set-up their social security systems, including social assistance. India, Philippines, Morocco, Jamaica and Sudan, are wealthier than Denmark in 1892 when it established universal social protection. It is the right time to implement nationally appropriate social protection systems and measures for all, including floors, as agreed in SDG 1.3 of the 2030 Agenda for Sustainable Development.
JEL Classification: I3, H6, H53, H55.
Keywords: social protection, social security systems, social protection floors, child
1.
Universal social protection floors
to achieve the SDGs
The strong positive impacts of social protection have brought social protection to the forefront of the development agenda. Social protection is a key element of national development strategies to reduce poverty and inequality, promote human capital, political stability, and inclusive growth.
The Social Protection Floors Recommendation (No. 202), adopted in 2012, reflects a global
consensus on the extension of social security reached among governments, employers’, and workers’ organizations from 185 countries at all levels of development (ILO, 2012 and ILO, 2017b). In adopting Recommendation No. 202, countries committed to build nationally-defined social protection floors as the fundamental element of their social protection systems, aiming at universal protection, for all.
Furthermore, the roll-out of social protection floors has been endorsed by the G20,
More than thirty developing countries have taken-up the commitment and have already made the vision of a world with universal social protection schemes a reality, such as Argentina, the Plurinational State of Bolivia, Botswana, Brazil, Cabo Verde, Chile, China, Kazakhstan, Kiribati, Kosovo, Kyrgyzstan, Lesotho, Maldives, Mauritius, Mongolia, Namibia, Seychelles, South Africa, Swaziland, Thailand, Timor-Leste, Trinidad and Tobago, Uruguay, Uzbekistan, and Zanzibar (United Republic of Tanzania). Some of them have achieved universality through a mix of contributory social insurance and non-contributory benefits, and others have achieved universality by universal transfers, such as the Plurinational State of Bolivia, Botswana, Lesotho, Mongolia, Namibia, Swaziland or Zanzibar (United Republic of Tanzania), showing that there are several ways to achieve universality (Global Partnership for Universal Social Protection, 2016a–i; ILO 2017a).
The world is united in the advancement of universal social protection. Strengthening social protection systems, including floors, is supported through the joint efforts of the United Nations agencies at different levels, and through concerted joint efforts with relevant international, regional, subregional and national institutions and social partners, including the Global Partnership for Universal Social Protection.
While the need for social protection is widely recognized, the human right to social security
remains unfulfilled for the large majority of the world’s population. Only 29 per cent of the
global population enjoy access to comprehensive social protection systems, meaning that they have access to all areas of social protection, from child benefits to old-age pensions,
1 Social protection also contributes to attaining several other goals, including the goals on health
(particularly target 3.8), gender equality (particularly target 5.4), decent work and economic growth (particularly target 8.5) and equality (particularly target 10.4).
SDG Target 1.3 and Indicator 1.3.1
Target 1.3: Implement nationally appropriate social protection systems and measures for all, including floors, and by 2030 achieve substantial coverage of the poor and the vulnerable
whereas 71 per cent are covered partially or not at all (ILO, 2017a). Most of the population adequately covered by comprehensive social protection systems live in high-income countries.
In 2015, the percentage of the global population effectively covered by at least one social protection benefit (or SDG Indicator 1.3.1.) stands at only 45 per cent, which means that more than half of the global population are not effectively protected in any area of social protection. Social protection coverage for children is still insufficient: only one in three children (35 per cent) are covered, pointing to significant underinvestment in children and families, mostly in developing countries. Only 41 per cent of women with newborns receive maternity cash benefits that provide them with income security during the critical period. Large coverage gaps exist also for persons with severe disabilities: worldwide, only 28 per cent receive disability benefits. Effective pension coverage for older persons stands at 68 per cent of all persons above retirement age worldwide (ILO, 2017a). Despite significant progress in the extension of social protection coverage, many are left unprotected; thus renewed efforts are needed to realize the human right to social security and achieve the SDGs.
This paper explores the costs and affordability of non-contributory social protection floors in developing countries, showing that it is feasible even for countries with large vulnerable populations.
The lack of access to social protection constitutes a major obstacle to economic and social development. Inadequate or absent social protection coverage is associated with high and persistent levels of poverty and economic insecurity, growing levels of inequality, insufficient investments in human capital and human capabilities, and weak aggregate demand in a time of recession and slow growth. Further, lack of social protection is associated with political instability, higher crime rates and terrorism (ILO, 2014a).
Objective and scope of this paper
This paper aims to contribute to the extension of social protection floors by exploring their cost and affordability in developing countries. The paper has a companion online ILO Social Protection Floors Calculator to facilitate national dialogue on different social protection options; this and other tools can be found at http://www.social-protection.org/gimi/gess/ShowWiki.action?id=7
Social protection floors consist of at least effective access to essential health care and basic income security throughout the life cycle. For the purpose of this paper, we have considered the income security dimension, based on a comparable set of cash transfers, comprising of:
(i) allowances for all children and orphans;
(ii) maternity benefits for all women with newborns;
(iii) benefits for all persons with severe disabilities, and
(iv) universal old-age pensions.
It must be noted that countries often provide higher benefit levels to have larger impacts on reducing poverty and inequality. Recommendation No. 202 along with other international labour standards recommend that, in addition to providing a basic level of social security in the form of a social protection floor, countries should progressively ensure higher levels of social protection, with a view to achieving comprehensive and adequate social security systems.
The calculations rely on a database of key demographic, poverty, employment and other national statistics for the latest available year, 2015 for the majority of countries. The details for each benefit category are explained in each chapter in this paper. While the database contains data for 101 countries, the core of this paper is limited to 57 countries. The selection is based on the focus on LIC and LMIC and data constraints and availability.
In Chapter 1, we present the big picture, a rapid analysis of the costs of universal social protection floors in all 101 developing countries for which data is available, including high middle-income countries, as well as a historical comparison of the development of social protection systems, including floors.
However, the paper focusses on investigating if universal social protection floors are affordable in 57 lower middle-income and low-income countries. These countries have lower GDP, significantly larger numbers of poor population, and often underdeveloped social protection systems.
Chapter 2 explores the cost of universal benefits for children and orphans, Chapter 3 maternity benefits for all women with newborns, followed by Chapter 4 universal pensions for persons with severe disabilities and Chapter 5 universal old-age pensions. These different schemes are then combined in Chapter 6, to understand the full cost of universal social protection floors. The paper concludes by reviewing, in Chapter 7, the different options to expand fiscal space to make universal social protection floors a reality in all lower middle- and low-income countries.
The big picture: Universal social protection floors in
101 middle- and low-income developing countries
The first question considered in this paper is whether universal social protection floors are affordable in developing countries in all regions of the world, at all income levels. The following costs were estimated by applying the ILO Social Protection Floors Calculator 2
(SPF Calculator) to 36 upper middle-income, 34 lower middle-income, and 31 low-income countries:
(i) a universal cash transfer for all children within a five year age bracket at 25 per cent of the national poverty line;
(ii) allowances for all orphans at 100 per cent of the national poverty line;
(iii) four months of a universal maternity benefit for all women with newborns, at the national poverty line;
(iv) a universal benefit for all persons with severe disabilities at 100 per cent of the national poverty line, and
2 The ILO Social Protection Floor Calculator is available at:
(v) a universal pension to older persons aged 65 and above at 100 per cent of the national poverty line.
The average proportion of GDP needed to implement this set of life changing social protection benefits is shown in Table 1.1.
Table 1.1. Cost of the set of Universal Social Protection Floors cash benefits by world region/sub-region for 101 developing countries, in percentage of GDP
Region/sub-region Cost of Social Protection Floors cash transfers in per cent of GDP
Eastern Asia and the Pacific 0.9
Eastern Europe and Central Asia 2.7
Latin America and the Caribbean 2.4
Middle East and Northern Africa 2.1
Southern Asia 1.7
Sub-Saharan Africa 2.9
All developing countries (in the sample) 1.6
Source: Authors’ calculations using the ILO’s Social Protection Floors Calculator and based on the ILO’s World Social Protection Database, 2017.
The cost of the set of social protection floors cash benefits varies from 0.9 per cent of GDP in Eastern Asia and the Pacific, to between 1.7 and 2.4 per cent of GDP in the Middle East and Northern Africa, Latin America and the Caribbean, and Southern Asia. The costs are 2.7 and 2.9 per cent of GDP respectively for Eastern Europe and Central Asia and Sub-Saharan Africa. At an average of 1.6 of GDP for the sample of 101 developing countries, it may be concluded that universal social protection floors are generally affordable in developing countries.
This can be explained by the high levels of GDP of upper middle-income countries. Many upper middle-income countries have successfully established universal social protection schemes, providing evidence to the rest of the world that expanding coverage to all is not only necessary but also feasible. However, would it be feasible if we focus on lower income countries?
The time is ripe: A historical comparison of the development of
universal social protection systems, including floors
A historical comparison shows that today’s developing countries have a similar level of GDP
per capita to high-income countries when they established their social security systems.
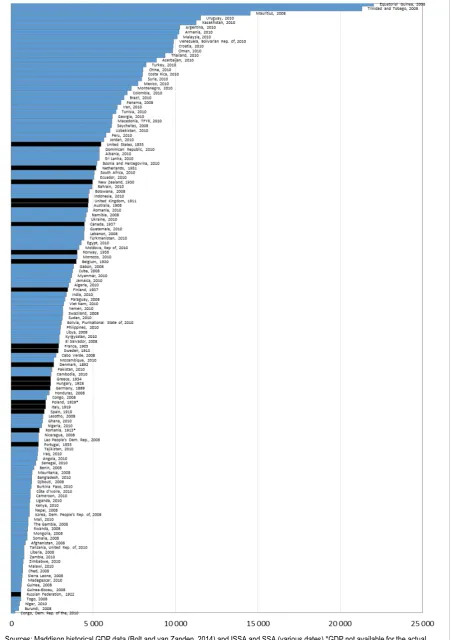
Using Maddison’s historical GDP data (Bolt and van Zanden, 2014), figure 1.1 presents the GDP per capita of developing countries in 2010 (in blue), compared to the GDP per capita of higher income countries when they established their social security systems (in black).
Figure 1.1. Comparison of GDP per capita in developing countries circa 2010 (blue bars) and GDP per capita in developed countries at the time when their main social security systems were established (black bars) (in 1990 US dollars)
Today, India, Jamaica, Morocco, the Philippines and Sudan, are richer in terms of GDP per capita than France in 1905, when the government established old-age and disability pensions, sickness benefits, child support and unemployment benefits; and also wealthier than Denmark in 1892 when it established universal old-age and disability pensions, work injury, sickness and maternity benefits.
Cambodia, Congo, Honduras and Mozambique are richer in terms of GDP per capita than Italy in 1919 when it extended social protection through old-age, disability and survivors’ pensions, maternity benefits, unemployment insurance, and family/child grants. Similarly, Benin, Cameroon, Liberia and Sierra Leone have higher GDP per capita levels than the Russian Federation in 1922, when it created its social security system with universal old-age,
survivors’ and disability pensions, work injury benefits, sickness benefits and maternity
benefits, as well as unemployment support.
Also Ghana, Honduras, the Lao People’s Democratic Republic, Nigeria and Pakistan are
wealthier in terms of per capita GDP than Portugal in 1935, when it established old-age and
survivors’ pensions, work injury benefits, sickness benefits and maternity benefits. Similarly, Egypt, Guatemala and Lebanon have higher GDP per capita levels than Norway in 1936, when it established universal old-age, disability and survivors’ pensions, work injury benefits, sickness benefits and maternity benefits, and unemployment support. Peru, Iran and Jordan have higher GDP per capita levels than the United States in 1935, when it enacted its Social Security Act.
2.
Universal child and orphan benefits
Rationale
This chapter starts exploring whether universal social protection floors are affordable in 57 lower middle-income and low-income countries. These countries have lower a level of GDP, a significantly larger poor population as well as a larger number of children, and often have underdeveloped social protection systems. Specifically, the chapter examines the cost of non-contributory child and orphan benefits in lower income countries, considering that these benefits should be an essential element of national social protection systems, including floors contributing to the achievement of SDG 1.3.
Child poverty, in its multiple facets, is one of the key challenges that needs to be addressed in order to create equitable societies and promote sustainable development. Child-centred commitments are reflected in various goals and targets in the 2030 Sustainable Development Agenda, particularly with respect to ending poverty (SDG 1), improving nutrition and ending hunger (SDG 2), improving health and well-being (SDG 3), ensuring access to education (SDG 4) and reducing inequalities (SDG 10).
UNICEF (2016) estimates that, unless the multiple inequities that negatively affect the life of children are eliminated, poverty will continue to affect 167 million children who will still live in extreme poverty in 2030 despite overall progress in reducing poverty; 69 million children under the age of 5 years will have died between 2016 and 2030; and 60 million children of primary school age will still be out of school by 2030. Recent
research has shown that deprivations suffered in the first 1,000 days of children’s lives
(including during pregnancy), particularly with regard to nutrition, have a strong and often irreversible effect on children’s later lives (UNICEF, 2013). Children in poor households experience higher mortality rates, more frequent health-related problems and higher illiteracy rates trapping them in the vicious cycle of poverty. Economic vulnerability of these poor households leads to children being required to bring in an income for the survival of the household and thus puts these children at the risk of being forced into the worst forms of child labour (ILO, 2013). Child-sensitive social protection measures are considered as a crucial policy strategy to address this challenge (UNICEF et al., 2009; Attanasio et al., 2005; Baird et al. 2013, ILO 2014a). Child and family benefits, in cash and
in kind, play a particularly important role in realizing children’s rights and addressing their
needs.
Effective coverage figures for SDG indicator 1.3.1 show that 35 per cent of children globally receive social protection benefits, with significant regional disparities: while 87 per cent of children in Europe and Central Asia and 66 per cent in the Americas receive benefits, this is the case for only 28 per cent of children in Asia and 16 per cent in Africa. A positive trend is the expansion of cash transfers for children (ILO, 2017a). Specific child and family benefit programmes rooted in legislation exist in 117 countries. 3
Countries which have made great strides towards universal social protection coverage include Argentina, Brazil, Chile and Mongolia – the latter a lower middle-income country. Important programmes include the Child Money Programme in Mongolia (see box 2.1), the Bolsa Familia programme in Brazil and the Oportunidades/Prospera programme in Mexico, the Asignación Universal por Hijo (AUH) programme in Argentina (see box 2.2) and the child support grant in South Africa. The Oportunidades/Prospera programme has improved primary and secondary school enrolment rates for children and the nutritional
3 For details on the types of child benefit schemes that exist around the world refer to the ILO’s
status of 70 per cent of households as well as improved the health status of children under 5 years of age (Barrientos and Holmes, 2006). A recent study (Kidd, 2012) concludes that in OECD countries, those that have had the greatest success in reducing child poverty are the ones which are committed to providing child benefits on a universal basis (categorical targeting).
Box 2.1. Mongolia: Universal Child Money Programme
In 2005, the government introduced the Child Money Programme (CMP) with the aim of alleviating poverty in the wake of the economic and social transition. This programme was initially implemented as a conditional cash transfer targeting the poor. The conditions included social and health behaviour as well as schooling requirements (ie. children had to be living with their parents, be up-to-date on mandatory vaccinations, be enrolled in school or non-formal education if above the age of 8, and not be engaged in harmful forms of child labour). Implementation of the targeted benefit encountered problems of leakage to the non-poor and exclusion of the poor in targeting (Hodges et al., 2007). A little over a year into the programme, in July 2006 the government converted the programme into a universal scheme providing a benefit to all children under the age of 18 and at the same time introduced a new benefit for newborn children and increased the amount of the benefit. The programme maintained two conditionalities for receipt of benefits, namely the child had to be living with his or her family and a school-age child had to be attending school or non-formal education. A study by Hodges et al. (2007) found that the initial targeted CMP reduced the child poverty headcount by almost 4 percentage points (from 42.2 per cent to 38.5 per cent) and lowered the child poverty gap by about 2 percentage points, assuming that the child benefits received had raised actual household expenditure by an equivalent amount. The introduction of the universal child benefit and especially the increased amount of the benefit introduced in 2006, reduced the poverty headcount by 10 percentage points (to 27.4 per cent) and cut the poverty gap by 5.5 percentage points (to 7.1 per cent).
However in 2010 following a reform of the social welfare system the CMP was discontinued. In October 2012, the country’s new parliament reintroduced the CMP following the adoption of the Government Action Plan (2012-2016) which highlighted the government’s social welfare commitments. The benefit was universal and provided for all children until the age of 18. The amount of the benefit since October 2012 was set at 20,000 MNT (approximately US$ 12) per month. This universal child benefit was financed from a tax on mineral resource.
The 2014 Household Socio-Economic Survey found that the CMP contributed to a reduction of the poverty incidence by 12 per cent and the poverty gap by 21 per cent. It thus significantly reduced monetary poverty and even more so if only children were considered (ILO, 2016c).
In August 2016, the newly elected Government announced the reintroduction of targeting with respect to the CMP. As a consequence, only 60 per cent of children received the CMP in November 2016. The subsequently approved IMF three-year loan arrangement under the Extended Fund Facility imposes conditions with regard to fiscal consolidation which include “steps to strengthen and better target the
social safety net” (IMF, 2017). However, in July 2017, witnessing an improvement in the fiscal indicators,
the Government re-established the universality feature of the CMP and integrated the programme in the Law on Social Welfare. In such a volatile context, the ratification of the Social Security (Minimum
Standards) Convention, 1952 (No. 102) would provide the safeguard for sustaining Mongolia’s social
protection system, including the universal Child Money Programme.
Box 2.2. Argentina: Reaching universal coverage through a combination of schemes
The Argentinian social security system provides a set of family allowances, benefits for children and young people through social insurance (contributory), social assistance (non contributory) and fiscal deduction programmes. Children below the age of 15 years represent a quarter of the total population of the country. In 2009, as a response to the global economic and financial crisis and to consolidate the existing programmes, the government launched the semi-conditional Universal Child Allowance (AUH) as a long-term social policy measure designed to close the gaps in the system, in order to cover those not covered by the social insurance system, including informal and domestic workers with income below the legal monthly minimum wage; unemployed persons without coverage; seasonal workers; and certain categories of self-employed workers. The main aim is to ensure that benefits are paid for each child younger than age 18 (no limit if disabled), up to five children provided that beneficiaries fulfil certain health (such as vaccination for children under the age of 5 years, etc.) and educational (school attendance) requirements (ISSA and SSA, 2014).
The three components of the family benefit programme reached 84.6 per cent of the children and adolescents under the age of 18 in Argentina in 2014. The contributory programme as well as the fiscal deduction scheme benefited 53.3 per cent of the population of children and adolescents under the age of 18 and the Universal Child Allowance scheme provided benefits to 46.8 per cent of that same population. Allocation for children and adolescent benefits in 2014 (contributory and non-contributory components) was 1.04 per cent of GDP approximately of which the allocation to the non-contributory component was 0.50 percentage points, the contributory component was 0.46 percentage points and to family allowances for people receiving an old-age pension was 0.08 percentage points (Global Partnership for Universal Social Protection, 2016c).
An assessment of the impact on indigence and poverty of the family transfers for children by Bertranou and Maurizio (2012b) concluded that indigence would be reduced by approximately 65 per cent and overall poverty by 18 per cent. They estimated that the AUH covers 70 per cent of the children and adolescents who are poor and that with the contributory and the non-contributory benefits approximately 80 per cent of children are pulled out of poverty.
Within this family allowance scheme, two non-contributory social assistance components provide benefits that cover pregnant women and young infants: a universal pregnancy allowance for social
protection and the mothers’ pension. These two programmes ensure that the coverage of the family
allowance scheme reaches the most vulnerable. Since 2011, the universal pregnancy allowance aims at reducing maternal and infant mortality and is paid for each pregnancy to informal and domestic workers with income below the legal monthly minimum wage; unemployed persons; and certain categories of self-employed workers. Enrolment in the prenatal and early childhood health
program Plan NACER and meeting the programme’s medical requirements is a condition to receive the benefit. The mothers’ pension is paid to mothers of seven or more children (natural or adopted) with income and assets below the subsistence level, who do not receive any social security benefits or support from family members (ISSA and SSA, 2014).
Government expenditure on child benefits in 2013 (contributory and non-contributory; excluding expenditure on family benefits by provincial governments and the fiscal deduction) was approximately 0.99 per cent of GDP (Bertranou et al., 2015). With this coordinated set of family and child benefits, Argentina pursues social and economic outcomes by providing for universal coverage as part of its nationally-defined social protection floors.
Sources: Bertranou and Maurizio, 2012a and 2012b; Bertranou et al. 2015; Global Partnership for Universal Social Protection, 2016c; Global Partnership for Universal Social Protection, 2016d; ILO 2017a; ISSA and SSA, 2014.
The ILO’s Social Protection Floors Recommendation, 2012 (No. 202) explicitly recognizes
Assumptions
The modelled child benefit covers all children 0─14 years of age, and classifies them into 3 age brackets of five years each. The level of the child benefit is fixed at 25 per cent of the national poverty line, which in LICs and LMICs is usually calculated on a per capita basis, without consideration of economies of scale for larger households. 4 This is a modest level,
yet it is important to take into account that such child benefits may be combined with other benefits. In the special case of double orphans (of both parents with probability based on parental life expectancy), a higher level of benefits at 100 per cent of the national poverty line is assumed to meet the needs of this particularly vulnerable group. The results presented below show the costs for each specific five year age bracket and for all orphans.
In order to ascertain the level of a child benefit in a specific country context, further assessments would be necessary, possibly in the context of technical advice by the ILO, considering in particular whether children enjoy universal access to at least essential health care and access to education, as well as the poverty reduction impact of existing child benefit schemes and other relevant programmes. Benefit levels may need to be adjusted in order to have significant impacts on child poverty. 5
Results in low-income and lower middle-income countries
The estimation of the cost of transfers for all children, particularly orphans, at the estimated level of benefits, is available for 57 low- and lower middle-income countries. The cost estimates and the proportion of the population aged 0─14 are divided into three available groups: under 5, 5─9 and 10─14 years old.
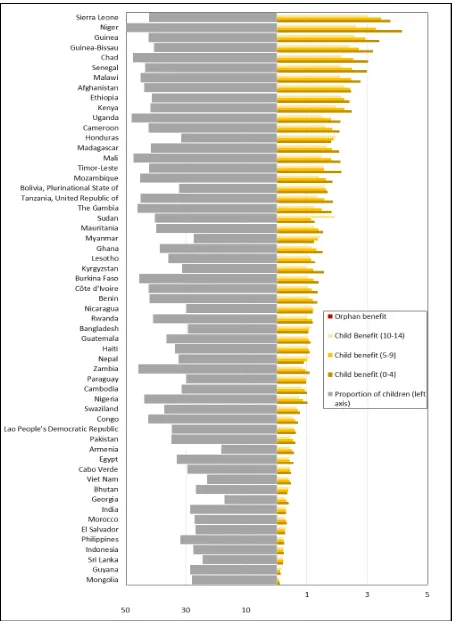
The projected costs for a basic universal child benefit for the age group 0─4 varies significantly between countries ranging from 0.1 per cent of GDP for Mongolia to 4.1 per cent of GDP for Niger (figure 2.1) with an average for all the 57 countries analysed of 1.4 per cent of GDP. The benefit costs less than 1.0 per cent of GDP for a total of 18 countries of which ten show a cost below 0.5 per cent of GDP.
The projected costs for a basic universal child benefit for the age groups 5─9 and 10─14 range from less than 0.1 per cent of GDP for Mongolia to 3.5 and 3.0 per cent of GDP respectively for Sierra Leone (figure 2.1) with an average for all the 57 countries analysed of respectively 1.3 and 1.2 per cent of GDP.
The proportion of children in the total population varies from 17.3 per cent in Georgia to 50.5 per cent in Niger (secondary axis on left-hand side in figure 2.1) with an average of 36.6 per cent for the sample.
4 Other countries use equivalence scales which attach a lower weight to children as compared to adult
household members, in order to reflect differences in consumption levels (e.g. OECD, 2011).
5 To calculate a different set of benefits or different coverage, see the ILO Social Protection Floors
Figure 2.1. Cost of universal child benefits and orphan benefits, as a percentage of GDP, and children (as a proportion of the population), 2015
Note: For children, the benefit was set at 25 per cent of the national poverty line, except for orphans, for orphans the benefit is at 100 per cent of the national poverty line.
The cost of the benefits depends on the proportion of children in the population, the level of the poverty line (which is the basis for setting the benefit level) and GDP. While the proportion of children in the population explains a good share of the higher costs for some countries (for the 11 countries with the highest costs the proportion of children represents at least 40 per cent the population, while for the 15 countries with the lowest cost this proportion is less than 35 per cent). However, the relative value of the poverty line is the main explanation for the higher costs for the sample. The correlation between costs and the relative value of the poverty line is 95.7 per cent whereas the correlation between costs and the proportion of children is just 70.5 per cent.
Current public social protection expenditure for children
The comparison of the above cost estimates and the past expenditure, 6 highlights that not all
the above estimated costs are additional costs. Thus, the resource gap to implement the benefit, at least for a group of countries, may be less than what has been calculated above. Some countries in the sample are spending currently more than the level of expenditure required for a benefit as described in this paper. This is a promising signal that in some cases the allocation of required resources is possible.
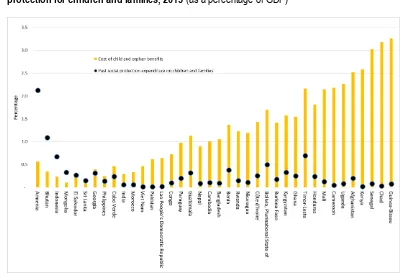
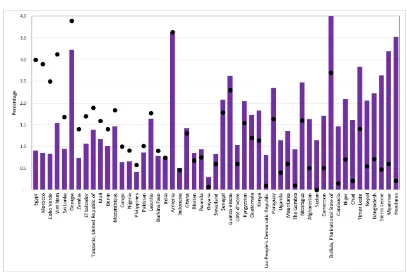
Of the 57 countries, 19 do not have information on children and family benefit expenditure or reported expenditure of 0.00 per cent of GDP. For the 38 countries for which information on children and family benefit expenditure was available, four countries have current expenditure levels that exceed the cost estimations (see figure 2.2). This may be due to the fact that for the past reported expenditure level the child population group is larger (i.e. benefits are provided to children also between ages of 5 to 18) and/or the benefit level is higher than the one used for the calculation of the set of comparable social protection floors cash benefits.
Figure 2.2. Cost of a universal child (0─4) benefit and orphan benefit and past expenditure on social protection for children and families, 2015 (as a percentage of GDP)
Note: Both series of costs include administrative expenditure.
Source: Authors’ calculations using ILO’s Social Protection Floors Calculator and based on the ILO’s World Social Protection Database.
6 The present report uses information on expenditure levels regarding public social protection
3.
Universal maternity benefits
Rationale
Maternity protection is a key component of the transformative policies called for in the 2030 Agenda and is essential to the achievement of multiple Sustainable Development Goals, particularly with respect to ending poverty (Goal 1), improving nutrition and ending hunger (Goal 2), reducing maternal and infant mortality (Goal 3), ensuring access to education (Goal 4), achieving gender equality and empowering women (Goal 5), promoting inclusive growth and decent work (Goal 8) and reducing inequalities (Goal 10).
In 2014, about 800 women died every day from preventable causes related to pregnancy and childbirth and 99 per cent of all maternal deaths occurred in developing countries. The World Health Report (WHO, 2005, p. 81) highlighted that “…three quarters of all neonatal deaths could be prevented if women were adequately nourished and received appropriate care
during pregnancy, childbirth and the postnatal period…”. Most of these deaths, as well as
infant deaths, could be avoided with adequate social protection and health care. Even in developed countries there is evidence to show the strong positive effect of paid maternity leave. According to Human Rights Watch (2011, p. 37) a study of 18 OECD countries covering more than three decades found that extending the number of weeks of job-protected
paid leave was associated with a significant decrease in infant mortality, but unpaid leave was not.
Maternity protection ensures income security for pregnant women and mothers with newborns. Worldwide, effective social protection coverage estimates for SDG indicator 1.3.1 show that only 41.1 per cent of women with newborns receive a maternity benefit, and only 15.8 per cent of childbearing women in Africa (ILO, 2017a). Such lack of income security during the final stages of pregnancy and after childbirth forces many women, especially those in the informal economy, to keep working into the very late stages of pregnancy and/or to return to work prematurely, thereby exposing themselves and their children to significant health risks (ILO, 2016a; ILO 2017a).
Universal effective maternity coverage has been achieved in Ukraine and Uruguay, and other developing countries such as Argentina, Colombia, Mongolia and South Africa have made significant progress. However, significant coverage and adequacy gaps remain in other parts of the world. An increasing number of countries are using non-contributory maternity cash benefits as a means to improve income security, nutrition and access to maternal and child health care for pregnant women and new mothers, particularly for women living in poverty and those in the informal economy 7 (ILO, 2016a; see box 3.1).
7 For details on the types of maternity schemes that exist around the world refer to the ILO’s flagship
Box 3.1. Argentina, India and Bangladesh: Non-contributory maternity benefit schemes
While in the majority of countries maternity benefits are provided through schemes that are linked to employment, a number of countries have introduced non-contributory benefits for women not covered by any scheme. Most of the non-contributory programmes introduced link benefits to the fulfilment of certain conditions related to health visits or information sessions regarding maternal health or infant health and nutrition.
In Argentina, the universal Family Allowance scheme (see box 2.2 above), provides non-contributory maternity benefits. The universal pregnancy allowance is paid for each pregnancy to informal and domestic workers with income below the legal monthly minimum wage; unemployed persons; and certain categories of self-employed workers. It covers women from the 12th week of pregnancy to the birth or end of pregnancy through a monthly cash transfer of Argentinian pesos 966 (approximately US$ 65). The universal pregnancy allowance programme covered 22 per cent of births in 2011, on average more than 66,000 women per month between May 2011 and June 2012 (ILO, 2014a). Between June 2014 and June 2016 on average more than 78,200 women received a benefit (ANSES, 2016). A non-contributory pension is also provided to mothers with seven or more children (natural or adopted) with income and assets below the subsistence level, who do not receive any social security benefits or support from family members ISSA and SSA, 2014).
In India, the Indira Gandhi Matritva Sahyog Yojana (IGMSY) programme, introduced in 2010, provides cash benefits for pregnant women and lactating mothers in 53 pilot districts, covering approximately 19.9 million women and supporting the financial inclusion of approximately 600,000 women annually (Government of India, 2016). A daily benefit for all women aged 19 and over (limited to first two pregnancies; and excluding those who are covered through benefits provided to public sector employees) for approximately 40 days aims at providing partial compensation for wage loss to encourage women to take adequate rest before and after childbirth. In addition, all eligible women receive a cash incentive through a conditional cash transfer in two instalments (a total of Rupees 6,000 approximately US$ 91.50*as of 2013) during pregnancy and the period of lactation, conditional upon compliance with various conditions pertaining to registration, medical check-ups, vaccinations and breastfeeding practice. With the aim of making the programme universal, the Government of India announced in December 2016 the extension of the conditional cash transfer Maternity Benefit Programme to cover all of the country. The programme will provide Rs. 6,000, in three instalments, for pre and post-delivery care to pregnant and lactating women. The Government of India has estimated that for the period 2017 till 2019-20, approximately 5.17 million beneficiaries will be covered annually by the programme at an estimated total cost of 12,700 crore Rs. (i.e. 1.9 billion US$) (Chakrabarti et al. 2017).
In Bangladesh, the Maternity Allowance Programme for Poor Lactating Mothers (MAP) was introduced in 2008. It targets women in rural areas aged 20 and over, living on a monthly income of less than 1,500 taka (approximately US$ 19); it also covers mothers with a disability and women who are the breadwinners of poor families. If eligible, they receive one-time support during either the first or second pregnancy to the amount of 350 taka per month (approximately US$ 4.5) for a period of two years. (ILO, 2014a) The MAP programme covered 116,000 women in 2013-14 at a cost of 0.0041 per cent of GDP and was estimated to cover 220,000 women in 2014-15 at a cost of 0.01 per cent of GDP. Furthermore, the allowances for urban low-income lactating mothers covered 86,000 women in 2013-14 and was estimated to cover 100,000 women in 2014-15 respectively at a cost of 0.0035 and 0.0045 per cent of GDP (Ministry of Finance Bangladesh, 2014).
Note: * At exchange rate of 1 US$ = 65.57 Rupees.
Sources: ANSES, 2016; Chakrabarti et al. 2017; Government of India, 2016; ILO, 2014a, 2016a; Ministry of Finance Bangladesh, 2014.
According to the Social Protection Floors Recommendation, 2012 (No. 202), para. 5(c),
countries should consider, as part of their nationally defined social protection floors, “basic
income security, at least at a nationally defined minimum level, for persons in active age
who are unable to earn sufficient income… in particular in cases of … maternity”, as well
well as achieving gender equality and decent work, and achieving the respective SDGs (ILO, 2016a).
Assumptions
For the cost estimate of a maternity benefit, the number of beneficiaries was calculated based on the observed country-specific fertility rates. It is assumed that a maternity cash benefit of 100 per cent of the national poverty line would be provided to all mothers during four months around childbirth, in order to cover as a matter of priority the period when mothers and newborns are most vulnerable. Such cash benefits should help to reduce financial pressures on mothers, encourage them to take adequate rest after childbirth, and facilitate access to health care services, including with regard to out-of-pocket costs and transport costs. 8
Results in low-income and lower middle-income countries
Cost estimates for a maternity cash benefit, are available for 57 low- and lower middle-income countries. The cost estimates and the proportion of expected beneficiaries (corresponding to the number of mothers with newborns) are provided in figure 3.1.
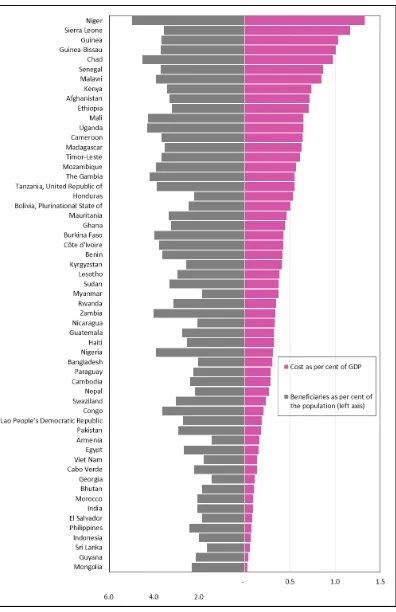
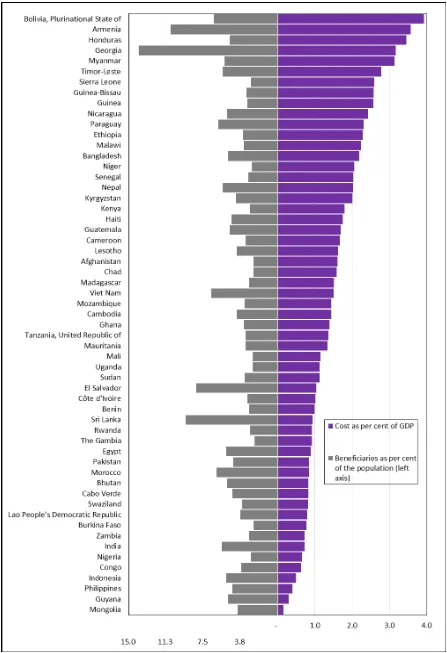
For the year 2015, the average cost for providing maternity cash benefits is 0.43 per cent of GDP. For 53 of the 57 countries the cost estimate is at or below 1 per cent of GDP. It is less than 0.5 per cent of GDP for 29 countries and with a level of 0.1 per cent of GDP for eight countries.
The proportion of beneficiaries (mothers with newborns) in the population ranges from between 1.5 per cent in Georgia and Armenia to 5 per cent in Niger with an average across the countries of 3 per cent of the population. The proportion of newborn children (see figure 3.1) is also directly related to the fertility rates.
The cost of the benefit depends on the proportion of newborn children in the population, the level of the poverty line (which is the basis for setting the benefit level) and GDP. However, the relative value of the poverty line to GDP per capita is the main explanation for the estimated cost levels. The correlation between costs and the relative value of the poverty line is 92.3 per cent whereas the correlation between costs and the proportion of newborns is just 74 per cent.
8 To calculate a different set of benefits or different coverage, see the ILO Social Protection Floors
Figure 3.1. Cost of universal maternity cash benefits during 4 months at 100 per cent of the poverty line (as a percentage of GDP), and beneficiaries (as proportion of population) 2015
4.
Universal disability benefits
Rationale
According to global estimates, persons with disabilities constitute approximately 15 per cent
of the world’s population many of them live in developing countries. Approximately
785 million persons with disabilities are of working age, 15 years or over (ILO, 2014a). Effective social protection measures to protect persons with disabilities and promote independent living and access to decent work are a precondition for achieving the SDGs and human rights.
New ILO effective coverage estimates for SDG 1.3.1 show that 27.8 per cent of persons with severe disabilities worldwide receive a disability benefit, with large regional variation: while coverage in Eastern Europe appears to be almost universal, regional estimates for Asia and the Pacific show an effective coverage rate of only 9.4 per cent (ILO, 2017a). The large majority of countries offer some form of social protection for persons with disabilities. In the majority of countries it is provided through social insurance schemes which cover mainly workers in the formal economy and provide earnings-related benefits. Unless these are complemented by non-contributory schemes, they do not provide universal coverage (ILO, 2014a). 9
Universal social protection for persons with disabilities has been achieved in Brazil, Chile, Mongolia and Uruguay; other developing countries have nearly-achieved universality, such as Kyrgyzstan, Nepal and South Africa (box. 4.1); many other countries are extending social protection to persons with disabilities (box 4.2).
Box 4.1. The right to a disability grant in South Africa
Anchored in the Constitution of the Republic of South Africa, article 27(1)(c), is the right to social security including through social assistance for those who are unable to support themselves and their dependents. The Social Assistance Act No. 13 of 2004, lays down the obligation of the government to provide a set of targeted social assistance benefits to the elderly, children and the disabled and the Social Assistance Regulations of 2008 set out the qualifying conditions for a benefit. For the disabled between 18 and 59 years of age unable to provide maintenance for themselves a disability grant is provided. The disability grant is provided on a means-tested basis and depending on the outcome of the medical review it is either granted as a temporary or a permanent grant. Furthermore, if the disabled person needs constant care by others then a constant-attendance allowance is also paid. For children under the age of 18, Care Dependency Grants are awarded to their care-givers. The disability benefit is up to 1,430 Rand (approximately US$ 114.70) per month and the constant-attendance allowance 330 Rand (approximately US$ 26.50) per month. The South African Social Security Agency (SASSA) which is responsible for the provision of social assistance benefits and services to South Africans paid out 1,085,514 disability grants in the financial year 2015/16 and expenditure was 19,165 million Rand (SASSA, 2016) representing approximately 0.44 per cent of GDP in 2016.
Studies show that the South African social grants have had a positive effect on poverty reduction and inequality. Samson et al. (2004) showed that a full take-up of the disability grant would reduce the poverty gap by 5.1 per cent. Similarly, receipt of a Disability Grant was associated with greater share of household spending on food and led to lower prevalence rates of hunger compared to households with comparable income levels. The study also showed positive effects of the grants on labour force participation and employment with higher employment rates in households receiving the disability grant than in households not receiving the grant.
Sources: SASSA, 2016; Global Partnership for Universal Social Protection 2016e; ILO 2017a.
9 For details on the types of disability benefit schemes that exist around the world refer to the ILO’s
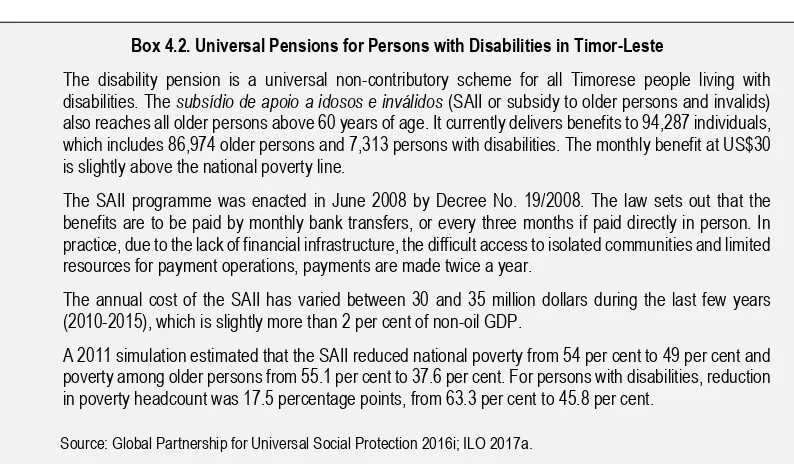
Box 4.2. Universal Pensions for Persons with Disabilities in Timor-Leste
The disability pension is a universal non-contributory scheme for all Timorese people living with disabilities. The subsídio de apoio a idosos e inválidos (SAII or subsidy to older persons and invalids) also reaches all older persons above 60 years of age. It currently delivers benefits to 94,287 individuals, which includes86,974 older persons and 7,313 persons with disabilities. The monthly benefit at US$30 is slightly above the national poverty line.
The SAII programme was enacted in June 2008 by Decree No. 19/2008. The law sets out that the benefits are to be paid by monthly bank transfers, or every three months if paid directly in person. In practice, due to the lack of financial infrastructure, the difficult access to isolated communities and limited resources for payment operations, payments are made twice a year.
The annual cost of the SAII has varied between 30 and 35 million dollars during the last few years (2010-2015), which is slightly more than 2 per cent of non-oil GDP.
A 2011 simulation estimated that the SAII reduced national poverty from 54 per cent to 49 per cent and poverty among older persons from 55.1 per cent to 37.6 per cent. For persons with disabilities, reduction in poverty headcount was 17.5 percentage points, from 63.3 per cent to 45.8 per cent.
Source: Global Partnership for Universal Social Protection 2016i; ILO 2017a.
Recommendation No. 202 in para. 5(c), sets out that nationally defined social protection floors should guarantee at least basic income security to persons with disabilities as well as access to health care for all, taking into account their specific needs.
Assumptions
For the costing of the disability benefits, the number of beneficiaries is based on country-specific disability estimates from the World Health Organization’s Estimated Years Living with Disability database. The estimations are only for cases of severe disabilities, for which it is assumed that participation in employment may be challenging and may require additional support. The benefit level is set at 100 per cent of the national poverty line. 10
Results in low-income and lower middle-income countries
Cost estimates for disability benefits, is available for 56 low- and lower middle-income countries. The cost estimates and the proportion of expected beneficiaries are provided in figure 4.1.
10 To calculate a different set of benefits or different coverage, see the ILO Social Protection Floors
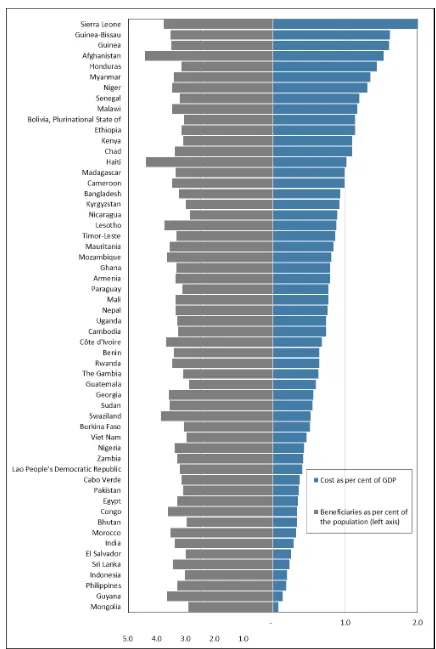
Figure 4.1. Cost of universal disability cash benefits for persons with severe disabilities at 100 per cent of the national poverty line (as a percentage of GDP) and beneficiaries (as proportion of the population), 2015
The left axis shows the estimated proportion of persons with severe disabilities which on average represents 3.4 per cent of the population. The three countries of the sample that show the lowest incidence of disability with 2.9 per cent are Guatemala, Nicaragua and Mongolia while Afghanistan and Haiti show the highest incidence with 4.4 per cent.
The right axis shows the costs of disability benefits. The average cost is 0.8 per cent of GDP, while the range varies from 0.1 per cent for Mongolia to 2.0 per cent for Sierra Leone.
5.
Universal old-age pensions
Rationale
Pensions for old persons are the most widespread form of social protection in the world, and a key element in SDG 1.3. At a global level, 68 per cent of people above retirement age receive a pension, either contributory or non-contributory (ILO, 2017a). However, the right to social protection of older persons is not yet a reality for many. In most low-income countries, less than 20 per cent of older persons over statutory retirement age receive a pension. In many developing countries, an important proportion of older persons still depend heavily on family support arrangements.
Social protection plays a particularly important role in realizing the human right to social security for older persons, in ensuring income security and access to essential services including health and care in a way that promotes their rights and dignity. Reliable sources of income security play a particularly important role for older persons (ILO, 2014a). Universal basic pensions have a strong impact on improving the livelihoods of older persons and could alleviate at least the most severe forms of poverty (UNFPA and HelpAge International, 2012; HelpAge International, 2014; Hagemejer, 2009). Social pensions, not only provide older persons with a much needed regular income, but they also provide crucial financial support to other household members, particularly children. Pension recipients redistribute cash income in households, finance school fees for children and other household expenditures (HelpAge International, 2014). In Brazil and South Africa, pension recipients reduced the probability of households living in poverty (Barrientos, 2003). In South Africa, the Older Person’s Grant is one of the most important tools for poverty reduction in the country; this is evidenced by the reduction in poverty incidence among older persons from 55.6 per cent in 2006 to 36.2 per cent in 2011, and demonstrated positive impacts on health and nutrition of children (Global Partnership for Universal Social Protection, 2016f). The strong impacts of universal old-age pension coverage on the prevention of poverty highlight their relevance for the achievement of the SDGs, particularly target 1.3 (box 5.1 and box 5.2).
Box 5.1. Universal pension schemes in developing countries
Today, nearly 30 developing countries have achieved or nearly achieved universal pension coverage, including Argentina, the Plurinational State of Bolivia, Botswana, Brazil, Cabo Verde, Chile, China, Kazakhstan, Kiribati, Kosovo, Kyrgyzstan, Lesotho, Maldives, Mauritius, Mongolia, Namibia, Seychelles, South Africa, Swaziland, Thailand, Timor-Leste, Trinidad and Tobago, Uruguay, Uzbekistan, and Zanzibar (United Republic of Tanzania).
There are many paths towards universal pension coverage. Most developing countries combine contributory schemes with non-contributory social pensions to older persons. Other countries provide a universal social pension to all (e.g. Botswana, Timor-Leste). Some countries choose gradual and progressive realization (e.g. Brazil, South Africa) and others opt for fast-tracking immediate universal coverage (e.g. the Plurinational State of Bolivia, China, Kiribati). Countries choose different ways of designing and implementing universal pension schemes; hence governments have a wide set of options to achieve universal social protection coverage.