i
MEASUREMENT FOR GRADE 3 IN INDONESIAN PRIMARY
SCHOOL
A THESIS
Submitted in Partial Fulfillment of the Requirements for the Degree of Master of Science (M.Sc)
in
International Master Program on Mathematics Education (IMPoME) Graduate School Sriwijaya University
(In Collaboration between Sriwijaya University and Utrecht University)
By: Kurnia Rahmi Y. NIM 20092812005
GRADUATE SCHOOL
SRIWIJAYA UNIVERSITY
ii
Research Title : Design Research on Developing Unit in Area Measurement for Grade 3 in Indonesian Primary School
Student Name : Kurnia Rahmi Y.
Student Number : 20092812005
Study Program : Mathematics Education
Approved by:
Prof. Dr. Zulkardi, M.I.Komp., M.Sc. Dr. Yusuf Hartono
Supervisor I Supervisor II
Head of Director of Graduate School
Mathematics Education Department, Sriwijaya University,
Prof. Dr. Zulkardi, M.I.Komp., M.Sc. Prof. Dr. dr. H.M.T. Kamaluddin, M.Sc., SpFK. NIP 19610420 198603 1 002 NIP 19520930 198201 1 001
iii
MEASUREMENT FOR GRADE 3 IN INDONESIAN PRIMARY
SCHOOL
A THESIS
Submitted in Partial Fulfilment of the Requirements for the Degree of Master of Science (M.Sc)
in
International Master Program on Mathematics Education (IMPoME) Graduate School Sriwijaya University
(In Collaboration between Sriwijaya University and Utrecht University)
iv I hereby:
Name : Kurnia Rahmi Y.
Place of birth : Bukittinggi Date of birth : August, 1985
Academic Major : Mathematics Education
State that:
1. All the data, information, analysis, and the statement in analysis and conclusion that presented in this thesis, except from reference sources in the result of my observation, research, analysis, and view with the guidance of my advisors.
2. The thesis that I had made is original of my mind and has never been presented and proposed to get any other degree from Sriwijaya University or other Universities. This statement was truly made and if in other time that found any fouls in my statement above, I am ready to get any academic sanctions such as, cancelation of my degree that I have got through this thesis.
Palembang, May 2011 The one with the statement
v
In area measurement students have difficulties in learning area measurement. Students mostly focus on applying formula to find the area of certain shapes without knowing what the area is and why the formula works. It is important to construct the unit for area and the measurement procedures since to quantify the area a unit must be used. Therefore, the aim of this research is to develop classroom activities that support students to learn area measurement. The sequences of activities are developed to gain better understanding of the students in learning area measurement. Design research is chosen as the method of the research. A teacher and students in grade 3 in elementary school (SDN 21) in Palembang Indonesia were involved in this research. The results showed that students learn to measure the area start from identifying the attribute being measured while comparing the quantity of area. Afterwards, the need of unit emerged when they have to quantify the quantity of area. The measurement process with the units gained when the students have experiences with covering activity by using units. Covering activity leads students to mentally partition the region into units and allows students to focus on the process of repeatedly using non standard unit as a tool to measure. Through these activities the students can use the unit to measure the area of two dimensional shapes either regular shape or irregular shapes.
vi
Pada materi pengukuran luas, siswa mengalami kesulitan dalam memahami pengukuran luas. Kebanyakan siswa hanya fokus pada penerapan rumus untuk menentukan luas berbagai bangun datar tanpa mengetahui pengertian luas dan mengapa rumus tersebut dapat berfungsi. Sangat penting untuk mengkonstruksi satuan untuk luas dan proses pengukuran karena satuan digunakan untuk mengukur luas. Oleh karena itu, tujuan dari penelitian ini adalah untuk mengembangkan kegiatan kelas yang mendukung siswa untuk belajar pengukuran daerah. Rangkaian aktivitas dikembangkan untuk mencapai pemahaman siswa yang lebih baik dalam belajar pengukuran luas.
Design research dipilih sebagai metode penelitian. Guru dan siswa kelas 3 SDN 21 palembang Indonesia terlibat dalam penelitian ini. Hasil penelitian menunjukkan bahwa siswa belajar untuk mengukur luas mulai dari mengidentifikasi sifat-sifat bangun yang akan diukur ketika membandingkan luas. Kemudian siswa menyadari bahwa satuan dibutuhkan ketika harus menghitung besarnya suatu daerah. Proses pengukuran dengan menggunakan satuan secara bertahap diperoleh ketika siswa memiliki pengalaman menutupi daerah dengan menggunakan satuan. Akhirnya siswa dapat menggunakan sebagai sarana untuk mengukur luas bidang datar baik bentuk yang beraturan maupun bentuk yang tidak beraturan.
vii
This research focuses on supporting the third grade students in learning area measurement. Area measurement is based on partitioning a region into equally sized units which completely cover it without gaps or overlaps. It is often that teaching tends to focus on numerical results and ignored the idea of the unit. Many findings show that understanding area measurement is difficult. Research in the field of mathematical education often reveals poor understanding of the processes used for area measurement of plan figure (Zacharos, 2006). Battista (Keijzer, 2008) mentioned that there is no obvious instrument for measuring area. It means that it is important to construct the unit for area and the measurement procedures. According to Gravemeijer, et al (2007) students are expected to master an extensive system of units of area, but they appear to have serious difficulty with applying this knowledge. It is preferable to make students familiar with a number of units and applications that are relevant to daily life, and to place the emphasis on developing concept, rules and procedures. Considering the difficulties of the students about area measurement, we develop classroom activities that support students to learn area measurement. So in this research a series of learning activities are designed to bring students in developing a unit as a means of measuring area. Realistic Mathematics Education underlies this research. This approach has been implemented in Indonesia since over the last 10 years that is called Pendidikan Matematika Realistik Indonesia (PMRI). A teacher and students in grade 3 in elementary school (SDN 21) in Palembang Indonesia that has been joined in PMRI project since 2010 were involved in this research.
Design research is used as a method of the research and it follows the phases of the design research that are: preliminary design, teaching experiment, and retrospective analysis. Video recording and students’ written works were used to investigate the learning process of the students. Interviews with the students were conducted to get deeper information of their thinking process.
This research was carried out in two cycles namely pilot experiment and teaching experiment. In the pilot experiment the sequences of activities were tried out to small group in order to try out our HLT to see how this design works. We found that some activities did not support to answer our research question. Hence, some activities and some materials such as the question for student worksheets were modified. Pre assessment was conducted to see the pre knowledge of the students and to see our starting point. The results of pre assessment showed that almost students still have no idea about area and they have vague notion about area. It means that it still a lot to be learned.
The teaching experiment was conducted in six activities. The first activity concerns with students’ awareness of physically quantity of area. This activity showed that some students were aware to the physical quantity of area. Students compared figures given by putting the one to the top of the other and then looking at which piece sticks out. Some of them also perceive the idea of conservation of area by rearranging the shape to determine which one is bigger.
The awareness of the attribute of area was made for the second activity but they worked with measurement units. It is expected that they can compare the objects by using identical units. Only few students recognized the existence of the unit in the figure. They realized that the unit is not identical and it is difficult to compare by using unidentical units.
viii
baking tray that can be put more cookies. Therefore, they did not pay attention to the size of baking tray. Some students were not aware of gaps and overlap in covering. In this level, these students only focus on counting the unit and did not get what is the area. However, Experience in covering with non standard units helps students to develop the concept of unit iteration and structuring arrays with row and column structuring.
In the fourth activity, students had to find the area of a baking tray with different kinds of unit by covering the baking tray. They cut and rearrange the shape in order to cover the region. In this way they can accept the concept of conservation of area. This is obvious from the fact that the process of measuring improve in this activity. They also consider about the accuracy of counting and find the inverse relationship of the unit.
In the fifth activity, Students were asked to find the area by using given unit. They were expected to be able to find the area either by partition a region and then count the unit or by using multiplication. In here, students can partition the region by fitting the square with the existing square in each row or column. Even some of them did not think to make arrays but directly multiply the number of unit in the side of rectangular shape.
In the last activity, the students were asked to compare the area of irregular shapes. Comparing the area of irregular shapes encouraged them to use unit in helping them with the units gained when the students have experiences with covering activity by using units. Covering activity leads students to mentally partition the region into units and allows students to focus on the process of repeatedly using non standard unit as a tool to measure. Through these activities the students can use the unit to measure the area of two dimensional shapes either regular shape or irregular shapes.
ix
Penelitian ini difokuskan untuk mendukung siswa kelas 3 SD dalam belajar pengukuran luas. Pengukuran luas pada dasarnya mempartisi suatu daerah menjadi satuan-satuan yang berukuran sama tanpa celah ataupun saling tumpang tindih. Namun seringkali pengajaran cenderung fokus pada hasil perhitungan dan mengabaikan konsep dari satuan. Banyak penelitian yang menunjukkan sulitnya memahami konsep luas. Penelitian di bidang pendidikan matematika seringkali menunjukkan kurangnya pemahaman mengenai proses pengukuran luas (Zacharos, 2006). Battista (Keijzer, 2008) menyebutkan bahwa tidak adanya alat pengukuran yang jelas untuk luas. Oleh karena itu satuan untuk mengukur luas dan prosedur pengukuran penting untuk dikembangkan. Menurut Gravemeijer (2007) siswa diharapkan untuk mengusai pengembangan untuk satuan luas namun mereka kesulitan untuk menerapkan pengetahuan ini. Siswa sebaiknya diperkenalkan dengan satuan yang dekat dengan kehidupan mereka sehari-hari serta konsep, aturan dan prosedur dalam pengukuran. Mengingat kesulitan siswa belajar tentang pengukuran area, kami mengembangkan kegiatan kelas yang mendukung siswa untuk belajar pengukuran daerah. Maka dalam penelitian ini serangkaian kegiatan belajar yang dirancang untuk membawa siswa dalam mengembangkan unit sebagai sarana untuk mengukur daerah. Realistic Mathematics Education atau yang lebih dikenal Pendidikan Matematika Realistik Indonesia (PMRI) melandasi penelitian ini. Pendekatan ini telah diterapkan di Indonesia sejak 10 tahun terakhir. Guru dan siswa kelas 3 di SDN 21 Palembang Indonesia dilibatkan pada penelitian ini. Sekolah ini telah bergabung dengan proyek PMRI sejak tahun 2001.
Design research dipilih sebagai rancangan penelitian. Rancangan penelitian ini terdiri dari tiga fase yaitu: tahap persiapan, eksperiment kelas dan tahap analisis. Rekaman video dan hasil kerja siswa digunakan untuk menyelidiki proses belajat siswa. Wawancara dengan para siswa dilakukan untuk mendapatkan informasi yang lebih mendalam tentang proses berpikir mereka.
Penelitian ini dilakukan dengan dua siklus, yaitu pilot experiment dan teaching experiment. Pada pilot experiment serangkaian kegiatan di dalam HLT (Hypothetical Learning Trajectory) diujicobakan pada kelompok kecil untuk melihat sejauh mana rancangan tersebut berhasil. Ternyata beberapa aktivitas tidak mendukung untuk menjawab pertanyaan penelitian. Oleh karena itu beberapa aktivitas dan beberapa materi seperti pertanyaan pada lembar kerja siswa diubah untuk meningkatkan kualitas HLT. Penilaian awal dilakukan untuk melihat pengetahuan awal siswa dan melihat dimana langkah awal untuk mengajarkan luas. Hasil dari penilaian ini menunjukkan bahwa sebagian besar siswa masih kebingungan dalam memahami arti luas. Ini berarti masih banyak yang perlu mereka pelajari.
Pembelajaran pada teaching experiment dilakukan dalam enam aktivitas. Aktivitas pertama terkait pada pandangan siswa mengenai kuantitas fisik luas. Siswa ditugaskan untuk membandingkan dan mengurutkan bidang datar berdasarkan ukurannya. Aktivitas ini menunjukkan beberapa siswa menyadari kuantitas fisik luas. Mereka membandingkan gambar bidang datar dengan meletakkan gambar yang satu di atas gambar yang lainnya kemudian bagain yang masih bersisa. Beberapa diantara mereka juga menyadari konsep dari konservasi luas dengan menggunting dan mengatur ulang gambar tersebut.
x
Pada aktivitas ketiga siswa diharapkan dapat menggunakan satuan untuk membandingkan. Pada aktivitas ini siswa dapat menggunakan satuan mereka sendiri. Namun pada kegiatan ini beberapa siswa memilih satuan yang menyerupai daerah yang akan mereka tutupi. Dengan cara ini, mereka hanya focus pada proses perulangan dengan menggunakan satuan dan tidak menggunakan satuan untuk membandingkan. Hal ini mungkin disebabkan karena pertanyaan yang diberikan berupa loyang kue manakah yang dapat memuat lebih banyak kue. Oleh karena itu mereka tidak memperhatikan ukuran loyang kue. Beberapa siswa juga tidak memperhatikan adanya celah dan tumpang tindih ketika menutupi objek. Pada level ini, siswa hanya fokus pada penghitungan satuan dan masih belum paham mengenai luas. Namun, pengalaman menutupi objek dengan satuan yang tidak baku membantu siswa dalam mengembangkan konsep iterasi satuan dan penyusunan bersusun baris dan kolom.
Pada aktivitas keempat siswa ditugaskan untuk menentukan luas benda dengan menggunakan satuan yang berbeda. Mereka menggunting dan menyusun kembali satuan agar satuan tersebut dapat muat di dalam objek yang diukur. Dengan cara ini mereka dapat menerima konsep konservasi luas. Hal ini jelas bahwa kemampuan proses pengukuran siswa meningkat pada kegiatan ini. Mereka juga memperhatikan keakuratan penghitungan dan menemukan hubungan kebalikan dari ukuran satuan.
Pada aktivitas kelima, siswa diminta untuk menemukan luas dengan menggunakan satuan yang telah diberikan. Mereka diharapakan dapat menemukan luas baik dengan mempartisi daerah kemudian menghitung banyaknya satuan yang ada pada daerah tersebut ataupun dengan menggunakan perkalian. Dalam hal ini, siswa dapat mempartisi daerah dengan meyesuaikan persegi-persegi satuan dengan persegi-persegi satuan yang telah ada pada setiap baris atau kolom. Bahkan beberapa siswa tidak membuat gambar susunan persegi tetapi langsung mengalikan banyaknya satuan yang ada pada sisi bangun persegi panjang.
Pada kegiatan terakhir, para siswa diminta untuk membandingkan luas daerah bentuk yang tidak beraturan. Kegitan ini mendorong mereka untuk menggunakan satun dalam membantu mereka menemukan luas masing-masing bentuk. Dalam hal ini. Mereka dapat mengatasi satuan yang tidak utuh pada bentuk yang tidak beraturan. Siswa menggabungkan secara mental satuan yang tidak utuh untuk membentuk satuah yang utuh dan kemudian menghitung banyaknya satuan yang digunakan. Dapat dikatakan siswa menggunakan persegi sebagai satuan dalam memperkirakan luas bentuk yang tidak beraturan.
xi
It was very great experience working with young children to learn mathematics. This thesis is realization of how to have fun with students in learning area measurement. It would not have been possible without assists and supports from many people surrounding me. I would like to express gratitude to them all.
I am very grateful to the teacher, Ibu Mulyati, who has given her time and effort for
this research, students in SDN 21 Palembang who was involved in this research, principal and teachers in SDN 21 Palembang. This research could not be carried out without your help.
I am so proud supervised by Prof. Zulkardi, Dr. Yusuf Hartono and Frans van Galen
who always assist me to improve and sharpen my ideas. Thank you for fruitful discussions in guiding to finish my research.
To all lecturers and staffs in Freudenthal Institute Utrecht University Prof. Jan van
Maanen, Dr. Jaap den Hertog, Dr. Dolly van Eerde, Prof. Koeno Gravemeijer, Martin Kindt, Prof. Jo Nellisen, Dr. Mieke Abels, and the other lecturers thank you for sharing knowledge during my study in the Netherlands.
I also would like to thank lecturers and staffs in Sriwijaya University, Dr. Ratu Ilma,
Dr. Darmawijoyo, Dr. Somakim who gives encouragement and assistance throughout my study in Palembang.
I thank Prof. Dr. dr. H.M.T. Kamaluddin, M.Sc., SpFK. as director of graduate school
Sriwijaya University.
I also want to thank Directorate General of Higher Education (DIKTI) and Nuffic Neso
xii IMPoME program.
I wish to thank Prof. Dr. Ahmad Fauzan, Dr. Muliyardi, M.Pd., Lutfian Almash M.Si,
Hendra Syarifuddin M.Si and all of my lecturers in Padang State University (UNP) who supports me to join this program.
My special thanks to my dear fellow students for being my family. You all give beautiful moment in my life. The second batch of IMPoMe’s students, thank you for
helping during the research and also during the conference.
I dedicate this research to my family especially my parents who gave me strength when I am weak and gave me spirit when I am desperate, who always pray for all the best for me.
Palembang, May 2011
xiii
CHAPTER II THEORETICAL FRAMEWORK ... 3
A.Area Measurement ... 3
B. Realistic Mathematics Education ... 7
C.Emergent Perspective ... 8
D.Area Measurement in Indonesia Curriculum for Elementary School .. 9
CHAPTER III METHODOLOGY ... 11
A.Research Methodology ... 11
B. Research Subject and Timeline of the Research ... 12
C.Data Collection ... 13
1. Video Recording ... 14
2. Written Data ... 14
D.Data analysis, reliability, and validity ... 14
1. Data Analysis ... 14
2. Reliability ... 15
3. Validity ... 15
CHAPTER IV HYPOTHETICAL LEARNING TRAJECTORY ... 16
A.Identifying the Attributes ... 16
B. Comparing Area ... 21
C.Square Unit Measurement ... 23
D.Find the Number of Unit ... 24
CHAPTER V RETROSPECTIVE ANALYSIS ... 29
A.Pre Assessment ... 29
B. Pilot Experiment ... 33
1. Activity 1: Telling the Size of Cake ... 33
2. Activity 2: Choosing the Chocolate ... 36
3. Activity 3: Cookies in Baking Tray ... 39
4. Activity 4: Unit Investigation ... 40
5. Activity 5: Tiles in the Living Room... 42
6. Activity 6: The Area of Swimming pool ... 46
7. End Assessment of Pilot Experiment ... 47
xiv
1. Activity 1: Telling the Size of Cake ... 53
2. Activity 2: Choosing the Chocolate ... 57
3. Activity 3: Cookies in Baking Tray ... 61
4. Activity 4: Unit Investigation ... 64
5. Activity 5: Tiles in the Living Room ... 68
6. Activity 6: The Area of Swimming pool ... 72
7. End Assessment of Pilot Experiment ... 76
8. General Conclusion of pilot Experiment ... 82
D.Discussion ... 84
1. Realistic Mathematics Education ... 84
2. Classroom Discussion ... 85
3. The Role of Teacher ... 86
CHAPTER VI CONCLUSION ... 88
A.Answering Research Question... 88
B. Recommendation ... 90
REFERENCES... 91
xv
Figure 1: The cakes with different sizes ... 17
Figure 2: The chocolates with different sizes ... 20
Figure 3: The sketch of the living room ... 25
Figure 4: The sketch of swimming pool ... 27
Figure 5: Exercises of irregular shapes... 27
Figure 6: Student’s work in counting the units... 31
Figure 7: Using ruler in measuring ... 31
Figure 8: Counting the partial units ... 32
Figure 9: Putting the slice of cakes on the top of another ... 35
Figure 10: The Chocolates ... 37
Figure 11: Counting the slab of chocolate B ... 38
Figure 12: Making units by hand ... 39
Figure 13: Mistakes in labeling the squares ... 43
Figure 14: Making dots in counting ... 44
Figure 15: Nadhira’s answer ... 45
Figure 16: Indri’s answer ... 45
Figure 17: Lisa’s answer ... 46
Figure 18: Counting some pairs of partial units ... 47
Figure 19: Different strategies of students in counting the units ... 48
Figure 20: Different strategies of students in partitioning ... 49
Figure 21: Students’ strategies in finding the area of irregular shape ... 50
Figure 22: Students’ strategies in finding the area of irregular shapes ... 51
Figure 23: Revision of the figure of cakes ... 54
Figure 24: Using ruler to measure ... 55
Figure 25: Cutting the figure of cake C ... 56
Figure 26: Making a line on slab of chocolate B ... 59
Figure 27: Cutting the figure of the chocolate ... 60
Figure 28: Drawing the chocolates to compare ... 60
Figure 29: The cardboard as baking trays ... 62
Figure 30: Covering the cardboard ... 64
xvi
Figure 33: Tagging the blank space while counting ... 70
Figure 34: Labeling the figure to find the area of each island ... 74
Figure 35: Students made units for each figure ... 77
Figure 36: Using multiplication to determine the area ... 79
Figure 37: Labeling the irregular shape to find the area ... 80
Figure 38: Combining the partial units ... 81
xvii
Appendix A: Pre Assessment ... 93
Appendix B: End Assessment ... 95
Appendix C: Students Worksheets ... 97
Appendix D: Table Analysis of Students’ Answer of End Assessment ... 105
Appendix E: Visualization ... 108
xviii
LIST OF TABLE
CHAPTER I
INTRODUCTION
Measurement is one of subjects in mathematics which is often experienced in daily life. People deals with measuring situations every days such as measure how much ingredient put when cooking, how far the school from the student’s house or how large a
garden. Interpreting the number is important to communicate the result of measuring to the other. It means that competence in measuring is needed to teach in primary school. According to Reys et al (2007) measurement should be included in school mathematics because of its power to help students to see the usefulness of mathematics in everyday life. Measurement also can be used to help students learn other topics in mathematics.
One of issues in teaching measurement is that measurement is directly taught at the formal level of young children as an isolated concept (Wijaya, 2008; Castle & Needham, 2007; Kamii & Clark, 1997 and van de Walle & Folk, 2005). In Indonesia, teaching and learning in measurement mostly focuses on the using of formula without take care of development at how the formula is constructed. Fauzan (2002) states that one of fundamental problem in Indonesia is that most of the learning objectives only focus on memorizing facts and concepts, and computational aspects (i.e. applying formula). We can see how difficult it is for the students to differentiate the formula such as area and volume because they learn a „ready-to-use’ system, even though this system is actually the result of
a long process of developing suitable tools such as useful units of measurement, a measurement system and suitable formulas (Gravemeijer, et al, 2007).
measurement is difficult. Research in the field of mathematical education often reveals poor understanding of the processes used for area measurement of plan figure (Zacharos, 2006). Battista (Keijzer, 2008) mentioned that there is no obvious instrument for measuring area. It means it is important to construct the unit for area and the measurement procedures. According to Gravemeijer, et al (2007) students are expected to master an extensive system of units of area, but they appear to have serious difficulty with applying this knowledge. It is preferable to make students familiar with a number of units and applications that are relevant to daily life, and to place the emphasis on developing concept, rules and procedures.
Area measurement is based on partitioning a region into equally sized units which completely cover it without gaps or overlaps. Although the idea of unit is fundamental, the experiences with the unit through covering the space are often overlooked and it tends to focus on numerical result (Cavanagh, 2007). As a result students do not have opportunities to make sense the concept of area.
The aim of this research is to develop classroom activities that support students to learn area measurement. So in this research a series of learning activities are designed to bring students in developing a unit as a means of measuring area. Hence, research question in this research is How can students learn to measure area? This research is specified into two sub research questions as following:
1. How can comparing and covering activities bring students to develop the notion of a measurement unit for area?
CHAPTER II
THEORETICAL FRAMEWORK
A. Area Measurement
Area is an amount of two-dimensional surface that is contained within a boundary (Clements and Sarama, 2009). According to Simon and Blume (1994) in Zacharoz (2006), the study of area involves two steps: considering the area as a quantity and evaluating that quantity. To measure the quantity of area a unit must be chosen so that the number of those units that is takes is the size of an object (Cross et al, 2009). Physical quantity can be seen while the experiences offer the students to compare area of objects (Heuvel-Panhuizen, 2005). In this way, intuitive awareness of measuring emerges in many students. For area measurement, comparing can emerge the relative statement such as „bigger than’ or „larger than’. It can give a range of
possibilities but is not accurate enough for describing the objects because relative statement cannot tell how big or how large the object is. However, exact statements can be made by using a unit of measurement used. In here, the students start to develop the need of unit to measure when they have to evaluate the quantity.
Zacharoz (2006) suggested that area be measured using two-dimensional units such as plane figures (e.g. squares and rectangles) and a square unit is usually selected for overlapping rectangles and other figures with right angles.
Gravemeijer et al (2007) stated that when learning area, it is important for students to construct the units and the measurement procedures by themselves. The measurement process that can be used to plan instruction is as following (Reys et al, 2007):
1. Identify the attribute by comparing objects
2. Choose a unit
After children compare the region they must answer how the accuracy of their answer. In doing so, they need a unit to compare whether by using non standard unit or standard unit. When choosing the unit, there are some concepts develop over time (Reys et al, 2007). The size of the unit chosen depends on the size of the object and on the accuracy needed. There is an inverse relation between the size of a measuring unit and the number of units needed to measure some characteristic (Cross et al, 2009). In other words, the smaller the unit the more accurate and the more units are required. The students also need to know the measurement may be easily if the same unit is used. Besides choosing the unit of measurement, students have to iterate units to cover areas without gaps and overlaps, and to count the units (Kordaki, 2002)
3. Comparing the object to unit
Measuring with units is comparing an object with a unit and find how many units would be equal to that object. To compare the object to unit, identical unit is needed to communicate the result to the other in which every unit used is the same (Michaels et al, 2008). For example, someone says a region is 25 square units mean that every square is exactly the same.
4. Find the number of units
process of measuring, so the purpose should be to give them a feel for standard unit. The second is by using an instrument. Before measuring the area, an instrument is used to measure a certain some dimension. The third is by using formula. The skill of using formula should be developed but it should not take the place of careful development in measuring process. Teaching the topic area in traditional mathematics causes students to think that area of rectangular shapes is always the product of two lengths by applying the formulas (Fauzan, 2002). However, in reality we mostly deal with irregular shapes. It means that the idea of approximation to find the area of irregular shapes needs to be introduced to the students. So that students think that that the area is not only belong to rectangular shape.
5. Report the number units
A measurement must include both the number and the unit chosen. This step requires students to report the result of measurement, both the number and the units used.
build the idea of a two dimensional space is also important in learning area measurement.
B. Realistic Mathematics Education
The designing of local instructional theory in this research is inspired by Realistic Mathematics Education. Realistic Mathematics Education has been developed in the Netherlands since 1970s (de Lange, 1996). This approach has been implemented in Indonesia since over the last 10 years that is called Pendidikan Matematika Realistik Indonesia (PMRI). Many schools have been involved in developing PMRI including the school that we will work with.
According to Freudenthal, mathematics must be connected to reality through problem situations. The term “reality” means that the problem situation must be
experientially real for students. In realistic mathematics education (RME), students should be given opportunity to reinvent mathematics based on their own strategies.
The local instructional theory in this research in line with five tenets of realistic mathematics education that have been defined by Treffers (1987, in Bakker, 2004) as following:
a. Phenomenological exploration or the use of contexts
In this study, students are involved to explore mathematics from a real situation that has meaning to develop basic concepts of mathematics. In learning area measurement, comparing the size of objects around can be the starting point in learning process.
The second tenet of RME gives a bridge from a concrete level to more formal level. Models, symbols, schemas, and diagrams can support the development of students’ thinking from concrete level to formal level. Using non standard unit measurement that is chosen by students can be a model to support the students’ thinking.
c. Using students’ own constructions and productions
Students can use their own strategies to solve a problem that have meaning for themselves. Hence, using students’ constructions and productions is promoted as
an essential part of instruction. Students can use their own production when they choose their own unit in covering shapes.
d. Interactivity
The learning process of the students is not only as an individual process but also as social process. In this research, we ask students to work with small group so that they can share their ideas to their friends and can learn from each other in discussion. In class discussion, it could also encourage more interactions among every element in the class.
e. Intertwinement
It is important to consider an instructional sequence in its relation to other domains. When students learn about area measurement, it is also support other domain such as multiplication and geometry.
C. Emergent Perspective
social perspective that related to social norms, and sociomathematical norms. Social norms refer to expected ways of acting and explaining that become established through a process of mutual negotiation between the teacher and students. Meanwhile, the socio-mathematical norms are the ways of explicating and acting in whole class discussion that are specific to mathematics.
Socio norms in this research include the role of the students to follow the instruction of the teacher, the responsibility of them to explain and justify their solutions, try to hear and understand the explanation of others, and to pose questions if they do not understand it. Whereas, the socio-mathematical norms include how the students find different mathematical solution, a sophisticated mathematical solution, an efficient mathematical solution. The students develop personal ways of judging whether their solution is efficient or different. For example, in solving the problem to count how many square unit in certain area, students can decide which solution that easier for them whether they count one by one or use multiplication.
D. Area Measurement in Indonesian Curriculum for Elementary School
Table 1: Indonesian curriculum for the second semester of grade 3
The second Semester of Grade 3
Standard Competence Basic Competence
Geometry and Measurement 5.Calculating perimeter and area of square and rectangular, and its application in problem solving
5.1 calculating perimeter of square and rectangle
5.2 calculating area of square and rectangle 5.3 Solving problems related to perimeter and
area of square and rectangle
CHAPER III
METHODOLOGY
This chapter describes the methodology of the research. The main issues are: research methodology, research subject, data collection and data analysis including the reliability and validity.
A. Research Methodology
The aim of this research is to develop classroom activities that support students to learn area measurement. Therefore, the sequences of activities are design to develop a unit to measure area and to interpret the measurement results. For this purpose, design research is chosen for achieving the research goal and answering the research question. Three phases of design research are discussing in this research. According to Gravemeijer and Cob (2006), the three phases of conducting a design experiment, as following:
a. Preliminary Design
In this phase, the result is a formulation of what is called a conjectured local instruction theory, that is made of three components for area measurement: learning goals for students; planned instructional activities and the tools that will be used; and a conjectured learning process to anticipates how students’ thinking in the learning
process of area measurement.
b. Teaching Experiment
improve the conjectured local instruction theory that was developed in preliminary phase, and to develop an understanding of how it works.
c. Retrospective Analysis
In this phase, all data during teaching experiment are analyzed. Hypothetical Learning Trajectory (HLT) is used in the retrospective analysis as guidelines in answering the research questions. The HLT will be compared with students’ actual learning to investigate and to explain how students gain insight in developing unit in area measurement.
B. Research Subject and Timeline of the Research
This research was conducted in elementary school in Palembang, Indonesia, namely SDN 21 Palembang. However, this school is new to mathematics realistic education because it has been involved in PMRI project since 2010. A teacher and students in grade 3 were involved in this research. The students were about 8 or 9 years old and they have learnt about linear measurement and multiplication in grade 2.
This research was carried out in two cycles namely pilot experiment and teaching experiment. In the pilot experiment the sequences of activities were tried out to small group that involved 9 students. The design of HLT was tried out to see how it works and to investigate the students’ thinking about the problems so that we can improve the HLT.
The improved of initial HLT then was tested to another class in the second cycle. This involved whole class that consisted of 36 students.
Table 2: The outline of the data
Activity Date
Preliminary design
Studying literature and designing initial HLT
September 2010 – January 2011
Discussion with teacher February 2011 Pilot experiment
Observation in grade 3A February 2011 Pre assessment in grade 3D February 2, 2011 Pre assessment in grade 3A February 3, 2011 Tryout in grade 3D
Activity 1: Telling the size of the cakes
February 5, 2011
Activity 2: Choosing the chocolate February 7, 2011 Activity 3: Cookies in baking trays February 8, 2011 Activity 4: Unit Investigation February 9, 2011 Activity 5: Tiles in living room February 10, 2011 Activity 6: The area of swimming
pool
February 11, 2011
Post assessment in grade 3D February 12, 2011 Teaching Experiment
Activity 1: Telling the size of the cakes
March 2, 2011
Activity 2: Choosing the chocolate March 3, 2011 Activity 3: Cookies in baking trays March 7, 2011 Activity 4: Unit Investigation March 9, 2011 Activity 5: Tiles in living room March 10, 2011 Activity 6: The area of islands March 12, 2011 Post assessment in grade 3A March 16, 2011 C. Data Collection
In this research, various data source were collected to investigate the learning process of the students and to answer research question. The data collection of this reseach is described as follows :
The learning process and students activities in measuring area are recorded by using cameras. Students’ strategies and discussion during the lesson are easy to observe from video. Observation and interview with the students were carried out in this research. The students were interviewed to gain more information about their strategies and their reasoning to solve the problem in learning activities.
2. Written Data
The written data from students’ work in solving the problems provide more information about students’ achievement in learning area measurement. The written data included students’ work during teaching experiment, the results of assessments
including the final assessment and some notes gathered during the teaching experiment.
D. Data Analysis, Reliability and Validity
1. Data Analysis
The Data were collected and analyzed from the teaching experiment. The process of data analysis involves making sense out of text and image data that is preparing the data for analyses, conducting different analysis, moving deeper and deeper into understanding the data, representing the data, and making an interpretation of the larger meaning of the data (Creswell, 2003). Based on that, researcher transcript the video recording and interview that can give information in order to answer research question. Then, conjectures in learning trajectory were compared with students’ actual learning. Analyzing the data involves colleagues
and supervisor in order to avoid subjectivity point of view.
Reliability of the data was gathered in qualitative reliability. The qualitative reliability was conducted in two ways, data triangulation and cross interpretation. In this research, triangulation involved three different sources of gathering data namely video recording, interview and written data. These three sources were used to check interpretation of data gathered. The data gathered also cross interpreted with supervisors in order to reduce the subjectivity of the researcher’s point of view.
3. Validity
The validity concerns on the quality of the data collection and the conclusion based on the data. Hypothetical learning trajectory was used as guideline to answer research question. Learning process of the students is recorded and students’ answer
also collected to gain data. With this extensive data, the situation and the findings were described in detail to give sufficient information for reasoning in conclusions.
CHAPTER IV
HYPOTHETICAL LEARNING TRAJECTORY
A design and research instrument that proved useful during all phases of design research is called hypothetical learning trajectory (HLT) (Barker, 2004). An HLT consists of the goal for students’ learning, the mathematical tasks that will be used to promote students learning, and hypothesis about the process of students’ learning (Simon and Tzur,
2004).
In the initial hypothetical learning trajectory, students are expected to gradually achieve some mathematical goals as following:
Students are able to identify the attribute of area Students are able to compare and order the area
Students are able to compare area by using same kind of unit Students are able to use unit to compare the area of shape Students are able to count the unit used in easy way
Students are able to determine the area of two dimensional shape by using unit given Students are able to find the area of irregular shapes
Based on the goals above, instructional activities are design on learning trajectories. The instructional activities are designed in four phases in which students are involved to do some activities.
The elaborated of the initial hypothetical learning trajectory as follows: A. Identifying the Attributes
Concept:
a. Conservation of area
Goals:
Students are able to compare and order the area
Mathematical activity: Telling the size of the cake
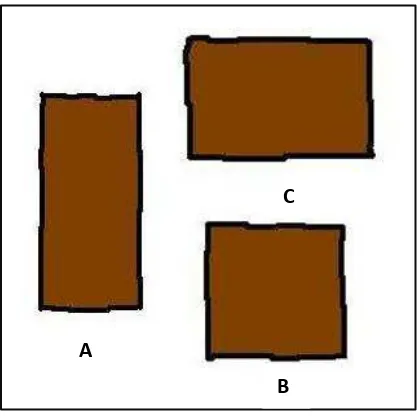
In this activity, students will tell about cakes that are brought by teacher. There are two different sizes of cakes with the same thickness. Students are asked what they can tell about those two cakes and what the differences between those cakes. The students will discuss about the differences especially about the size of the cakes. After that, students are given figure of three pieces of cakes with different size. They are asked to order the cake in the figure based on the size. They will be provided with scissor if they feel need to cut the figure (See figure 1)
Figure 1: The cakes with different size
The tasks are:
1. The figure above is three pieces of cakes. Sort the cake based on the size. 2. What is your strategy to sort the cakes? Explain your answer.
Conjectures:
C
In discussion about the size of two cakes, students can compare the cakes by sight. They will react about the size in which one is big and another one is small. Then they have to explain why they think the cake is big or small. The students might think that the side of the big cakes is longer than another one. They might also think that the big cake can be cut into small pieces like the small one. Then, to order the cake in the figure, students might order from the smaller to the biggest or another around. Then, they have to explain why they think so. The problem is how they decide which one is the biggest/the smallest since the figures do not differ much in size so that they cannot compare by sight. Some children might say that the biggest is the longest one, but they have to consider the width of the cake. To decide which one is the biggest/the smallest they might directly compare the cake by cutting the figure and putting one cake on the top of other cakes. Then, they will see part of the cakes that sticks out. Students can reshape the cake in such way one cake is covered by another so that they can see which one is the biggest. They might compare the cake one by one, for example compare cake A and cake B first, after they know which cake is bigger, they will compare it with cake C. after that they can order the cakes from the biggest to the smallest or another around.
Discussion:
quantity or magnitude of attribute by comparing the differences of the cakes based on the size. For the next task, student must order the cakes based on the size that they have discussed before. Conflicts will emerge when students compare the figure by cutting one cake and putting on the top of another but the biggest cake cannot be said certainty. What they have to do is reshape the cake so that one cake can cover another cake, so that the biggest can be said certainty. Through this problem, students become more aware that the larger piece of cakes, deals with the largest area. During this activity, students can acquire experiences with comparing strategies related to physical quantity area. The use of words such as greater, larger and smaller will focus on the attribute of area. It is also expected that they will realize that the area of a plan object does not change if it is reshaped.
b. Identical unit
Goal:
Students are able to compare area by using same kind of unit
Mathematical activity: Choosing the chocolate
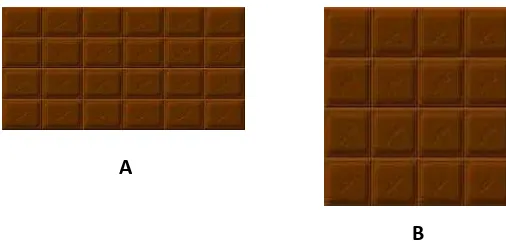
Figure 2: The chocolates with different sizes
The tasks are:
1. The price is those chocolate above is same. If you want to buy one of those chocolates, which one would you buy? Explain your answer.
2. Describe the method that you use in choosing the chocolate that you want to buy? 3. How many unit chocolate in each chocolate? Explain your answer.
Conjecture:
Some students might think that the biggest is the best choice, but there is possibility that some students choose the small chocolate. It is become a good discussion among them because they have to explain their decision. To decide which one is big/small, they might think that the chocolate that has more units chocolate is the big one. Then, they will count the number of unit chocolate in each chocolate. They will find that the first chocolate has 24 chocolates unit and the second has 16 chocolates unit. However, if they cut the figure of the chocolate and put the first on the top of the second chocolate like what they do in the first activity, they will find that the second chocolate is bigger that the first chocolate. To convince which one is big/small, they could use the small unit of the chocolate and measure another one with them or the other way around by iterating the unit so that the object can be compared.
A
Discussion:
It is expected that there will be a discussion in group to decide which chocolate is big/small. It will be a conflict for students when they have different answer in discussion. Some group might decide the first chocolate is the biggest since they count the number of unit in each chocolate. Other groups maybe have different answer because they compare directly by cutting and putting on the top of another and decide the second chocolate is the biggest. It is expected that students will discuss about the unit used in each chocolate. They cannot compare the chocolates because the units are different. So, students can understand that the area of objects can be easy to compare if the similar unit is used.
B. Comparing Area Concept: Partitioning, unit iteration
Goal:
Students are able to use unit to compare the area of shape
Mathematical activity: Cookies in baking trays
will work on small group to compare the baking tray. Each group will get two pieces of cardboard as representing of baking trays.
The tasks are:
1. Which baking tray could you put the most cookies? 2. Describe your strategy in comparing the baking tray!
Conjecture:
Some students might just estimate the biggest baking tray since they do not know how to compare. Some students might think that they only need to draw the form of the cardboard on paper and cut to compare, but they have to describe how big their baking tray to answer the question number 3. So, they need number of unit to explain how big it is. They could use any kind of units to measure the baking tray such as small paper/sticky papers and arrange them in baking tray and then counting how many are used. While covering, they may cover the paper with overlapping or with gap. On the other hand, some students might look carefully the paper that should not overlap, or might estimate the gap of the rest part of cardboard. Students who compare the baking tray with small unit will find that they need more units to cover the baking trays and the other hand, students who work with big units will find that they need few units.
Discussion:
that they can compare the baking trays. Then they have to count how many unit needed to cover each baking tray. When measuring the object with different unit, they will realize that the larger the unit the fewer are required. Also, they realize that to determine how big the baking tray, the unit that they used has to be not overlap and all parts are covered.
C. Square Unit Measurement Concept: Structuring space, unit iteration, square unit
Goals:
Students are able to explain that area is measured by using square units
Mathematical activity: Unit investigation
In the previous activity, students are asked to find how big their baking tray is. In this activity students will be asked to investigate which shape is suitable to measure the baking tray. The students are provided many kind of paper such as rectangles, squares, triangles and circles. Students work in small group (4 or 5 students) and each group is given one cardboard and many kind of papers to measure. The question for them is: which shape that appropriate to measure the area of the cardboard? Explain your answer.
Conjecture:
direction, they will find that it hard to count. After they compare with square, they will find that no matter how they arrange the square, it always well ordered.
Discussion:
It is expected that students realize that square is appropriate unit to measure the area rather than other unit. It is not wise to cover the baking tray with circle because it cannot cover all surfaces. Also, it is not efficient to work with triangle because the students will have many variations to arrange the triangles. It will be nice to use rectangle because it can cover the surface and easier to count, but the students still have variation in arranging the rectangle if the rectangle arrange in different direction. So, the best choice is square because no matter they arrange the square paper, it is always well ordered so that it will be easy to count. Through this problem, students will understand how useful it is to work with square rather than other units. Because square can cover all surface, easy to arrange and easy to count if the students use multiplication. When the students understand why they have to measure the area by using square unit, it will be easy for them to use standard unit measurement as a square unit such as square centimeters, square meters, etc. But in here, the standard unit has not yet introduced to the students.
D. Find the Number of Unit a. Concept: multiplication
Goal:
students are able to count the unit used in easy way
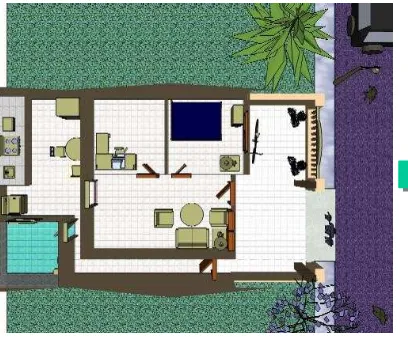
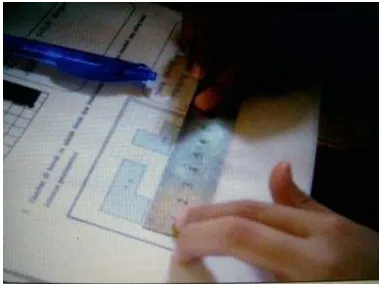
Students will tell about the sketch of Eko’s house. They are told that Eko’s parents want to replace the tiles of the living room with the new one. Eko wants to know the area of his living room. The students will be asked to help Eko to find the area of the living room.
The tasks are:
1. The figure below is the sketch of Eko’s house. What is the area of Eko’s living room?
2. How do you know that? Explain your answer.
3. Find the easiest way to determine the area of the living room. Explain your answer.
The sketch of the living room as following:
The sketch of the house The sketch of living room
Figure 3: The sketch of the living room
Conjecture:
count how many rows because they realize that each row has same number of square, they will multiply it by the number of rows. They could also count the tiles in column and then count how many columns in the figure then multiply it.
Discussion:
It is expected that the students can use multiplication to count the tiles in the figure. It will be a conflict for them to count the tiles because not all tiles can be seen. The students can imagine the tiles and realize that the pattern of the tiles is unchanged. It will be easy to count if they think that they have to find the number of tiles on the edge of the room. It is expected that they will use multiplication as an easy way to count the tiles.
b. Concept: conservation Goal:
students are able to find the area of irregular shapes
Mathematical activity: The area of swimming pool
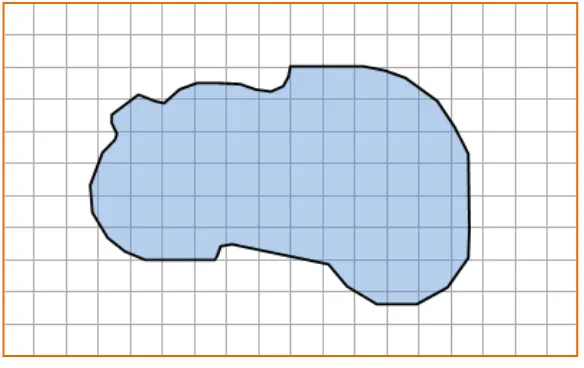
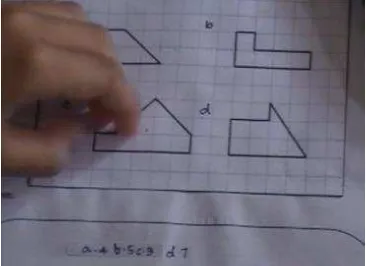
In the previous activity students only deal with regular shape problem. In here, students are asked to find the area of irregular shape. Students are given a figure of swimming pool that has irregular shape and then they have to find the area of that swimming pool (See figure 4).
The tasks are:
1. The figure below is a sketch of swimming pool. Find the area of the swimming pool!
Figure 4: The sketch of swimming pool
Afterward, students will do some exercises to find the area of some irregular shapes such in the following figure:
Figure 5: Exercises of irregular shapes
Conjecture:
To know the area of the swimming pool, students could count the square tiles that cover the swimming pool. But it difficult to count how many square in it because the swimming pool has irregular shape and there are many squares unit which not fully cover the swimming pool. Students might only count the full squares that cover the swimming pool without considers the squares that not fully cover the swimming pool. Some of them might estimate by adding mentally the squares which is not full with the
other. They also could count one if the square cover more than a half and not count if the square cover only less than a half.
Discussion:
CHAPTER V
RETROSPECTIVE ANALYSIS
Data gathered from pre test, pilot experiment, teaching experiment and final assessment are analyzed in this chapter. The results of this chapter are described as underlying principles explaining how and why this design works. Hypothetical learning trajectory is compared with students’ actual learning as guidelines to investigate and to explain how
students learn area measurement and develop unit as a means of measuring area.
A. Pre assessment
Pre assessment aimed at seeing the pre knowledge of the students. Students in class 3A and 3D were involved in this pre test. In this test, students had to answer four problems (See appendix A). Problem one consists of two questions. Question a, students were given figure of two field. One is longest and one is little wide. They were asked to tell anything about those two figures. This question aimed at investigating how students describe the size, whether they can use their word to describe the size of objects. Many students described those figures by telling the name of the shape, such as square and rectangle. For example, Indri wrote that Pak Saleh’s rice field is a rectangle and Pak Ridwan’s rice field is a square. Yessi described the figures by telling that Pak Saleh’s rice field is less than Pak Ridwan’s rice field and Pak Ridwan’s rice field is more than Pak Saleh’s rice field. The other two students described by other words. Oka described the figure by telling Pak Saleh’s rice field is longer than Pak Ridwan’s rice field and Agnes wrote Pak Saleh’s rice field is wider than Pak Ridwan’s rice
Habib wrote that Figure A is longer than Figure B but figure B is bigger than figure A. Only few of them described the figure by using words big and small. It makes sense that they still did not have an idea about area yet.
Question b, the students had to determine which field has the largest yield. It aimed at seeing whether they have a sense the attribute of area as two dimensional shapes. Most of students know that figure B has the largest yield. However, many of them cannot give their reason why they think so. They only said that Pak Ridwan’s field has the largest yield and Pak Saleh’s field has little yield. Only few of them can give reason that Pak Ridwan’s field is bigger than Pak Saleh’s field.
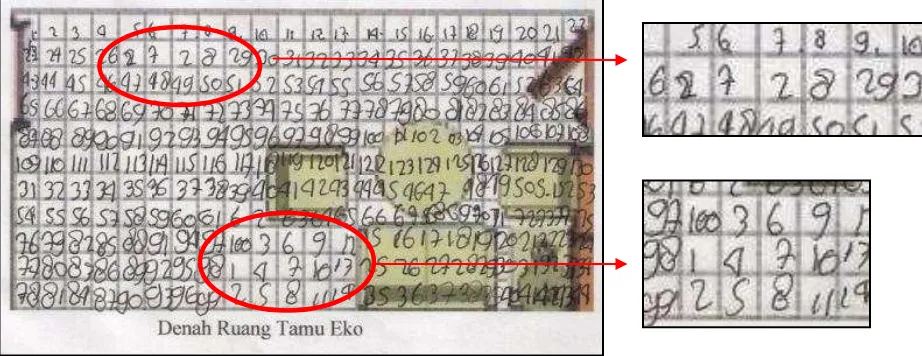
Problem two aimed at knowing student’s strategy in counting the tiles. The sketch of
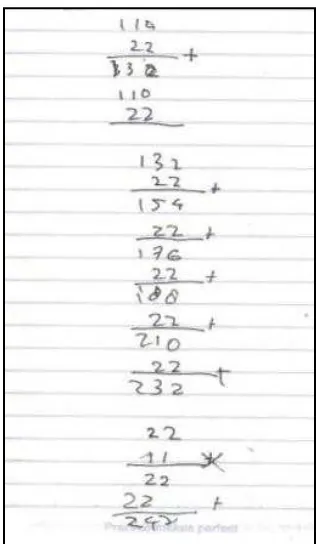
room with furniture in it was given to the students. Although they cannot see all tiles in the figure, it is expected that they count all the tiles in the figure and see mentally that all room is covered by tiles. Most of the students counted the tiles one by one. After interviewing some students, only one student counted the tiles by using multiplication. However, there are some students did not count the hidden tiles. They only counted the visible tiles. Meanwhile, the other students did not count the tiles. They only described the sketch of the room like what they did for problem number one. It seems they did not read the question although the teacher has explained the problem to them. Students who read the question counted the tiles one by one.
in it. One of students, Vincent, wrote that the figure A is bigger because its square is more than B as can be seen in figure 6. He counted the squares in each swimming pool and compared the number of the squares.
Figure 6: Student’s work in counting the units
Some of them chose the bigger based on perimeter of the figure rather than area. Based on their explanation they decided to choose B as bigger because they showed that they measured the perimeter of those two figures. Nadia was asked to explain her answer why she choose figure B. She said that she used ruler to measure the side of each swimming pool (See figure 7). It seems she think that measure the length around the figure is a way to compare which swimming pool is bigger.
Figure 7: Using ruler in measuring
In line with Nadia, Putriza said that B is longer than A while point the perimeter of figure B. it seems that she was thinking that the biggest swimming pool is the longest
a because the square of A is more
perimeter. Arif also explained that B is bigger than A by pointing the perimeter of the figures. It seems that he was thinking that the biggest swimming pool is the longest perimeter.
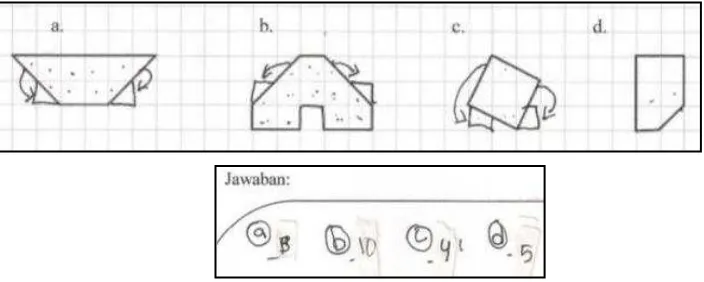
Problem four aimed at investigating whether the students count the square which is not intact or they ignore that. Four figures of irregular shape were given to them and they have to find how many squares in each shape. Almost all students counted all tiles in each figure although the square is not intact. They did not consider that they should count the square within boundaries of the shape. They did not see that the triangle in the shape can be combined become one square. Only one of them, Mirza, explained that he got his answer by adding a half square became one square (See figure 8).
Figure 8: counting the partial units
B. Pilot Experiment
The initial HLT was tried out in pilot experiment to find out how the designs work and how the students react about the problem given. Conjectures in our HLT were compared to the students’ answers in actual learning process. Data obtained were analyzed to support the
adjustment of the initial HLT. Nine students were involved in this pilot experiment. They have different academic ability with high achiever, average achiever and low achiever students.
1. Activity 1: Telling the Size of the Cakes
The aim of this activity was to investigate the ability of students to identify the attribute of area by comparing and ordering the area. For this purpose, students were given a figure of three cakes (see page 17) and they were asked to order the figure based on the size of the cakes. The students worked in pairs so that they can create effective discussion and it allows them to give more contributions to the group.
Before they compare and order the figures, the students were provoked to build vocabulary related to area. Two cakes with different size were shown to them and they are asked to describe the size of the cakes. As we predict, they only compare by sight. But then they were asked why they think so. But they were difficult to describe why the cake is big or small. They answered that one is square and another is rectangle. They also said that the side of one cake is longer than another cake.
answer by telling the shape of the cakes. They wrote: Figure A is bigger than figure B and C because figure A is rectangle, figure B is square and figure C is medium square, and state the order: From the smallest B, C, A, from the biggest A, C, B.
Based on students’ answer, they can describe the figure by using the words bigger,
smaller or shorter. They also described the size of object by telling the shape of the object, such as rectangle is bigger than square. They mention the name of shape seems that they did not have words in explaining why A is bigger than B and C since they also state the order of the cake based on the size. It means that the name of the shape only their way to explain the comparison.
In the figure, the big one is the long one so that they give reason the big one is the longest one. Therefore, the figure of the cake will be modified so that students can give more varied reasons for their answer, not only because the cakes is long but also the cake has two side that has to be considered. Students also did not get used to give reasoning therefore they have difficulties to give a reason for their work. When they were asked which one is bigger, they just replied that this one is big while pointed to the big cake. Before the activity comparing the three figures of cakes students had an activity to describe the real cakes that is brought by teacher but it seems did not help them in comparing the figure. Because the cake has height while the figure is a plan figure. Therefore, for the next cycle students will be given two invitation birthday cards which have same design but different in size. Students are asked to compare which card needs more paper. It is expected that students can have an idea to put the card on the top of another. Moreover, it can provoke them to give reason that one card has more rest if the cards are attached to each other.
that they can gain sense that they want to measure a region by putting one on the top of other instead just measure the side of cakes. Students were asked how to convince that their answer is true. Students kept silent and researcher offered to use scissors.
Researcher : Who can convince me that this (pointing figure A) is the biggest? I don’t believe that this one is the biggest.
Students : (silent)
Nisa : That is a square (figure B) Researcher : Can we use scissors? Nadia : Yes, we can
(Nisa cut figure B and then put it on figure C, see figure 9) Nisa : Nah, isn’t it. Small (pointing piece of figure B) Nadia : Try this (pointing figure A)
(Nisa put piece of figure B on the figure A)
Nisa : This one is longer (pointing figure A) Researcher : Now, order those figures based on the size
Figure 9: Putting the slice of cakes on the top of another
While cutting the figure, some students still did not know what to do with the figure. They only see how the other friends work with the figures and then did the same thing like their friends did. When comparing figure A and B, Nadia came up with unit which is appear in the figure accidentally because the print out of the figure leave a mark like lines.
Researcher : What do you think which cake that can be shared to the most people?
Students : A
Researcher : Are you sure that figure A is the biggest? Students : yes
(she tried to cut the figure but her friend forbade to do that)
Nadia : Nah, there is line in this. (put slice of figure B) One, two, three, four, five, six, seven, eight. ( put slice of figure A) One, two, three, four, five, six, seven, eight, nine , ten, eleven, twelve.
Researcher : so, which one is the biggest?
Students : A
Researcher : Now, we compare B and C. which one is bigger?
Student : B
Researcher : if we stick with each other which one is bigger?
Nisa : C
Researcher : do you agree all? Students : Yes
Researcher : Nadia. How do you think?
Nadia : C that has more rest although some of them were difficult to explain that. They give reason by telling the shape because they did not know how to explain. In short, in this activity students have a sense of the attribute of area that is the quantity inside two dimensional shapes since they noticed the quantity inside surface of an object.
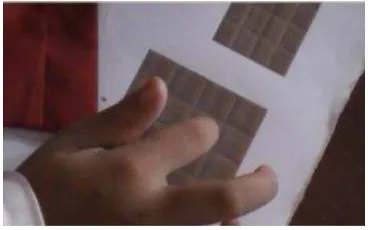
2. Activity 2: Choosing the Chocolate
with them or the other way around by iterating the unit. So, the object can be compared by using the same kind of units. Students were given a figure of two chocolates (see figure 10) and worksheet.
Figure 10: The Chocolates
For the first time, all students give answer directly after seeing the figure of the chocolate.
Researcher : In the shop, there are two chocolates that have the same price. Nadia : How much the price?
Researcher : The price is the same. If you want to buy the chocolate, which chocolate that you want to buy?
Students : B
Nisa : It is better A because that is a lot.
Researcher : look at the picture. Which one would you buy?
Nisa : A
Yasrib : B
Researcher : Yasrib, why do you choose B? Yasrib : because it is a lot
Researcher : Yasrib, tell to the other. Which chocolate that you want to buy?