M. Xu a *, C. X. Cao a, H. F. Guo b
a State Key Laboratory of Remote Sensing Science, Institute of Remote Sensing and Digital Earth, Chinese Academy of Sciences, Beijing 100101, China - (xumin, caocx)@radi.ac.cn
b
University of Electronic Science and Technology of China, Chengdu,611731, China - [email protected]
Commission IV, WG IV/3
KEY WORDS: Ebola virus disease, Spatiotemporal analysis, spatial distribution, cluster analysis
ABSTRACT:
Ebola hemorrhagic fever(EHF) is an acute hemorrhagic diseases caused by the Ebola virus, which is highly contagious. This paper aimed to explore the possible gathering area of EHF cases in West Africa in 2014, and identify endemic areas and their tendency by means of time-space analysis. We mapped distribution of EHF incidences and explored statistically significant space, time and space-time disease clusters. We utilized hotspot analysis to find the spatial clustering pattern on the basis of the actual outbreak cases. spatial-temporal cluster analysis is used to analyze the spatial or temporal distribution of agglomeration disease, examine whether its distribution is statistically significant. Local clusters were investigated using Kulldorff’s scan statistic approach. The result reveals that the epidemic mainly gathered in the western part of Africa near north Atlantic with obvious regional distribution. For the current epidemic, we have found areas in high incidence of EVD by means of spatial cluster analysis.
1. INTRODUCTION
Ebola hemorrhagic fever(EHF) is an acute hemorrhagic diseases caused by the Ebola virus, which is highly contagious(Pourrut et al., 2005). Ebola virus disease(EVD) first appeared both in the Democratic Republic of the Congo and the Sudan region at the same time in 1976(Baron et al., 1983). Since then the virus has erupted and popular for several times in different regions. Once infected it can cause viral hemorrhagic fever on humans and non-human primates (NHPs),characterized by acute systemic disease, clotting disorders, fulminant and Geisbert (2011) shock and death. It is believed interpersonal communication mainly spread through direct contact(Bermejom, 2006). Humans are infected mainly through contact with sick animals or infected body fluids, excretions, secretions and so on(Allison et al., 2007). Currently, fruit bats are generally considered the original reservoir of the Ebola virus(Leroy, 2005), Ebola virus is thought to also have a detrimental effect on the great ape population in Africa. Case-fatality rates of the African species in man are as high as 90%, with no prophylaxis or treatment available (Feldmann and Thomas, 2011).Since its host in nature has not been identified yet and there are no effective antiviral drugs and vaccines for it currently, the prevention of EVD remains difficult at present. Because its host has not yet identified in nature, and yet there is no effective antiviral drugs and vaccines for Ebola hemorrhagic fever so prevention is also extremely difficult at present. It has been classified as the most serious virus by the World Health Organization. The current epidemic in West Africa is the largest and most complex cases that have occurred since 1976. The number of cases and deaths in this epidemic exceeds the sum of
all the previous events. The virus spread not only within a country, but also between countries. It was found in Guinea at first, and then spread into Sierra Leone and Liberia through the land boundary. The epidemic is still spreading, which has caused wide public concern around the world.
Most cases occurred in this epidemic are interpersonal communication. Exploring possible gathering area of EVD cases based on geographic information technology can provide effective data support for the development of prevention strategies (Briggs and Elliott, 1995). Now, in order to lay a technical foundation for the detection of the controlling and prevention of infectious disease researches in this area tend to identify endemic areas and their tendency by means of time-space analysis. Spatial patterns of disease, especially the cluster distribution, are important to early warning and effective control(Mott et al., 1995). Cluster detection and early warning systems assist surveillance and can permit timely interventions(Benschop, 2008). Exploring of possible risk areas through the analysis of a specific area will contribute to the development of prevention and controlling strategies. Chronological and spatial analysis has been used to describe the transmission pattern of Ebola virus during its outbreak in the philipines. Some scholars have found that activity areas of bats carrying the virus are basically the same with that of EVD outbreak by using a new geography approach(Groseth, 2007; Pourrut, 2007).With the help of GIS some researchers have proved that H1N1 can easily diffuse through the air transportation system in the world. During the time period 2004–early 2006 a sequence of three epidemic waves occurred in Vietnam have been identified as distinct spatial and temporal clusters.In this paper, we have adopted geographic information system as the main technology combined with statistical methods to study the epidemic in West Africa. And analyze the propagation characteristics of EVD from three aspects, including time series, spatial distribution, and environmental risk factors.
2. METHODS 2.1 Data source
2.1.1 Establishment of a database of Ebola: The epidemic data including all of the world record since 1976 and the latest statistical data from March to August of 2014, is collected from the World Health Organization's official website. The epidemic data is collected and organized according to WHO report so as to design and build the database as needed.
2. 1.2 Basic geographic date: The study area in the paper is West Africa, where the initial cases are founded, involving three countries (Guinea, Liberia and Sierra Leone). Electronic map prepared mainly are administrative regions of different levels and the main traffic road map of the study area. These vector maps were generated with the help of ArcGIS10.0 and base maps of Google Maps. Then we set up base map datasets using these vector layers after the processing of projection, calibration, registration.
2.2 Spatiotemporal analysis method
2.2.1 Temporal analysis: After the first outbreak of the virus, it also had been appeared in Zaire, Africa, Sudan, Uganda, Gabon, South Africa and other regions, showing an obvious trend with endemicity and intermittency. Given the prevalence of the virus has appeared many times in history, it will be analyzed on two different time scales in this article. On the one hand, we tried to analyze the time pattern of the EVD from a historical perspective. We observed the EVD data between 1976 and 2012 visually in the form of charts based on statistical. On the other hand, we discussed the growth pattern of the EVD in its infancy with a finer scale against the serious area of West Africa this year.
2.2.2 Spatial Analysis: Exploration of spatial patterns can be divided into descriptive analysis and spatial clustering analysis. In order to build a Case & Spatial database we associated the epidemic information and geographic one bases on spatial relationship using the data mentioned above. We used, choropleth mapping technique, one of the simple and most widely used method to visualize the disease incidence rate. We first prepared choropleth map using absolute number of cases according the ward polygon. Absolute numbers, however, cannot describe level of risk of population properly, so we computed raw rate map taking total population of respective ward into account. We used empirical Bayes smoothing (EBS) approach based on the idea of pooling information across wards using the GeoDa software to address the problem of “small number”. K-nearest neighbor criteria was used to define a spatial window taking four adjoining ward of the study area. We also computed a ward level excess risk map to assess the level of risk of each ward. All the mapping and smoothing work were performed in GeoDa and Arc GIS software.
2.2.3 Spatial Cluster Analysis: Local clusters of the outbreak were assed using Kulldorff’’s scan statistic approach. We used discrete Poisson model to account the EVD count data
Kulldorff’sscan statistic approach is that risk of a disease incidence is equal throughout the study area while the alternative hypothesis is that the risk is different inside and outside at least one of the scanning window. The likelihood function was maximized over all window locations and sizes, and the one with the maximum likelihood comprised the mostlikely cluster,i.e. cluster that was least likely to have occurred by chance. Only the cluster with significant level (i.e. p<0.05) are reported after the Monte Carlo simulation(9),by comparing the rank of the maximum likelihoodfrom the real datasets with the maximum likelihoods from the random datasets. The number of replications was limited to 999. The performance SaTScan is influenced by choice of parameters, such as maximum spatial cluster size, and can be improved by parameter selection using performance measures. We tested various parameter to address the instable parameterization to overcome these limitations and obtain the best performance. Finally maximum cluster size was set to 30% population at risk for spatial scan; and non-overlapping cluster option was selected. In all scan high rate options was chosen to account for hotspots clusters.
3. RESULT AND DISSCUSSION 3.1 Temporal Characteristics
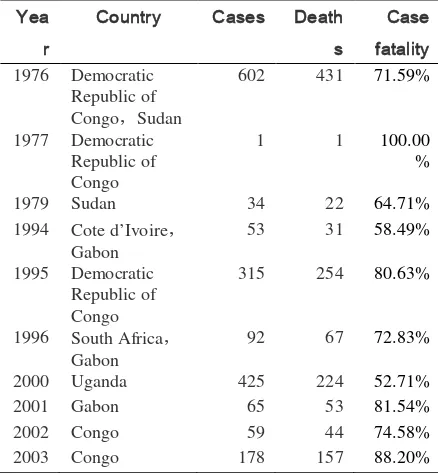
3.1.1 History epidemic trend analysis: The EVD history epidemic including the number of cases, deaths, morbidity and area of infected of the Ebola virus from 1976 to 2012 were shown in table 1.
Figure 1 shows that during 1976 to 2012, the EVD epidemic outbreak mainly appeared in central and southern Africa, such as Democratic Republic of Congo, Congo, Gabon, Uganda and the northeast of Sudan. It shows that the EVD nearly disappeared in the next following 20 years after its appearance in 1976, which can be ascribe to protective measures adopted at that time. After the year of 1995 the EVD outbreak did not show any apparent repeat law. Besides the onset area mainly concentrated in the western and central parts of Africa. This shows that in Africa where the tropical climate dominated, the virus does not disappear with every end of its outbreak.
2004 Sudan 17 7 41.18%
2005 Congo 12 10 83.33%
2007 Democratic Republic of Congo, Uganda
413 224 54.24%
2008 Democratic Republic of Congo
32 14 43.75%
2011 Uganda 1 1 100.00
% 2012 Democratic
Republic of Congo, Uganda
88 50 56.82%
Figure 1. Epidemic curve of global EVD incidence and mortality from 1976 to 2012.
3.1.2 EVD Trend analysis of the current epidemic: We collected the global epidemic data from March to June in 2014 in line with the reports of World Health Organization and draw its trend curve, as shown in figure 2. It shows that the number of cases is not stable, but showed a significant growth trend during this period. Furthermore, the growth rate of the cases is not exactly the same all the time, however it probably change once every 50 days, which can be observed obviously from figure 2. This periodic growth model may be associated with the presence of a certain incubation period of the virus. The previous analysis implied that the diffusion rate of the virus may step further.
To simulate and predict the onset of EVD in the short term we have taken the method of curve fitting based on the data of 2014. As a result the fit index is 0.9798, indicating that the simulation curve can be used to predict the incidence trends in the near future.
Figure 2. Statistics of global Ebola Trend curve from March to June, 2014
3.2 Spatial Characteristics
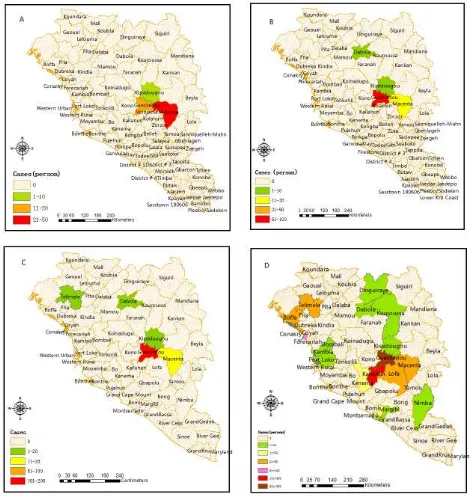
Figure 3. The spatial distribution of global EVD from March to June 2014.
3.2.2 Spatial Cluster Analysis: To explore high enclave space the statistical software of SaTScan was employed to conduct purely spatial analysis. During March 23rd to June 30th in 2014, a total of 759 cases was found in the study area, and forming four clustering area, covering 13 administrative regions (Figure 4). The largest enclave appeared at the frontier of the three countries, including Gueckedou, Kissidougou, Kono, Kailahun, Lofa, Macenta, Kenema.
We also use ArcGIS Spatial Statistics Hot Spot tool to analyze the epidemic hotspot maps (Figure 4A). It shows that the hot zone is still cities near by the border, which is in consistent with that of Satscan. These cities are in the height of aggregation, and should lay more attention on prevention work.
Figure 4. Spatial clusters of global EVD from March to June 2014
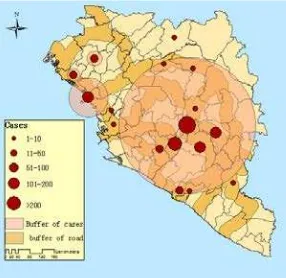
3.2.3 Impact factor Analysis: we employed the EVD space transportation network distribution to explore the influence that road traffic exerted on the spread of the virus. we found that most of the serious cases often appears in areas that within 20cm (map distance) from the main traffic road. Thus we have extend the traffic layer by creating 20cm buffer traffic routes. Moreover, taking the impact of the epidemic point into account we have drawn buffer point in different sizes according to their properties about cases (Figure 5).From the buffer analysis chart, we can see that the buffer of traffic routes and epidemic points covers different areas, but there is a big overlapping area between them. Considering the above analysis, we may believe that the risk of EVD in these areas appear higher than other regions.
4. CONCLUSION
In this study, statistical analysis concerning previous outbreaks of EVD shows that prevalence law of the virus in the history is not clear. Spatial analysis reveals that the epidemic mainly gathered in the western part of Africa near north Atlantic with obvious regional distribution. For the current epidemic, we have found areas in high incidence of EVD by means of spatial cluster analysis. The Ebola virus is still in the diffusion in Africa at present, however, areas in threatened is relatively concentrated and it did not show the trend of global spread. In consideration of immature medical treatment and existing propagation conditions we believe that the Ebola virus should be on the focus of infectious diseases, and further researches are required to seek for effective methods in monitoring and controlling the epidemic.
ACKNOWLEDGEMENTS
This work was supported by the Youth Foundation of Director of Institute of Remote Sensing and Digital Earth of Chinese Academy of Sciences (Y3SJ8600CX), the open fund of Key Laboratory for National Geograophy State Monitoring (National Administration of Surveying, Mapping and Geoinformation) (2015NGCM).
REFERENCES
Allison G., Heinz F., James E. S. 2007, The ecology of Ebola virus. Trends in Microbiology, 15(9), pp. 408-416.
Baron, R.C., McCormick, J.B., Zubeir, O.A., 1983. Ebola virus disease in southern Sudan: hospital dissemination and intrafamilial spread. Bulletin of the World Health Organization, 61, pp.997-1003.
Benschop, J., Stevenson, M.A., Dahl, J., et al. 2008. Towards incorporating spatial risk analysis for Salmonella sero-positivity into the Danish swine surveillance programme. Preventive Veterinary Medicine, 83, pp.347–359.
Bermejom M., Rodríguez-Teijeiro C., 2006, Ebola outbreak killed 5000 gorillas. Science, 314, pp.1564.
Briggs, D.J., Elliott, P., 1995. The use of geographical information systems in studies on environment and health. World Health Statistics Quarterly, 48(2), pp.85-94.
Feldmann, H., Geisbert, T.W., 2011. Ebola haemorrhagic fever. TheLancet, 377(9768), pp.849-862.
Pourrut, X., Delicat, A., Rollin, P.E., et al. 2007. Spatial and temporal patterns of Zaire Ebola virus antibody prevalence in the possible reservoir bat species. The Journal of Infectious Diseases, 196 ( Suppl 2), pp.S176-S183.