Summary Understory red spruce (Picea rubens Sarg.) trees, between 20 and 50 cm in height and 12 years or more in age, were collected from mid- and high-elevation stands in north-central Vermont and placed in a closed-cuvette system to measure photosynthetic and transpirational responses to pho-tosynthetic photon flux density (PPFD) and temperature. Pho-tosynthesis, dark respiration, transpiration and water-use efficiency of trees from both stands responded to changes in PPFD and temperature in similar ways. Trees from both stands exhibited maximum rates of net photosynthesis at temperatures between 15 and 20 °C, and exposure to higher temperatures resulted in reduced rates of photosynthesis and increased rates of respiration. Net photosynthetic rates generally increased with increasing light intensity but began to level off at 250 µmol m−2 s−1. Water-use efficiency was maximal when temperature and PPFD were at 15 °C and above 400 µmol m−2 s−1, respec-tively.
Keywords: dark respiration, leaf conductance, net photosyn-thesis, photon flux density, Picea rubens, transpiration, water-use efficiency.
Introduction
During the past 30 years, many studies have investigated the decline of red spruce (Picea rubens Sarg.) throughout the Appalachian Mountains (Siccama et al. 1982, Johnson 1983, Johnson and Siccama 1983), a decline which closely parallels that of Norway spruce (Picea abies (L.) Karst.) in Europe (Tomlinson 1983, Liedecker et al. 1988). Upper-elevation stands of red spruce exhibit more severe symptoms of decline than lower-elevation stands (Johnson 1983, Donnelly et al. 1985), and over 50% mortality has occurred in some stands in the Green Mountains since 1965 (Vogelmann 1982). Recent studies suggest that red spruce has limited genetic variability that restricts its adaptability (DeHayes and Hawley 1992). The species also appears to be only marginally adapted to winter conditions in its native habitat (DeHayes et al. 1990), which could account for its decline, especially at upper elevations where both winter temperatures and the observed decline are
most severe (Johnson 1983, Donnelly et al. 1985). Based on these observations, we postulated that small changes in current environmental conditions might significantly influence red spruce physiology, especially at high-elevation sites.
The predominant symptom associated with red spruce de-cline is a progressive loss of overstory foliage. Canopy dete-rioration leads to increased light penetration to the understory (Perkins et al. 1987). Thus, red spruce understory trees are subjected to increased solar irradiance in declining stands, including exposure to full sunlight in larger canopy gaps. Full sunlight is known to inhibit photosynthesis in Engelmann spruce (Picea engelmannii Parry) (Ronco 1970, Kaufmann 1976). Moreover, increased irradiance at the forest floor will increase understory air temperatures, and temperatures of about 30 °C are superoptimal for photosynthesis in several temperate zone conifers including Sitka spruce (Picea sitchen-sis (Bong.) Carr.) (Neilson et al. 1972), white spruce (Picea glauca (Moench) Voss) (Goldstein et al. 1985), and Douglas-fir (Pseudotsuga menziesii (Mirb.) Franco) (Sorenson and Fer-rell 1973). To assess the possible impact of overstory foliage loss on red spruce understory trees, we therefore investigated the response of understory red spruce trees from mid- and high-elevation sites to a combination of four temperatures and four irradiances.
Materials and methods
Plant material
During summer 1989, understory red spruce trees were col-lected from a declining, high-elevation (945 m) stand on the western face of Mt. Abraham near Lincoln, Vermont and from a more vigorous, mid-elevation (380 m) stand on a gentle, east slope at Texas Falls, near Hancock, Vermont. These stands were chosen because of the observed difference in stand health, differences in elevation, and because physical and bio-logical characteristics of both stands have been studied pre-viously and described by Donnelly et al. (1985) and Snyder (1990).
Photosynthetic and transpirational responses of red spruce understory
trees to light and temperature
JOHN D. ALEXANDER,
1JOHN R. DONNELLY
2and JOHN B. SHANE
21 Northeastern Forest Experiment Station, P.O. Box 968, Burlington, VT 05402, USA 2 Forestry Department, University of Vermont, Burlington, VT 05405, USA
Received July 18, 1994
A preliminary study of understory light and temperature conditions in these red spruce stands was conducted by Don-nelly and Harris during the months of July and August, 1989 (unpublished data). Average photosynthetic photon flux den-sity (PPFD), measured with an LI-190s-1 quantum sensor (Li-Cor Inc., Lincoln, NE), varied from 15 µmol m−2
s−1 in the shade to 250 µmol m−2 s−1 in sun flecks to 1750 µmol m−2 s−1 under the larger canopy gaps. Maximum irradiance in the shade at Mt. Abraham was as much as six times that at Texas Falls. Mean temperature at both sites was around 22 °C, based on weekly maxima and minima, which agrees closely with the 23 °C average recorded at nearby NOAA weather stations at somewhat lower elevations (National Climatic Data Center 1989).
Once a week from June 30 until September 2 (10 weeks), 16 understory trees, between 20 and 50 cm in height and 12 years or more in age, were collected at random from each stand. Only trees that appeared vigorous and were growing in the shade of a closed canopy were selected. A sharpened section of 20-cm diameter PVC pipe was placed over each tree and forced into the soil to a depth of 15 cm; trees and their soil-cores were then removed and a nylon mesh secured over the bottom of each pipe. The trees were transported to the laboratory where they were kept well watered.
Experimental apparatus
The closed-cuvette gas analysis system used in this study is a modified version of that described by Wilmot (1987). A pro-grammed Zi-Tech DT100 datalogger (Zi-Tech Inst. Corp., Mountain View, CA) maintained cuvette CO2 concentration, relative humidity and temperature within predetermined ranges. Net photosynthesis of the entire aboveground portion of each tree was calculated by monitoring rates of CO2 deple-tion over a 45-min period with a Beckman model 865 infrared gas analyzer. Carbon dioxide concentration was maintained between 340 and 320 µl l−1
, which at that time straddled the global average of 330 µl l−1
(Harrington 1987), through peri-odic additions of CO2-enriched air. Relative humidity was maintained between 55 and 60% by automated removal of water vapor from the cuvette air by means of a column of silica gel desiccant. Transpiration rate of the aboveground portion of each plant was determined by monitoring the amount of water vapor removed to maintain near constant relative humidity over the 45-min sampling period. Temperature was maintained within ± 0.5 °C of the treatment temperature by controlling the flow of cool water through insulated copper tubing surround-ing the cuvette.
Treatments and measurements
Treatments consisted of all combinations of four photosyn-thetic photon flux densities (PPFDs) (100, 250, 400 and 550 µmol m−2
s−1) and four temperatures (15, 20, 25 and 30 °C), and corresponded to the observed range of understory condi-tions. The light source was a 1000-W Sylvania Metalarc con-tinuous spectrum lamp and the different irradiances were achieved by the use of shade cloth and by making small adjustments in the height of the lamp.
Following collection, the experimental trees were main-tained for between 2 and 6 days in a controlled-environment chamber that provided light and temperature conditions simi-lar to those in the forest. Each tree was then watered to excess and placed in a controlled-environment chamber and allowed to acclimate for 90 min to one of the experimental light/tem-perature treatment combinations. Preliminary studies indi-cated that a 90-min acclimation period was adequate to achieve stable gas exchange measurements. Following acclimation, trees were sealed in the cuvette, and rates of net photosynthesis and transpiration were determined. Needles were removed from each tree following gas exchange analyses and oven dried to a constant weight at 50 °C. Leaf area was estimated by weighing dried needles and estimating fresh needle area by means of a previously developed regression equation (r2 = 0.99). The regression equation was obtained by measuring fresh leaf area (with an LI-3000 leaf area meter, Li-Cor Inc.) and dry weight of 10 batches of needles from trees from the two study sites. Net photosynthesis and transpiration were expressed on a leaf area basis (µmol CO2 m−2 s−1 and mmol H2O m−2 s−1, respectively) by dividing whole plant values by their leaf areas.
Before the start of the experiment, trees from each stand were randomly assigned collection dates and treatment num-bers. The order of temperature treatment within a week and light treatment within a day were also randomly chosen at the start of each week. Eight trees, one at each of the four irradi-ances from each of the two stands, were analyzed at a single temperature on a given day. By repeating this arrangement on four consecutive days, with a different temperature each day, one replication of this experiment was completed every four days. The entire procedure, from tree collection through analy-sis, was repeated each week for 10 weeks, following a split-split plot design. Thus, with two stands (main plot), four temperature treatments plot), four light treatments (sub-sub-plot), and 10 replications, a total of 320 trees were sam-pled.
Data analyses
Data were tested for statistical assumptions of normality and equality of variance. As data for both transpiration and net photosynthesis failed to meet the equality of variance assump-tion, photosynthesis data were transformed using the square root of a given net photosynthesis value plus 10 and transpira-tion data were log-transformed. Subsequently, data were sub-jected to analysis of variance and Duncan’s multiple range test to distinguish differences in response among light/temperature treatments, between stands and among replications (weeks). In all cases, differences were accepted as statistically significant if P ≤ 0.05.
Results and discussion
rates between trees from the mid- and high-elevation stands may reflect the low genetic variability of red spruce (DeHayes and Hawley 1992), or the similarity of the environmental conditions at the two stands, or both. Temperatures, in particu-lar, were very similar at the two locations. However, PPFD in full shade was higher under the deteriorating canopy at Mt. Abraham (40 µmol m−2
s−1) than under the canopy at Texas Fall (16 µmol m−2
s−1). Snyder (1990) reported minor differ-ences in carbohydrate storage and allocation patterns between these same populations of red spruce in 1989. Although McLaughlin et al. (1990) also reported similarities in growing conditions at a high- and a low-elevation site in the southern Appalachians and a lack of differential adaptation in morpho-logical characteristics of foliage at the two sites, they observed that red spruce saplings at the high-elevation site had lower net photosynthesis than saplings at the low-elevation site, a finding that was tentatively associated with greater heavy metal con-centrations in upper-elevation soils.
Net photosynthesis
There was a significant difference in overall mean net photo-synthesis between Week 6 (1.15 µmol m−2
s−1) and Week 8 (2.46 µmol m−2
s−1) (P ≤ 0.05); however, neither of these values differed significantly from any other week, and no other seasonal photosynthetic trends were evident.
When averaged across all temperatures, net photosynthesis increased with increasing PPFD, reaching a maximum of 2.33 µmol m−2
s−1 at 550 µmol m−2 s−1 (Table 1). The greatest increase in net photosynthesis with irradiance occurred up to 250 µmol m−2
s−1. In a separate study we observed inhibition of photosynthesis at high irradiances. In two trees, at 30 °C, photosynthetic rates at irradiances of 1200 and 1600 µmol m−2 s−1 were 1.09 and 0.95 µmol m−2 s−1, which are both lower than the mean of 1.45 µmol m−2
s−1 observed at the same tempera-ture but at an irradiance of only 550 µmol m−2
s−1 in the main study. Apparently, at high temperatures, net photosynthesis of shade-adapted red spruce trees may be inhibited at irradiances approximating full sun. Lange et al. (1986) found a light
saturation point of 1500 µmol m−2
s−1 for Norway spruce, with the slope of the light-response curve decreasing markedly by 500 µmol m−2
s−1. Similar results have been reported for Sitka spruce by Morison and Jarvis (1983) and Leverenz and Jarvis (1979), for Douglas-fir by Meinzer (1982) and for shade-adapted foliage of Norway spruce and black spruce (Picea mariana (Mill.) B.S.P.) by Leverenz (1987). Leverenz found net photosynthesis in both species began to plateau at about 500 µmol m−2 s−1.
The shape of the response surface of net photosynthesis to increasing temperature was similar at all irradiances (Fig-ure 1), indicating no light × temperat(Fig-ure interaction. This is contrary to the findings of Manley and Ledig (1979). However, the study by Manley and Ledig included irradiances lower than those in the present study.
The increase in rates of net photosynthesis with increasing PPFD can be explained on the basis of increases in available energy (Teskey et al. 1986); however, the reason for the dimin-ishing rate of increase above 250 µmol m−2
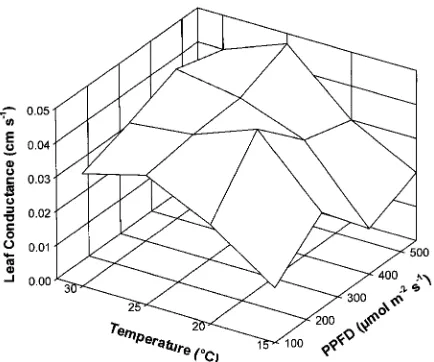
s−1 is uncertain. We computed leaf conductance (sum of stomatal, cuticular and boundary layer factors) through rearrangement of Ohm’s law (Kramer 1983) (Figure 2). Because each value reported in Figure 2 is based on a mean transpiration rate at measured values of temperature and relative humidity, error terms are not presented. At 15 and 20 °C, there were relatively large de-creases in leaf conductance at PPFDs above 250 µmol m−2
s−1 (Figure 2). Thus at these temperatures, increases in available light energy were offset by decreases in leaf conductance, resulting in a plateau in photosynthetic rate (Figure 1). How-ever, we did not find correspondingly large decreases in leaf conductance at 25 and 30 °C, indicating that at high tempera-tures, the plateau in photosynthetic rate was caused by changes in other plant processes, possibly including increases in meso-phyll resistance (Neilson et al. 1972).
When averaged over all PPFDs, net photosynthesis was relatively constant between 15 and 20 °C, decreased between 20 and 25 °C, and decreased more sharply between 25 and 30 °C (Table 1). Temperatures of around 30 °C have been
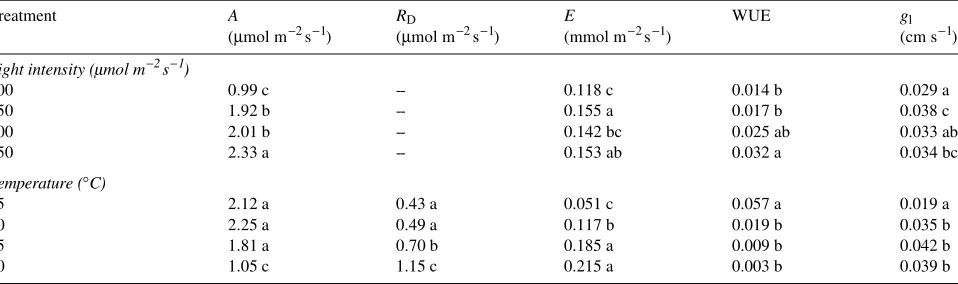
Table 1. Net photosynthesis (A), dark respiration (RD), transpiration (E), water-use efficiency (WUE, expressed as a ratio of moles of CO2 assimilated per mole of H2O lost), and leaf conductance (gl) of red spruce seedlings collected in the Green Mountains of Vermont. Each value is the mean of 80 seedlings, except for RD where n = 8. Within a treatment, values not followed by the same letter are significantly different (P ≤ 0.05), as determined by Duncan’s multiple range procedure.
Treatment A RD E WUE gl
(µmol m−2 s−1) (µmol m−2 s−1) (mmol m−2 s−1) (cm s−1)
Light intensity ( mol m−2 s−1)
100 0.99 c -- 0.118 c 0.014 b 0.029 a
250 1.92 b -- 0.155 a 0.017 b 0.038 c
400 2.01 b -- 0.142 bc 0.025 ab 0.033 ab
550 2.33 a -- 0.153 ab 0.032 a 0.034 bc
Temperature (°C)
15 2.12 a 0.43 a 0.051 c 0.057 a 0.019 a
20 2.25 a 0.49 a 0.117 b 0.019 b 0.035 b
25 1.81 a 0.70 b 0.185 a 0.009 b 0.042 b
observed to reduce net photosynthesis as a result of increased respiration in Douglas-fir (Sorenson and Ferrell 1973), in-creased mesophyll resistance in Sitka spruce (Neilson et al. 1972), and decreased stomatal conductance in white spruce (Goldstein et al. 1985). In red spruce, the temperature-induced decreases in net photosynthesis were most likely due to tem-perature-induced increases in respiration. Although there was no significant increase in dark respiration rates between 15 and 20 °C (Table 1), dark respiration rates increased by about 44% at 25 °C, and at 30 °C the rates were more than double those at 20 °C.
Transpiration
There were no seasonal differences among weekly mean spiration rates. When averaged across all temperatures, tran-spiration increased with increasing PPFD between 100 and 250 µmol m−2
s−1, but at higher PPFDs, the average transpira-tion rate remained relatively constant (Table 1). This consis-tency was due, at least in part, to compensating differences among temperature treatments in response to increasing light. At 15 and 20 °C, transpiration at 400 and 550 µmol m−2
s−1 tended to be less than at 250 µmol m−2
s−1 (Figure 3), whereas at 25 °C, transpiration rates were similar at 250 and 400 µmol m−2 s−1 but increased at 550 µmol m−2 s−1. At 30 °C, transpira-tion increased from 250 to 400 µmol m−2
s−1 and remained approximately constant from 400 to 550 µmol m−2
s−1. Tem-perature-induced variations in transpiration were larger than light-induced variations. Average transpiration at 30 °C was over four times greater than at 15 °C. In contrast, average transpiration at 550 µmol m−2
s−1 was only about 20% higher than at 100 µmol m−2
s−1. Thus, temperature, rather than light, was the primary variable affecting transpiration.
Water-use efficiency
Water-use efficiency, defined as the ratio between rates of net carbon dioxide fixation and water vapor efflux, was higher at 550 than at 100 or 250 µmol m−2
s−1, and was higher at 15 °C than at any other temperature (Table 1). This pattern parallels the responses of photosynthesis and transpiration to changes in temperature and irradiance. Thus, net photosynthesis was higher at 550 µmol m−2
s−1 than at other PPFDs, whereas transpiration at 550 µmol m−2 s−1 was not significantly higher than at any other PPFD except 100 µmol m−2
s−1. High water-use efficiency at 15 °C was primarily due to low transpiration. Our data indicate that it is at higher temperatures, which red spruce trees may be increasingly exposed to as stand canopy deterioration increases, that WUE decreases.
Figure 2. Leaf conductance of red spruce seedlings from the Green Mountains of Vermont in response to light intensity (PPFD) and air temperature. Values were calculated by dividing measured transpira-tion rates by vapor pressure deficits. Each value is the mean of 20 seedlings.
Figure 3. Transpiration of red spruce seedlings from the Green Moun-tains of Vermont in response to light intensity (PPFD) and air tempera-ture. Each value is the mean of 20 seedlings; vertical bars represent ± 1 SE of the mean.
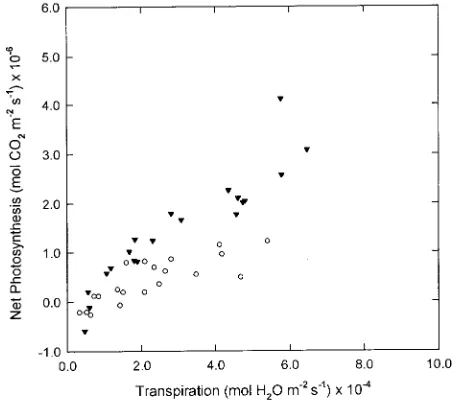
Although differences in mean net photosynthesis were found among temperature treatments, ranges in net photosyn-thesis for each temperature were similar (Figure 4). In contrast, there was much greater variability in transpiration within tem-perature treatments. The variation in transpiration response of the trees is of interest because we did not find differences between the stands in either net photosynthesis or transpira-tion, and red spruce is considered to exhibit low genetic vari-ability (DeHayes and Hawley 1992). Transpiration rate is primarily a function of vapor pressure gradient and leaf con-ductance. Average leaf conductance was lower at 15 °C than at other temperatures (Table 1), and this is consistent with reports documenting increased stomatal aperture at higher tempera-tures (Wilson 1948, Stålfelt 1962). The range in leaf conduc-tance was also greatest at 15 °C. However, because transpiration rate is also a function of vapor pressure gradient, and because vapor pressure gradient at 30 °C was approxi-mately double that at 15 °C, there was a greater range in transpiration at 30 °C (3 × 10⁻⁵ to 9.4 × 10⁻⁴
mol m−2 s−1) than at 15 °C (1.0 × 10⁻⁵ to 3.0 × 10⁻⁴
mol m−2 s−1) (Figure 4). Additionally, transpiration was only weakly related to net photosynthesis at 15 °C (r = 0.37, P ≤ 0.05), but was more strongly related to net photosynthesis at 30 °C (r = 0.86, P ≤ 0.05). The variation in transpiration at a particular temperature was not due to changes in PPFD. For example, at 30 °C, the range in transpiration at 100 µmol m−2 s−1 was very similar to the range at 550 µmol m−2
s−1 (Figure 5).
The finding that some tree transpiration rates at 30 °C were similar to those of other trees at 15 °C suggests that stomata were partly closed in some trees measured at 30 °C. Stomata may play an increasingly important role in regulating gas
exchange with rising temperature, resulting in greater individ-ual tree variation in transpiration rate and a stronger correlation between transpiration and net photosynthesis with increased temperature.
Conclusions
Red spruce trees achieved approximately 82% of maximum net photosynthetic rate at PPFDs similar to those of sunflecks penetrating the canopy in natural stands, and maximum net photosynthesis occurred at temperatures of 15 to 20 °C, which are at or below average growing season temperatures found in these stands. Transpiration increased with PPFD to approxi-mately 250 µmol m−2
s−1, and increased with temperature to 25 °C. Water-use efficiency was highest at 550 µmol m−2
s−1 and at 15 °C due to a combination of high rates of net photo-synthesis and low transpiration under these conditions. High rates of net photosynthesis were associated with correspond-ingly low rates of dark respiration; transpiration was lowest at 15 °C as a result of a combination of low vapor pressure deficit and low leaf conductance. We conclude that red spruce trees are well adapted to the relatively low light and temperature regimes that are typical of the understory of natural stands. However, increased irradiances and midday temperatures, par-ticularly around advance regeneration near the forest floor, as a result of deteriorating canopies, are likely to have negative effects on both the energy balance and water relations of red spruce trees, at least in the short term. It remains, however, to be determined how advance regeneration adapts over time to increased irradiance resulting from overstory decline.
References
DeHayes, D.H. and G.J. Hawley. 1992. Genetic implications in the decline of red spruce. Water Air Soil Pollut. 62:233--248. Figure 4. Effect of treatment temperature on water-use efficiency of
red spruce seedlings. Each point represents a single seedling. Linear regressions are: (1) 15 °C (s): y = 9.23e−3x + 1.58e−6 (r = 0.37); (2)
20 °C (,): y = 9.66e−3x + 9.90e−7 (r = 0.62); (3) 25 °C (d): y =
6.44e−3x + 4.57e−7 (r = 0.80); and (4) 30 °C (.): y = 4.39e−3x −
1.14e−7 (r = 0.86).
Figure 5. Water-use efficiency of red spruce seedlings at 30 °C and a light intensity of 100 (s) or 550 (.) µmol m−2 s−1. Each point
DeHayes, D.H., C.E. Waite, M.A. Ingle and M.W. Williams. 1990. Winter injury susceptibility and cold tolerance of current and year-old needles of red spruce trees from several provenances. For. Sci. 36:982--984.
Donnelly, J.R., J.B. Shane, D.R. Bergdahl, J.C. Clausen, R.A. Gregory and B.L. Wong. 1985. A preliminary assessment of red spruce vigor as related to physiographic characteristics in Vermont. Northeast. Environ. Sci. 4:18--22.
Goldstein, G.H., L.B. Brubaker and T.M. Hinckley. 1985. Water rela-tions of white spruce (Picea glauca (Moench) Voss) at tree line in north central Alaska. Can. J. For. Res. 15:1080--1087.
Harrington, J.B. 1987. Climatic change: a review of causes. Can. J. For. Res. 17:1313--1339.
Johnson, A.H. 1983. Red spruce decline in the northeastern US: hypotheses regarding the role of acid rain. J. Air Pollut. Control Assoc. 33:1049--1054.
Johnson, A.H. and T.G. Siccama. 1983. Acid deposition and forest decline. Environ. Sci. Technol. 7:294--305.
Kaufmann, M.R. 1976. Stomatal response of Engelmann spruce to humidity, light, and water stress. Plant Physiol. 57:898--901. Kramer, P.J. 1983. Water relations of plants. Academic Press Inc., New
York, 489 p.
Lange, O.L., G. Führer and J. Gebel. 1986. Rapid field determination of photosynthetic capacity of cut spruce twigs (Picea abies) at saturating ambient CO2. Trees 1:70--77.
Lange, O.L., J. Gebel, E.-D. Schulze and H. Walz. 1985. Eine methode zur raschen Charakterisierung der photosynthetischen leis-tungsfähigekeit von Bäumen unter Freilandbedingungen----anwen-dung zur analyze ‘‘neuartiger Waldschäden’’ bei der fichte. Forstwiss. Centralbl. 104:186--198.
Leverenz, J.W. 1987. Chlorophyll content and the light response curve of shade-adapted conifer needles. Physiol. Plant. 71:20--29. Leverenz, J.W. and P.G. Jarvis. 1979. Photosynthesis in Sitka spruce.
VIII. The effects of light flux density and direction on the rate of net photosynthesis and the stomatal conductance of needles. J. Appl. Ecol. 16:919--932.
Liedeker, H., P. Schütt and R.M. Klein. 1988. Symptoms of forest decline on Norway and red spruce. Eur. J. For. Pathol. 18:13--25. Manley , S.A.M. and F.T. Ledig. 1979. Photosynthesis in black and red
spruce and their hybrid derivatives: ecological isolation and hybrid adaptive inferiority. Can. J. Bot. 57:305--314.
McLaughlin, S.B., C.P. Anderson, N.T. Edwards, W.K. Roy and P.A. Layton. 1990. Seasonal patterns of photosynthesis and respiration of red spruce saplings from two elevations in declining southern Appalachian stands. Can. J. For. Res. 20:485--495.
Meinzer, F.C. 1982. The effect of light on stomatal control of gas exchange in Douglas-fir (Pseudotsuga menziesii) saplings. Oecolo-gia 54:270--274.
Morison, J.I.L. and P.G. Jarvis. 1983. Direct and indirect effects of light on stomata. I. In Scots pine and Sitka spruce. Plant Cell Environ. 6:95--101.
National Climatic Data Center. 1951--1991. Climatological data an-nual summary: New England. Vols. 63--103. National Oceanic and Atmospheric Administration, U.S. Government Printing Office, Washington, D.C.
Neilson, R.E., M.M. Ludlow and P.G. Jarvis. 1972. Photosynthesis in Sitka spruce (Picea sitchensis (Bong.) Carr.). II. Response to tem-perature. J. Appl. Ecol. 9:721--745.
Perkins, T.D., H.W. Vogelmann and R.M. Klein. 1987. Changes in light intensity and soil temperature as a result of forest decline on Camel’s Hump, Vermont. Can. J. For. Res. 17:565--568.
Ronco, F. 1970. Influence of high light intensity on survival of planted Engelmann spruce. For. Sci. 16:331--339.
Siccama, T.G., M. Bliss and H.W. Vogelmann. 1982. Decline of red spruce in the Green Mountains of Vermont. Bull. Torrey Bot. Club. 109:162--168.
Snyder, M. 1990. Seasonal patterns of carbohydrate reserves within red spruce. Masters Thesis. University of Vermont, Burlington, VT, 57 p.
Sorensen, F.C. and W.K. Ferrell. 1973. Photosynthesis and growth of Douglas-fir seedlings when grown in different environments. Can. J. Bot. 51:1689--1698.
Stålfelt, M.G. 1962. The effect of temperature on opening of the stomatal cells. Physiol. Plant. 15:772--779.
Teskey, R.O., J.A. Fites, L.J. Samuelson and B.C. Bongarten. 1986. Stomatal and non-stomatal limitations to net photosynthesis in Pinus taeda L. under different environmental conditions. Tree Physiol. 2:131--142.
Tomlinson, G.H. 1983. Air pollutants and forest decline. Environ. Sci. Technol. 17:246--256.
Vogelmann, H.W. 1982. Catastrophe on Camel’s Hump. Nat. Hist. 91:8--14.
Wilmot, T.R. 1987. Photosynthesis and water relations of drought-stressed yellow birch seedlings. Masters Thesis. University of Ver-mont, Burlington, VT, 70 p.