Geographic Information System of Local Poverty
Reduction Using
Basic Need Approach
Concept
with
Fuzzy Multi-Criteria Decision Analysis
(MCDA) Method
Hartomo Kristoko 1 , Wowor Danny 2, Trihandaru Suryasatriya 3, Yulianto Sri 4 1,2,3, 4 Satya Wacana Christian University, Salatiga, Central Java, Indonesia
Salatiga, 50711, Indonesia
Abstract
The lack of information of the poor people dispersion in certain area becomes one of the factors causing the lack of poverty reduction in certain area. This research aims to provide the alternative solution of the poverty reduction in Central Java areas of which the poor population is about 5.225.990 people with poor rate of 16, 21% in September 2011. The result of the research is supposed to be able to provide information of poverty data distribution as the solution to take an action towards poverty reduction for Central Java government. The method employed in this research is Fuzzy MCDA as the data processing method for supporting the decision making. The Local Poverty Reduction System is able to generate an output of spatial map of the poor areas in Central Java. The
spatial map can be applied easily since complemented with visualization of poor areas with color gradation-based which shows the rate of local poverty. The system output of the top 5 of poor areas in Central Java comprises Wonosobo, Kebumen, Brebes, Rembang and Banjarnegara regencies. Likewise, the output of the top 5 of well-economic rate areas comprises Semarang, Jepara, Salatiga, Pekalongan and Kudus.
Keywords : Poverty, spatial map, fuzzy MCDA, Central Java
1.
Introduction
Poverty is one of the most significant measurements to figure out a prosperity rate of a household. As an aggregate measurement, the poverty rate in certain area is commonly used to measure the prosperity rate in that area. Thus, poverty comes to be one of the main themes of development. Success and failure of the development are typically measured based on poverty rate alteration [22].
An attempt to decrease poverty rate commenced in the early 1970s for instance, through Community Guidance (Bimas) and Rural Assistance (Bandes) program [16]. Regrettably, the attempt went through saturated phase in the mid 1980s; in which means the attempt of poverty reduction in 1970s was not all-out. Hence, the amount of poor people in the early 1990s was increased over. Besides, the tendency of income disparity is widespread comprising sectors, groups and inter-regions inequality. Based on provisional figures projection of Population Census (SP) in 2010, the population of Central Java in 2011 covers 32,64 million people or about 13,54 percent of
One of the factors causing the lack of poverty reduction in certain area is the lack of information of poor resident dispersion in certain area. The result of study conducted by SMERU in 2011 about the urban areas spatial poverty and the correlation between urban spatial planning and poverty reduction in Surakarta and Makassar shows that the understanding from the concerning parties especially Satuan Kerja Perangkat Daerah (SKPD), about the correlation between spatial planning element and poverty reduction attempt is still limited. Besides, the poverty reduction attempt in Surakarta and Makassar still tends to emphasize programmatic approach and tends to stand on the budget lines without directly comes into the urban spatial planning [20].
For supporting the poverty reduction strategy in Central Java, it needs to control the society prosperity integrated to the development planning which enables the policy making to support the poor by providing opportunity for them to make a better life continuously in which is out of susceptible condition; in short-term for instance, by providing data and information of the spatial-based poverty distribution in order that the assistance program of the government can be distributed properly on target.
2.
Related Works
Some Poverty Measurement Models in Indonesia explain that one of the significant aspects to support poverty reduction strategy is the availability of poverty data which are government policy on poverty, compare poverty across time and regions, and determine the target of the poor in order to improve their position as well.
A study entitled Poverty Mapping in East Java with Multivariate Adaptive Approach conducts a modelling poverty in East Java with Multivariate Adaptive Regression Spline (MARS) Approach in which the modelling uses three indicators of poverty, namely the percentage of the poor, the poverty gap index and the poverty severity index as the response variable modeled by allegedly influencing factors from the economic quality, human resources quality and health [11].
A study entitled Poverty Mapping of Regencies/Cities in Central Java in 2002 and 2010 using Cluster Analysis explains that in order to support the successful implementation of development programs, especially regarding to poverty reduction in Central Java, it needs to make regencies/cities grouping which have similar or homogeneous traits or characteristics of poverty. By comprehending the information about the characteristics or poverty profile of each group of regencies/cities in Central Java, it is expected that the government policy program can be well-organized based on the target or the target to be achieved [24].
A study conducted by SMERU Research Institute reveals a few things related to the condition of the inadequate livelihood assets of the poor and oppose the achievement of sustainable livelihoods [20].
In this study, it would be conducted the poverty data integrations with the spatial-based information as the modelling in executing local poverty reduction using Fuzzy Multi-Criteria Decision Analysis (MCDA) method, for instance, Geographic Information System (GIS) in the form of interactive maps or social maps. Thus, it can help policy makers to extend the assistance rightly on target.
Accordingly, the results of this research in general are expected to provide valuable contribution in local poverty reduction in order to assist the decision/policy makers in delivering government programs rightly on target for the poor and decreasing local poverty rate as well.
3.
Background Theory
are the most widely consumed by the poor. The total expenditure of these 52 commodities is about 70 percent of the total expenditure of the poor. Non-food poverty line (GKNM) is the minimum needs for housing, clothing, education and health. Commodity package of non-food basic needs represented by 51 kinds of commodities in urban areas and 47 kinds of commodities in rural areas [6]. According to BPS, poverty indicators are seen from the basic need approach. 3 indicators applied in poverty calculation comprise the poor percentage or headcount index (P0), poverty gap index (P1), poverty severity index (P2).
Fuzzy Multi Criteria Decision Making
(FMCDM) is a decision making method aimed to determine the best decision alternative from several alternatives based on the particular criteria that will be considered (Sari, 2008). The general options that will be applied in MCDM comprise [9] :
- Alternatives, i.e. different objects which have the same chance to be chosen by the decision makers.
- Attributes, or characteristics, i.e.
components or criteria of decision.
- Inter-criteria conflicts, for instance,
benefit criterion will experience conflict
with cost criterion. Benefit category is
monotonous rise, in which means the high-valued alternative is the most
chosen. Otherwise, cost category is
monotonous down, in which means the lower-valued alternative is more [9].
- Decision weighs, i.e. showing the
relative concerns of each criterion,
. namely poverty percentage (P0), poverty severity index (P1), and poverty gap index (P2).
Burrough defines GIS as a computer-based system applied to input, store, manage, analyze and reactivate the data containing spatial reference for many purposes related to mapping and planning [2].
Geographic Information System has some capabilities[14], namely:
- Mapping the position; the data of reality in the earth surface will be mapped into some layers in which each layer is the representation of the similar feature units. The layers are combined and adjusted the frequently mapped, i.e. something relates to amount, such as where the most and see which areas have higher concentration than the others. Density map is able to map. GIS can be used to predict the future condition and evaluate a policy as well. - Mapping what inside and outside an area;
GIS is also used to observe the occurrence and the decision taken by mapping what inside and outside an area.
4. Design
of
Geographic
Information System of Local Poverty
Reduction
Fig. 1 Reseach Methodology of Local Poverty Reduction System
The stages in this research consist of conducting inventory of the poor percentage data (P0), poverty gap index (P1) and poverty severity index of Central Java areas including 35 regencies/cities for 10 years as shown in Fig. 1. The following stage is determining category, rank and visualizing the poor areas in Central Java. The poor areas determination uses Fuzzy
method by determining Fuzzy number P0, P1, P2; then determining the interest rating for P0, P1, P2 and determining the compatibility rating of Fuzzy for each alternative afterwards. The next stage is sorting the poor areas; the poor areas in Central Java are visualized through spatial-based web. The inputted data on the system will be visualized as graphical-based in order to facilitate the reading by the user.
The architecture of Local Poverty Reduction System portrayed in Fig. 2, starting from the user perform a web request according to the required menu in which system responses through access to the database with view data from table or map.
Fig. 2 The Architecture of Local Poverty
Reduction System
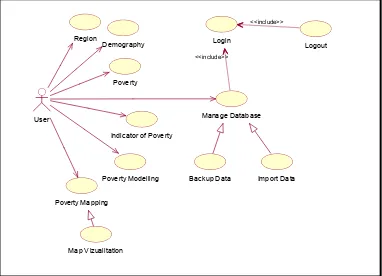
Process in the system is also visualized by using use case diagram to depict the occurrence in the system functionally; the visualization is between the actors and system. In use case diagram, specifically highlighted what is done by the system, not how the system works. This Local Poverty Reduction System employs a use case diagram. This system has general function for safety, master, modelling/mapping and report. The whole system of use case diagram can be seen in Fig. 3.
Fig. 3 Use Case Diagram of Local Poverty
Reduction System
According to Fig. 3, it can be noticed that the actor user or ordinary user are able to do these following matters:
- Accessing data and information about poverty in the modelled areas.
- Visualizing data in form of map for the dispersion and prediction of poverty displayed on the web browser page. - Displaying data in tables and graphs for
HCI-P0, PGI-P, and PSI-P2.
- Displaying data in tables and graphs for region poverty criteria (SR, R, C, T, ST).
Login
Logout
Import Data Backup Data Region
Demography
Poverty
Indicator of Poverty
Poverty Mapping Poverty Modelling
Map Vizualitation
User Manage Database
Likewise, the actor admin in Fig. 4 is described as follows:
- Registering new user.
- Managing roles user in the system. - Importing poverty data from MS EXCEL
file into Database.
- Having backup data by exporting data from database into MS EXCEL file.
5.
Experiments
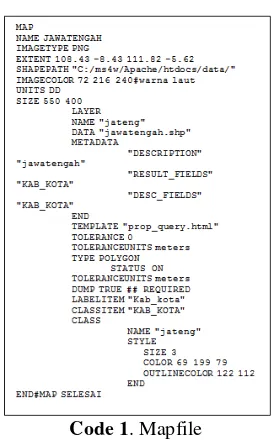
After implementing the design of Local Poverty Reduction System, the experiments for exploring the system performance are conducted. Fig. 4 is a map page preview, portraying Central Java map and its description. The map is generated from mapserver of which its interface is formed by using PHP/MapScript. The MapScript itself has a structure which does not work alone to make web-based GIS preview as requiring mapfile as the MapScript operating source to present the map and attribute inside.
Fig. 4 Demography Page
Code 1 illustrates a mapfile that will be used by mapscript in constructing a map. As shown in the picture, the mapfile depicts how to define a map layer. The file name, map color, map size and definitions of the arraying layers are depicted in the mapfile. The technique to create layers in MapServer is shown in mapfile as well. The file defines a layer named jawa tengah and the datum used in the layer is jawatengah.shp. The map attributes as map color, the applied label, map status and the applied map type are also defined. There is class in the map layer likewise. Class would be applied to give the map color.
Code 1. Mapfile
For determining and making rank of poor areas in Central Java with basic need approach, history data is required including population, percentage of the poor (P0), poverty gap index (P1) and poverty severity index (P2) to be processed by using fuzzy method. In Fig. 5, 35 regencies/cities in Central Java, population per regency/city, P0, P1 and P2 for the period from 2002 to 2010 are portrayed.
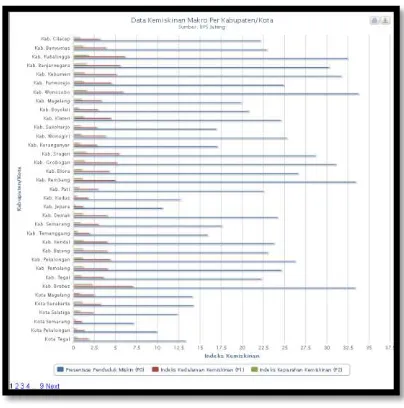
Fig. 5 Macro Poverty Indicator Table
Fig. 6 Macro Poverty Graph
The final result of GIS of Poverty Reduction is the spatial map of poor areas for 35 regencies/cities in Central Java as shown in Fig. 7. To facilitate user to figure out and recognize the poor areas in Central Java, the area visualization is distinguished by the color portraying the condition of each area. The red color indicates that the area is very poor; the poorer the condition is, the darker the color gradation will be. The yellow color denotes that the area is poor; the poorer the condition is, the darker the color gradation will be. The green color denotes that the area is not poor; the higher the economic level, the darker the color gradation will be visualized.
Fig. 7 Poverty Mapping
The analysis of macro economic data processing P0, P1 and P2 in given period from 2002 to 2010 using fuzzy method obtained the top 5 of the poor areas in Central Java, comprising Wonosobo, Kebumen, Brebes,
Rembang and Banjarnegara regencies. Besides, the output for the top 5 of the well-economic level areas comprises Semarang, Jepara, Salatiga, Pekalongan and Kudus. The result of system processing can be used as a reference for further action of Central Java government alongside the regencies/cities, for instance the follow-up to focus on development, especially the economic improvement in poor areas and the aid distribution can be achieved more properly on target.
In order to determine whether a system runs well, a testing is required. In system testing, the testing of the system was conducted in two ways, namely alpha testing and beta testing. Alpha testing is a self-conducted testing, whereas beta testing is a testing conducted by the others. The testing was conducted through performance analysis
intended to recognize the performance of web applications before going live on the internetwork. The result of performance analysis testing uses Web Applications Testing 5.0 software with 20 virtual user simulation. After the testing, the result was achieved as shown in Fig. 8
Fig. 8 Average response time graph
between 0,1 second and 1,0 second limit, that is 0,2 second. Therefore, the result is included to the tolerable limit.
Fig. 9 Error graph
The test result in Fig. 9 shows that from the available system, there is no error, as shown on the graph that the available error is 0 or there is no error.
6.
Conclusions and Future Work
The Local Poverty Reduction System is able to generate output of poor areas spatial map in Central Java. The spatial map can be applied easily since complemented with visualization of poor areas with color gradation-based which shows the local poverty rate. The system output of the top 5 of poor areas in Central Java comprises Wonosobo, Kebumen, Brebes, Rembang and Banjarnegara regencies. Likewise, the output of the top 5 of well economic rate areas comprises Semarang, Jepara, Salatiga, Pekalongan and Kudus.
Local Poverty Reduction System can be accomplished further by Central Java government associated with regencies/cities for instance, by focusing the local development especially the economic improvement of society in poor areas and the aid can be distributed more properly on target and capable of supporting to decrease the amount of poor areas in Central Java in the future.
Knowledge Management System Portal facilitates to manage any unexploited and explicit knowledge as the knowledge stored in digital form and more structured. The knowledge exploration and discovery are faster (realtime) as transmitted through the unlimited distance and time of internet network compatible with hardware specification variety (workstations) and transmission.
Further research can be improved by complementing any method to predict poor areas; with a minimum of 1 year forward
prediction, the provincial government and local government can prepare a targeted assistance program for the area which is predicted to be poor, thus its economic can be possibly raised to be free of poverty.
References
[1] Akinyemi. Felicia, “A Conceptual Poverty Mapping Data Model, Butare, Rwanda”, National University, Rwanda, 2010.
[2] Borough. Peter, and Rachael. A. McDonell,
“Principles of Geographic Information Systems”, New York : Oxford University Press Inc., 1998. [3] BPS, “Berita Resmi Statistik : Profil Kemiskinan
Di Indonesia pada September 2011”, No. 06/01/Th. XV, 2012.
[4] BPS, “Analisis dan Perhitungan Tingkat Kemiskinan 2008”, ISBN: 978-979-724-966-3, No. Publikasi : 07310.0804, Katalog BPS: 3205015, 2008.
[5] BPS Jateng, “Penduduk dan Tenaga Kerja”, Retrieved April 16, 2000, from http://jateng.bps.go.id/index.php?option=com_co ntent&view=section&id=15&Itemid=87. [6] BPS Kab. Lamandau, “Perhitungan Kemiskinan”,
Retrieved October 15, 2013, from http://lamandaukab.bps.go.id/index.php/layanan/a rtikel-umum/89-penghitungan-kemiskinan-bps-dan-bank-dunia.
[7] Cahyat. Ade, “Bagaimana Kemiskinan Diukur ? Beberapa Model Pengukuran Kemiskinan Di Indonesia”, Governance Brief : Poverty & Decentralization Project, 2004.
[8] Departement for Communities and Local Government, “Multi-Criteria Analysis : a manual”, London, 2009.
[9] Kusumadewi. Sri, “Fuzzy Multi Atribut Decision Making (Fuzzy MADM)”, Yogyakarta : Graha Ilmu, 2006.
[10] ORACLE Think Quest, “a Dollar a Day – finding solution to poverty : Absoulute Poverty”, Retrieved October 15, 2012, from http://library.thinkquest.org/05aug/00282/over_ whatis.htm.
[11] Pintowati. Wahyuning and Otok. Bambang Widjanarko, “Pemodelan Kemiskinan di Provinsi Jawa Timur dengan Pendekatan Multivariative Adaptive”, FMIPA, Surabaya : Institut Teknologi Sepuluh Nopember (ITS), 2012.
[12] Powell. Thomas, Website Engineering, Prentice Hall, 1998.
[14] Prasetyo. Daniel, “Sistem Informasi Geografis (SIG) untuk Tata Guna Lahan", Retrieved April 16, 2013, from http://www.ilmukomputer.com. [15] Ravallion. Martin, “Poverty Lines in Theory and Practice : Living Standards Measurement Study”, World Bank : Working Paper No. 13, 1998.
[16] Remi. Sutyastie Soemitro and Tjiptoherijanto. Prijono, “Kemiskinan dan Ketidakmerataan di Indonesia”, Jakarta : Rineka Cipta Press, 2002. [17] Saptana. Tri Pranadji, Syahyuti, and
Roosgandha, “Transformasi Kelembagaan Tradisional Untuk Menunjang Ekonomi Kerakyatan di Pedesaan (Studi Kasus di Provinsi Bali dan Bengkulu)”, Riset Center and Developing Social Economic Agriculture, 2003.
[18] Sari H. Dillah, “Perbandingan Metode Electre”, GPAP, MCDM Expert System, 2008.
[19] Sholeh. Maimun, “Kemiskinan : Telah dan Beberapa Strategi Penanggulangannya”, Social and Economic Faculty, Universitas Negeri Yogyakarta.
[20] SMERU, “Mengintegrasikan Aspek Spasial Kemiskinan ke dalam Perencanaan Spasial Perkotaan : Solusi untuk Mengatasi Kemiskinan Perkotaan”, Catatan Kebijakan No. 1/2012, 2012.
[21] Sumodiningrat. Gunawan, “Membangun Perekonomian Rakyat”, Yogyakarta : Pustaka Pelajar, 1998.
[22] Suryahadi. Asep and Sumarto, “Memahami Kemiskinan Kronis dan Kemiskinan Sementara di Indonesia“, SMERU Newsletter, 2001. [23] Suyanto. Bagong, “Perangkap Kemiskinan :
Problem & Strategi Pengentasannya”, Surabaya : Airlangga University Press, 1995.
[24] Widiastuti. Minawati and A. G. Yusuf. Edy,
“Pemetaan Kemiskinan Kabupaten/Kota di Provinsi Jawa Tengah Tahun 2002 dan 2010 Menggunakan Analisis Klaster”, Economic and Bussines Faculty, Universitas Diponegoro, Semarang.
[25] Widiatmoko. Yudha and Wahid. Fathul,
“Aplikasi Web Data Spasial Kependudukan Indonesia dengan Scalable Vector Graphics (SVG)”, Fakultas Teknologi Industri, Universitas Islam Indonesia, Yogyakarta, 2006.
Hartomo Kristoko, Received is B.Sc. at Informatics Engineering from the Duta Wacana Christian University Yogyakarta Indonesia. Received is Master
degree at Computer Science at Faculty of
Mathematics and Natural Sciences from the Gadjah Mada University Yogyakarta Indonesia.He is student Doctoral Program Computer Science at Faculty of Mathematics and Natural Sciences from the Gadjah Mada University Yogyakarta Indonesia. He is currently a lecturer in the Informatic Engineering Department, Faculty of Information Technology, Satya Wacana Christian University Salatiga Indonesia. His current research interests include spatial Modeling, GIS, database, data mining and their applications.
Wowor Danny, Received is B.Sc. at Biology from the Satya Wacana Christian University Salatiga Indonesia in 2005. Received is Master degree at Education Management from the Satya Wacana Christian University Salatiga Indonesia in 2009. He is currently a lecturer in the Informatics Engineering Department, Faculty of Information Technology, Satya Wacana Christian University Salatiga Indonesia. His current research interests include spatial statistic and mathematics modeling.
Trihandaru Suryasatriya, Received is B.Sc. at Physics at Faculty of Mathematics and Natural Sciences from Gadjah Mada University Yogyakarta Indonesia in 1993. Received is Master degree at
industrial mathematics from Universitaet
Kaiserslautern Germany in 1998. He is Ph.D at mathematics from the Bandung Technology Institute Bandung Indonesia in 2005. He is currently a lecturer in the Faculty of Mathematics and Natural Sciences, Satya Wacana Christian University Salatiga Indonesia. His current research interests include mathematics modeling and their applications.