T H E J O U R N A L O F H U M A N R E S O U R C E S • 46 • 1
What’s in a Picture?
Evidence of Discrimination from Prosper.com
Devin G. Pope
Justin R. Sydnor
A B S T R A C T
We find evidence of significant racial disparities in a new type of credit market known as peer-to-peer lending. Loan listings with blacks in the at-tached picture are 25 to 35 percent less likely to receive funding than those of whites with similar credit profiles. Despite the higher average in-terest rates charged to blacks, lenders making such loans earn a lower net return compared to loans made to whites with similar credit profiles be-cause blacks have higher relative default rates. These results provide in-sight into whether the discrimination we find is taste-based or statistical.
I. Introduction
There is a long history within economics of studies attempting to understand discrimination in a variety of markets. Much of this interest stems from concerns that because of discrimination, certain groups— for example, blacks and women—may not enjoy the same access to markets and opportunities as their coun-terparts. Theories of discrimination usually fall into one of two classes: statistical discrimination (Phelps 1972; Arrow 1973) or taste-based discrimination (Becker 1957).1Accurate statistical discrimination is economically efficient for the decision maker, while taste-based discrimination stems from an animus toward one group and is often costly to the decision-maker. Because costly discrimination may be driven out of competitive markets, and because these different theories often lead to different policy recommendations, understanding the extent to which observed
Devin Pope is an assistant professor at the Wharton School, University of Pennsylvania. Justin Sydnor is an assistant professor of economics at Case Western Reserve University. The authors thank David Card, David Clingingsmith, Stefano DellaVigna, Jonathan Guryan, Erzo Luttmer, Nicola Persico, Jim Rebitzer, Stephen L Ross, Heather Royer, Jonathan Skinner, Nick Souleles, Betsey Stevenson, Justin Wolfers, and seminar participants at the NBER Summer Institute, Case Western Reserve University, and the University of Pennsylvania for helpful comments and suggestions. The data in this article are avail-able from the authors from August 2011 through July 2014.
[Submitted April 2009; accepted November 2009]
discrimination is consistent with these theories is an important goal. However, it is often difficult to test for discrimination in markets2 and generally even harder to assess the different theories of discrimination.3
This paper examines discrimination in a new type of credit market known as peer-to-peer lending. Specifically, we study data from the website Prosper.com, a leader in online peer-to-peer lending in the United States. Peer-to-peer lending is an alter-native credit market that allows individual borrowers and lenders to engage in credit transactions without traditional banking intermediaries. While still small, these mar-kets are growing quickly and may represent an important niche, especially in the area of consumer-debt consolidation.4 Websites like Prosper aggregate small amounts of money provided by a number of individual lenders to create moderately sized, uncollateralized loans to individual borrowers. In order to request funding, borrowers in these markets create a loan listing that resembles auction listings for goods on websites like eBay. Like most standard credit applications, this listing displays desired loan parameters and reports information from the prospective bor-rower’s credit profile. Unlike typical credit applications, however, borrowers may include optional and unverified personal information in their listings in the form of pictures and text descriptions. These pictures and descriptions often provide potential lenders with signals about characteristics such as race, age, and gender that antidis-crimination laws typically prevent traditional lending institutions from using.
Our first research question focuses on the determinants of access to credit in the Prosper marketplace, and in particular on how signals from pictures about charac-teristics, such as race, age, and gender, affect the likelihood of receiving loan funding and the interest rates borrowers pay. In the language of the legal literature we test for “disparate treatment” of certain groups by estimating whether they are treated differently than their counterparts who are similar on other dimensions.5 Our em-pirical approach uses observational market data.6The typical problem with this type of analysis is the potential for omitted variable bias.7An advantage of our data set
2. See Altonji and Blank (1999) and Blank, Dabady, and Citro (2004) for reviews of empirical work on assessing discrimination in labor markets, and Ross and Yinger (2002) for a similar review in credit markets with a focus on mortgage lending.
3. A few notable papers that have used clever empirical methodologies to examine statistical discrimination vs. taste-based discrimination include Altonji and Pierret (2001), Knowles, Persico, and Todd (2001), Levitt (2004), Antonovics and Knight (2004), and Charles and Guryan (2007).
4. See Freedman and Jin (2008) for an analysis of the evolution of the Prosper market and the profitability of loans on Prosper.
5. The other important definition within the legal literature is “disparate impact,” which arises when de-cision-makers do not explicitly account for characteristics such as race and gender, but use variables that are highly correlated with these characteristics. See Ross and Yinger (2002) for a discussion of disparate treatment vs. disparate impact with a focus on discrimination in credit markets.
6. This observational-market-data approach is similar to that used in the influential studies of redlining and racial discrimination in mortgage lending by the Boston Federal Reserve (Munnell, Tootell, Browne; McEneaney 1996; and Tootell 1996).
Pope and Sydnor 55
is that we are able to control for nearly all of what a lender knows about a borrower when making funding decisions. Prosper.com generously provides a data set that contains information from loan listings created on the site, including links to pictures included with the listings. In order to conduct the analysis, we systematically coded variables from pictures and text descriptions for over 110,000 loan listings that were created on Prosper.com between June 2006 and May 2007.
The empirical analysis reveals significant racial discrimination in this market. Compared to the response to otherwise similar whites, we estimate that listings with blacks in the picture are 2.4–3.2 percentage points less likely to be funded. Compared to the average probability of funding, 9.3 percent, this represents an approximately 30 percent reduction in the likelihood of receiving funding. A range of specifications and numerous robustness checks and alternative cuts of the data reveal very stable effects of race on the likelihood of funding. This discrimination against blacks in the lending decision is also reflected in the interest rates these borrowers pay con-ditional on receiving a loan; their interest rates are 60–80 basis points higher than those of whites with similar credit profiles.
While smaller and less robust than the results for race, we find a number of other interesting market responses to the information in pictures and text. For instance, the market discriminates somewhat against the elderly and significantly overweight, but in favor of women and those that signal military involvement. The market also favors listings where the borrower expresses a desire to pay down credit-card debt (the most popular stated loan purpose) over credit requests for other purposes, such as loans for business expansions or automotive repairs/purchases.
It is perhaps somewhat surprising that we find evidence of discrimination in this market. Because the pictures and descriptions are optional and unverifiable, a natural prediction would be that the market would respond little to this type of “cheap talk.” Yet the fact that borrowers include a wide variety of pictures and the market re-sponds to those signals, suggests that the information is not treated as cheap talk in the market. In fact, we find the Prosper market responds negatively to listings that do not include a picture. Another reason that the finding of racial discrimination might be somewhat surprising is that lenders are given a wide range of information about each borrower’s credit profile, including credit grade, debt-to-income ratio, and a measure of income. However, we find that lenders respond to signals about race above and beyond this wealth of credit information.
Given that we find discrimination in this market, an obvious question is whether this discrimination is efficient for lenders—in other words, are these differences consistent with lenders engaging in accurate and economically efficient statistical discrimination? Because of the availability of data and the nature of the market, we
can address this question using loan-performance data.8 A unique feature of the Prosper market is that it operates as an auction that allows interest rates to be bid down below an initial rate set by the borrower, if enough lenders find a loan attrac-tive. The basic intuition behind the analysis, then, is that if lenders care only about the net return of a loan (adjusted for expected default), funds will flow to loans that are attractive given the observable information to lenders. This process should adjust their interest rates and equalize expected returns. If the market correctly incorporates characteristics from pictures and text when assessing creditworthiness, accurate sta-tistical discrimination will result in funded loans that have equal average net returns irrespective of the listing characteristics. On the other hand, if taste-based discrim-ination is the sole cause of disparate treatment in the market, loans made to the group subject to negative discrimination should have higher net returns ex post.
The comparison of the net return on loans made to blacks and otherwise similar whites is striking. The estimated average net return on a dollar from investing in a loan from a black borrower is 7.3–8.6 percentage points lower over a three-year period. Although blacks are discriminated against in the lending process, the higher interest rates that they pay are not enough to account for their greater propensity to default. This runs counter to the predictions ofbothaccurate statistical discrimination (equal net returns) and taste-based animus against blacks (higher net returns on loans to blacks).9
How can we reconcile the evidence of discrimination against blacks in the lending process with the fact that their loans result in lower net returns? The evidence is consistent with a combination of accurate statistical discrimination against blacks coupled with taste-based discrimination against whites. But such an interpretation runs counter to intuition and to previous literature, which rarely concludes that there is a taste-based preference against whites. We discuss the interpretation of these results in detail at the end of the paper. Perhaps the most likely interpretation is that lenders understand the correlations between race and important characteristics for predicting default that they cannot perfectly observe, such as education and
social-8. Exploring theories of discrimination—statistical discrimination vs. taste-based discrimination —is gen-erally quite difficult. In many settings there is no ex-post performance data available. Even when perfor-mance data is available, it may not be informative because decisionmakers use a threshold cutoff for decisions such as loan approval. For example, see the critiques of the use of default analysis to assess theories of discrimination in mortgage lending that appeared in the May, 1996 edition of Cityscape, es-pecially articles by John Yinger, George Galster, Stephen Ross, and John Quigley.
Pope and Sydnor 57
support networks, but they fail to fully appreciate the strength of these correlations or the importance of these unobservable factors in predicting default.
The remainder of the paper proceeds as follows: Section I describes peer-to-peer lending and the dynamics of the Prosper marketplace. Section II describes the data made available by Prosper.com and our process for coding information from pictures and text. Section III presents our empirical results, focusing first on the probability of obtaining a successful loan and then turning to estimates of the net return (to lenders) of loans made to different groups. We conclude the paper in Section IV with a discussion of the interpretation of our results and their relationship to and implications for the literature on theories of discrimination.
II. Institutional Background of Online Peer-to-Peer
Lending
Online peer-to-peer lending encompasses a range of new and ex-panding markets that allow individual borrowers and lenders to engage in credit transactions without traditional intermediaries such as banks. These markets are small but growing quickly: The U.S. peer-to-peer market grew from an estimated $269 million in outstanding loans in 2006 to $647 million in 2007.10
Part of the appeal of peer-to-peer lending is that it offers lower overhead and the ability to cut out the bank or “middle man.” Of course, there are many reasons why banks and other credit agencies have historically been the primary source for per-sonal loans. Prosper has addressed some of the most important advantages of tra-ditional lending institutions, including enabling individuals to diversify their peer-to-peer lending portfolio and providing individuals the sort of credit-profile information that until recently has been the purview of banks and other large lenders. Naturally, it is questionable whether individuals have the sophistication and training to make efficient use of this credit information in the way banks can. On the other hand, peer-to-peer markets provide lenders with a wealth of personal and contextual information about borrowers that traditional intermediaries do not use and are often explicitly barred from using by anti discrimination laws. This extra information may be a source of advantage for peer-to-peer markets. Ultimately, because they are so new, it is still too early to know whether peer-to-peer credit markets will actually succeed, but they are an intriguing alternative to traditional credit markets and are attracting both borrowers and lenders.
Details of Prosper.com
Our analysis focuses on the Prosper.com marketplace. Started in February, 2006, Prosper is somewhat similar to auction sites such as eBay, except that instead of bidding on or listing a consumer item, individuals bid on or list personal loans. All
loans in this market are uncollateralized and have three-year terms with a fixed repayment schedule. Individuals wishing to borrow money create a listing that lasts for a prespecified length of time, usually between seven and 14 days. The listing includes the amount of money requested (up to $25,000), the maximum interest rate the borrower is willing to pay, credit information obtained by Prosper via a credit check, and voluntarily provided (and unverified) information, such as pictures and descriptions of what they plan to do with the money. Lenders browse the various listings and bid on specific loans by committing a portion of the principal (minimum of $50) and setting the lowest interest rate at which they are willing to provide those funds. The loan gets funded if and only if the total amount of money bid by lenders covers the size of the requested loan. Lenders get priority for the loan based on the minimum interest rate they are willing to accept, with low-rate bids getting higher priority. If enough lenders bid on the loan, the final interest rate on the loan can be bid down from the maximum interest rate initially set by the borrower; the final rate is determined by the lowest reservation rate set by a bidder who does not get to fund a portion of the loan.11Prosper makes money by charging closing costs of 1– 2 percent of the loan amount to borrowers and 0.5–1 percent to lenders.
An example may help clarify the market dynamics. Imagine that a borrower re-quests a $5,000 loan and is willing to pay a maximum annual interest rate of 10 percent. For simplicity, assume that all potential lenders will bid the minimum fund-ing size of $50. It then takes 100 lenders to fund the $5,000 loan. Each of these lenders enters a reservation interest rate when they bid, which is the lowest interest rate they are willing to accept. If there are exactly 100 lender bids, the $5,000 loan will fund at an interest rate of 10 percent. However, if more than 100 lenders bid on the loan, the final interest rate would be determined by the 101st lowest reser-vation interest rate. The 100 bidders with the lowest reserreser-vation interest rates would each provide $50 for the loan and would be entitled to 1/100th of the repayments made by the borrower over the three-year term.
Substantial information is available to individuals who are interested in bidding on loans. Lenders see the parameters of the loan: its size, the ending time of the listing, the total amount that has been funded through bids by other lenders, the history of bids on the listing, and the current interest rate, which is either the max-imum rate the borrower will accept or (for fully funded loans) the rate to which the loan has been bid down. Other than these loan parameters, perhaps the most im-portant information available to lenders is a credit profile for each borrower obtained by Prosper through a standard credit check. Prosper obtains an Experian credit score and provides lenders with a credit grade (for example, AA or B) for each borrower using bins of credit score.12 The cutoffs for the different credit grades are found
11. Although we (and Prosper) use the term “lenders” to refer to the individuals making bids for the loan, technically speaking the loan contract is between the borrower and Prosper. So borrowers do not have to make separate repayments to each lender, but rather simply repay Prosper based on the final interest rate for their loan. Prosper allocates the repayments to the individual lenders based on the portion of the loan funds they provided.
Pope and Sydnor 59
easily on the Prosper website, but lenders do not see borrowers’ exact credit scores. Lenders also see a host of other information commonly found on credit reports, including delinquencies, revolving credit balance, and bank-card utilization.13 Po-tential borrowers also supply information about their employment status, occupation (chosen from a list), and income. The income borrowers report is also used by Prosper to create a debt-to-income ratio that is prominently displayed on the listing pages. This debt-to-income ratio is calculated by dividing the borrower’s self-reported income by his or her debt burden (excluding housing) as self-reported by the credit check, and includes the value of the Prosper loan the borrower is requesting. Prosper does not verify the employment, occupation, and income information when loan listings are created, but does verify this information for some borrowers once the loan becomes fully funded and before the money is disbursed. Lenders are also provided with an indicator for whether the borrower is a homeowner or not.
In addition to this financial information borrowers can include supplemental ma-terial in their listing consisting of: (a) a picture with their listing, (b) a one-line description for the loan, and (c) a separate longer description, where borrowers are encouraged (by Prosper) to describe what they plan to do with the money and why lenders should consider their request. None of the information in these pictures or descriptions is verified by Prosper or verifiable by lenders.
Prosper also incorporates additional social components through the use of bor-rower (and lender) groups. Borbor-rower groups are generally organized around some sort of theme (for example, alumni of a particular university) and include a rating. The group rating is affected by the repayment activities of its members so that group membership provides extra social pressure to repay loans.
Other than social pressure and conscience, the primary incentive for a borrower to repay the uncollateralized loan is the impact that default can have on the bor-rower’s credit. If a borrower fails to repay the loan, Prosper reports the default to the credit-scoring agencies and turns the loan over to a collection agency that at-tempts to recover some money.14 Ultimately the penalties to a borrower from de-faulting on a loan in this market are similar to those of failing to repay a credit card.
III. Data
A. Data Overview
Prosper.com generously makes its data available to academics and prospective lend-ers. Data are available for every loan listing since the inception of the website. The data include all of the information seen by lenders when they make their lending decisions, as well as the outcome of the listing (funded or not). Demographic and other information about lenders is not available.
13. Additional information in the credit profile includes the numbers of public records in the last year and last ten years, the number of inquiries in the last six months, the date of the borrower’s first credit line, and the numbers of current, open, and total credit lines.
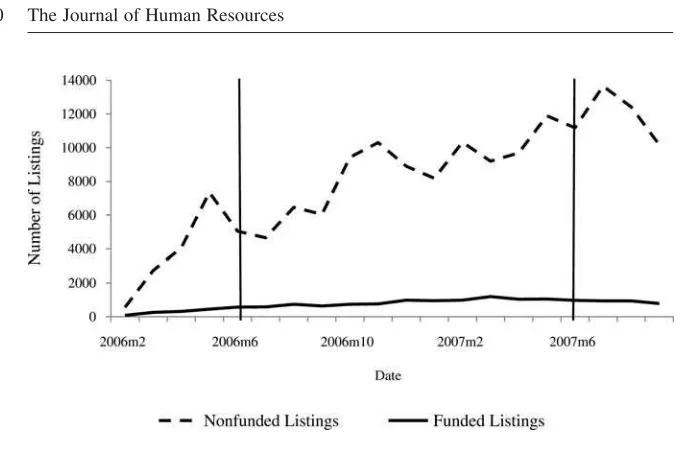
Figure 1
Total Listings Across Time by Funded Status
Notes: This figure illustrates monthly counts of the total number of listings and the total number of listings that were eventually funded on Prosper.com since the company went public in February 2006. The loan listings that we analyze in this study come from the one-year period between June 2006 and May 2007. These dates are indicated by the vertical lines.
Figure 1 graphs the number of requested loan listings made on the website over time. The number of listings grew quickly after Prosper’s official launch in February, 2006, reaching 5,000 requested loans per month by May, 2006 and rising to over 10,000 listings per month by January, 2007. The number of loans that actually get funded, however, has risen much more slowly. Of the 203,917 loans requested be-tween February, 2006 and November, 2007, 16,395 were funded (8.04 percent), with lenders providing a total of $101,913,173 in funds (mean $6,216 per loan) to borrowers. The large number of loan requests that go unfunded motivates our interest in understanding how the market chooses which loans to fund.
Pope and Sydnor 61
rate (after bid down) of 18 percent. It is also worth noting that 43 percent of loans are specified as loans that “fund immediately.” Rather than letting lenders bid down the interest rate, borrowers of these loans request that the loan is processed as soon as funding is available at the initial interest rate that was specified.
B. Credit Data
Prosper uses eight credit grades in their credit-scoring process. The majority (54 percent) of the requested loans are made by individuals who fall into Prosper’s “high risk” (HR) credit grade with credit scores from 520–59. Listings with these credit grades are less likely to fund, however, and represent only 20 percent of the funded listings. Listings from individuals with the best credit grades (AA and A), who have credit scores above 720, each make up 3 percent of the total listings, but are more likely to fund and make up 10 percent and 9 percent of the funded listings, respec-tively. The average debt-to-income (DTI) ratio of 63 percent for those requesting loans also confirms the poor credit situation of the typical prospective borrower. Those who actually get loans are in a better financial situation, but still have rather high average DTI at 39 percent.
C. Coded Data from Pictures and Text
To obtain data from pictures and descriptions, we employed a number of under-graduate research assistants to systematically code up the information in the bor-rower’s picture (if included) and the borbor-rower’s one-line description of the loan for all 110,333 loan listings on Prosper during the sample year. These assistants were paid a simple piece-rate per listing, and were informed that we would randomly check approximately 10 percent of their entries for accuracy. On the rare occasion that one of the coders made a large number of errors, he or she was asked to redo the coding and was not paid until a thorough accuracy check was performed. The coders were not told about the underlying hypotheses of the research, and impor-tantly did not see any of the parameters of the loan listing other than the picture and one-line description while coding.15
The coders used the text descriptions to classify the purpose of the loan. This categorization provides an interesting picture of why borrowers are asking for money on Prosper.com. The categories for these purposes are listed in Table 1 and were chosen as the most frequent and important categories after a review of 750 loan listings. Around 30 percent of the listings used a description that stated the purpose of the loan as being some form of debt consolidation (for example, “consolidating credit card debt,” “pay down debt,” and “paying off credit cards”). This is consistent with media reports that often stress the potential value of the peer-to-peer credit market as a way out of credit-card debt. Another popular category (10 percent of all listings) is business or entrepreneurship loans (for example, “expanding my suc-cessful small business,” “a new truck for landscaping business”). Smaller percent-ages communicated that they needed money for education expenses (3 percent), medical/funeral expenses (3 percent), home repairs (2 percent), automobile purchases
The
Journal
of
Human
Resources
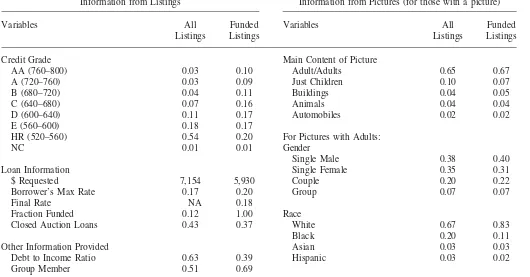
Table 1
Summary Statistics
Information from Listings Information from Pictures (for those with a picture)
Variables All
Listings
Funded Listings
Variables All Listings
Funded Listings
Credit Grade Main Content of Picture
AA (760–800) 0.03 0.10 Adult/Adults 0.65 0.67 A (720–760) 0.03 0.09 Just Children 0.10 0.07 B (680–720) 0.04 0.11 Buildings 0.04 0.05 C (640–680) 0.07 0.16 Animals 0.04 0.04 D (600–640) 0.11 0.17 Automobiles 0.02 0.02 E (560–600) 0.18 0.17
HR (520–560) 0.54 0.20 For Pictures with Adults:
NC 0.01 0.01 Gender
Single Male 0.38 0.40 Loan Information Single Female 0.35 0.31 $ Requested 7,154 5,930 Couple 0.20 0.22 Borrower’s Max Rate 0.17 0.20 Group 0.07 0.07 Final Rate NA 0.18
Fraction Funded 0.12 1.00 Race
Closed Auction Loans 0.43 0.37 White 0.67 0.83
Black 0.20 0.11
Pope
and
Sydnor
63
Owns a Home 0.27 0.39 Age
Provided a Picture 0.46 0.64 Less than 35 yrs 0.53 0.54 35–60 yrs 0.41 0.41 Information Coded From Descriptions: More than 60 yrs 0.02 0.02 Purpose of Loan Happiness
Consolidate or Pay Debt 0.30 0.33 Happy 0.74 0.77 Business/Entrepreneurship 0.10 0.10 Neutral 0.23 0.21
Pay Bills 0.04 0.02 Unhappy 0.01 0.01
Education Expenses 0.03 0.03
Medical/Funeral Expenses 0.03 0.02 Weight
Home Repairs 0.02 0.03 Not Overweight 0.73 0.75 Auto Purchase 0.02 0.02 Somewhat Overweight 0.20 0.18 Home/Land Purchase 0.02 0.02 Very Overweight 0.03 0.02 Auto Repairs 0.01 0.01
Luxury Item Purchase 0.01 0.01 Attractiveness
Wedding 0.01 0.01 Very Attractive 0.05 0.06 Reinvest in Prosper 0.01 0.02 Average 0.91 0.91 Taxes 0.01 0.01 Very Unattractive 0.03 0.02 Vacation or Trip 0.01 0.01
Multiple of Above Reasons 0.06 0.05 Other
Unclear/Other 0.34 0.33 Profesionally Dressed 0.13 0.14 Child Also in Picture 0.21 0.21 Signs of Military Involvement 0.02 0.02 Observations 110,333 10,207 50,820 6,571
(2 percent), automobile repairs (1 percent), or to pay back taxes (1 percent). A sizeable number of listings (34 percent) did not fall into these main categories (for example, “need help”) and were coded under a category of unclear/other.16 Inter-estingly, and in contrast to the financial information, the distribution of loan purpose is quite similar between the funded listings and the full sample of listings, suggesting that the stated purpose of the loan is not a particularly important determinant of loan funding.
We hand-coded only the text in the one-line description and not in the longer description that borrower’s provide with their loan. The costs to hand-coding infor-mation from these longer descriptions were simply prohibitive. Instead we ran the longer text descriptions through a simple text-analysis program that outputs the num-ber of characters, words, and sentences in the text, an index of readability based on the average word-length and average sentence-length, and the percent of words that are misspelled.17These text-analysis variables are slightly correlated with measures of creditworthiness and picture characteristics,18and we include controls for them throughout our analysis.
Turning to the pictures, Table 1 reveals that less than half (46 percent) of all loan listings included a picture. However, the market seems to value the pictures, as 64 percent of the funded listings contained a picture. There is an incredible diversity of pictures on the Prosper site, ranging from earnest looking couples, to dogs wearing antlers, to pictures of nature scenery, and the occasional bikini-clad young woman. Among listings with pictures, 65 percent included one or more adults as the central focus of the picture, and 21 percent included both adults and children. Another 10 percent were pictures of just children without adults. A sizeable (though smaller) fraction of pictures contained no people, including 4 percent that were primarily of a building (for example, a home or storefront), 4 percent primarily picturing animals (for example, pet dog), and 2 percent picturing an automobile.
For pictures that included adults, coders were instructed to code a number of perceived characteristics. These include, gender, race, age, happiness, weight, and attractiveness. We also included categories of secondary interest, such as whether the people were professionally dressed or displayed signs of military involvement.19
16. Approximately 6 percent of listings included multiple reasons for wanting the loan within their de-scriptions (for example, “pay off a car loan and attend a family reunion”), and we coded these multiple-purpose listings under a separate category.
17. The one-line descriptions may be a more first-order influence on the lending decision than the longer descriptions. When prospective lenders browse loan listings, they first see a large page of listings (similar to a results page on Ebay), on which listings can be sorted or limited by a number of criteria. On this initial page, lenders see: a) the loan parameters (size, current interest rate, percent of the requested loan that has been funded, and the number of bids), b) credit grade and DTI, c) a picture (if provided by borrower), and d) the borrowers one-line loan description. Thus, the picture and the one-line description are the information that lenders have when deciding which of the roughly 4,000 listings active at any one time to look at in detail.
Pope and Sydnor 65
The right-hand side of Table 1 gives summary statistics for the information coded from the pictures. Looking first at gender, there is a rough balance between men and women in the genders displayed in the loan listings. Of the pictures with people, pictures of single males make up 38 percent of the full sample and 40 percent of the funded listings. The analogous figures for females are 35 percent and 31 percent, and for male-female couples are 20 percent and 22 percent. The coders also recorded the perceived race of the people pictured, using the primary categories of white/ Caucasian, black/African American, Hispanic/Latino, and Asian.20The majority, 67 percent, appear to be white, while 20 percent are coded as black, 3 percent as Hispanic, and 3 percent as Asian.21 Looking at the listings that actually funded reveals that (unconditionally) minorities are much less likely than whites to receive loans on Prosper—83 percent of the funded listings with adult pictures were of apparently white individuals. The patterns for age, weight, and the secondary char-acteristics are all sensible and reveal relatively little difference between the full sample of listings and the listings that fund.
Comparing the distributions of these variables between the full sample of listings and the funded listings suggests that the market: (1) favors pictures of whites over minorities by a significant margin, (2) modestly favors pictures of men over women, of happy people over unhappy people, and thin people over overweight people, and (3) does not react very strongly to the stated purpose of the loan. Of course, since these characteristics may be highly correlated with other financial characteristics, the summary statistics could be misleading.
IV. Empirical Results
A. Probability of Funding
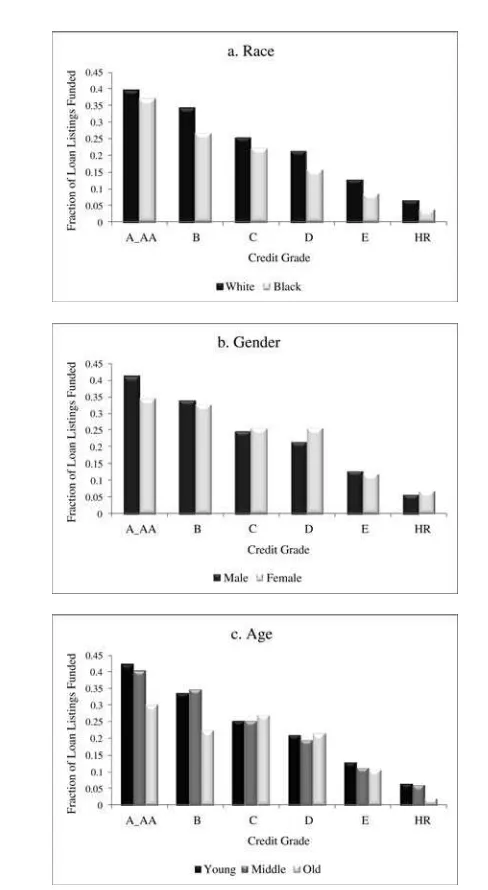
In this section we investigate how the information contained in pictures and descrip-tions affects the probability of funding holding all else equal. The summary statistics in Table 1 provided the first hint that disparate treatment may exist in funding decisions. Figure 2 provides additional suggestive evidence. Figure 2a illustrates the funding rate by each credit grade by white and black borrowers. Two main findings can be taken from this figure. High-credit grade borrowers are more likely to be funded than low-credit grade borrowers, and whites are more likely to be funded than blacks at every credit grade. Figure 2b and 2c are less conclusive, but suggest that females may be more likely to be funded than males (especially at lower credit grades) and that older borrowers are less likely to be funded than younger borrowers. As always, the challenge here is to overcome problems associated with omitted-variable bias so that our estimates can reasonably be interpreted as the market
re-20. These codings may not always agree with the race the borrower would list for him or herself if asked; however, it is the perception of race as conveyed through the pictures and not the actual race of borrowers that may affect lenders’ decisions.
Figure 2
Fraction of Listings Funded by Credit Grade and Demographics
Pope and Sydnor 67
sponse to the information provided by borrowers. Fortunately, the Prosper data are ideally suited to help with this type of analysis. While there will always be aspects of a loan listing for which we are unable to control (for example certain aspects of the picture that were not coded), the percent of information available to lenders for which we can control is much higher in this setting than in most other studies of credit markets. Further, the stability of our results across various specifications and robustness checks lends credibility to our identification strategy.
Our basic empirical strategy involves estimating the probability that a loan listing gets funded as a function of the listing characteristics that are observed by the lenders. We use both linear probability models, estimated via OLS, and Logit re-gressions. The basic linear regression framework is:
Y⳱␣ⳭXⳭZⳭε,
(1) i i i i
where Yiis an indicator variable for whether or not listing i was funded, Xi is a matrix of characteristics coded from the pictures and one-line description of the purpose of each loan, and Ziis a matrix of other characteristics of the listing and borrower, including credit controls and loan parameters. The regressions are esti-mated over the full sample of 110,333 listings made during the one-year sample period. Because many borrowers relist their requests when their listings expire with-out funding (generally with higher maximum interest rates), we cluster at the bor-rower level to obtain standard errors.
1. Baseline Regression Estimates
Our baseline regression specification includes indicators for the characteristics coded from pictures and text along with a large set of flexible controls for the other pa-rameters of the loan listing. These controls (Zi) include credit grade crossed with a cubic of the maximum interest rate the borrower set, a cubic of the size of the requested loan, the duration of the loan listing, the log of self-reported income, and a cubic of DTI. The other variables from a borrower’s credit profile available to lenders are: number of current delinquencies, delinquencies in the last seven years, total number of credit lines, total number of open credit lines, number of inquiries in the last six months, revolving credit balance, and bank card utilization. These variables are included in the regressions in log form.22 We also include dummy variables for homeownership status, occupation type, employment status, whether the borrower was a member of a group, and the rating (one to five stars) of the group. Additionally, we include variables created using our text analysis from the long-description: the log number of total characters, a readability index (which uses word and sentence length), and the percent of words which are misspelled. Finally, since this is an evolving market and one that can be affected by fluctuations in the overall economy, we include month dummies to capture time effects unrelated to specific listing parameters. The estimated coefficients on credit and loan-parameter controls ( ) are sensible and unsurprising and generally highly statistically signifi-˜
cant. Because these variables enter the regression nonlinearly or with interaction
effects and due to space constraints, we do not report the coefficients here. However, later we discuss a robustness table that shows estimates for some of these variables from a simpler linear specification.
Table 2 shows the coefficient estimates for the variables we coded from the pic-tures and descriptions ( ). Columns 1 and 3 display the results using OLS and˜
Columns 2 and 4 display the Logit results as the marginal effects of the variables on the probability of funding. For each of the categories listed in the table, we have also listed the base-group on which the coefficient estimates are based. In order to use all of the available data in our regressions, we included dummy variables to indicate when a listing had no picture or a picture without people in it. The coef-ficients on these dummies are not reported in the table, because they depend on the base-groups chosen for the race, gender, age, and other controls. However, in a similar regression that includes the same credit controls, but codes only for whether or not a listing had a picture, we find that listings without pictures are approximately three percentage points less likely to fund.
Consistent with the raw summary statistics, the largest effects of the picture char-acteristics are for race. The OLS estimates imply that listings with a picture of an apparently black or African American person are 3.2 percentage points less likely to get funded than an equivalent listing with a picture of a white person. Relative to the overall average funding rate of 9.3 percent, this is a 34 percent drop in the likelihood of funding. The marginal effects from the Logit regression imply a slightly smaller but still economically meaningful difference of 2.4 percentage points. Both estimates are statistically significant at the 1 percent level. Interestingly, the negative effect of a black picture is approximately the same as that of displaying no picture at all.
After controlling for credit characteristics, the estimated effect of displaying a picture of a woman is the reverse of what we saw in the summary statistics. In the raw summary statistics, women are less likely to have their loan requests funded, but this is driven by the correlation between female pictures and credit score. The estimated effects in Table 2 are positive, and in the Logit specification imply that all else equal listings with a picture of a woman are 1.1 percentage points more likely to fund. This result is statistically significant and approximately half the size of the estimated effect of a black photo.
The apparent age of the person in the picture is also an important predictor of successful funding. Compared to the base group of 35–60-years-old, those who appear younger than 35 have a predicted rate of funding that is between 0.4 and 0.9 percentage points higher, while those who appear to be over 60 years old are between 1.1 and 2.3 percentage points less likely to succeed in acquiring a loan. However, it is worth noting that the elderly comprise only 2 percent of the pictures in the sample.
Pope and Sydnor 69
attractive people are more likely to have their loans funded; however, the coefficient estimates are rather small and are not statistically significant.23The strongest effects from this set of characteristics are for perceived happiness. People who look unhappy are between 1.6 (Logit) and 1.8 (OLS) percentage points less likely to have their loans funded. While these differences are statistically significant at the 10 percent level in both specifications, it is important to note that unhappy people make up only 1 percent of all pictures.
Finally, we coded some secondary characteristics of pictures with adults, including whether the adult had a child with them in the photo, whether the person was professionally dressed (for example, wearing a tie), and whether there were signs of military involvement (for example, uniform). We find no significant effect of a child in the picture or of professional dress on funding. While statistically insignificant in the OLS specification, in the Logit specification military involvement increases the likelihood of funding by 2.5 percentage points.
The estimated effects of the coded loan purpose are generally weaker than those of the picture characteristics, though there are some important and sensible patterns. The base-group for these purpose dummies is the listings with no clear purpose that could be discerned from the one-line loan description. Relative to that group, the loans listings that express interest in consolidating or paying down debt (usually high-interest credit-card debt) are between 0.4 (Logit) and 0.5 (OLS) percentage points more likely to get funded. Loans with most other purposes are less likely to fund, though many of the effects are not statistically significant.
2. Robustness
In Table 3 we begin to investigate the robustness of these results, focusing on the estimated effects for race. The table reports marginal effects from the Logit regres-sion for a number of specifications. In the first column the regressors include only the gender and race characteristics coded from the pictures without any credit or loan-parameter controls. They confirm the summary statistics; blacks are five per-centage points less likely to get funded than whites. The second column adds dum-mies for the borrower’s credit grade, continuous linear measures of the maximum interest rate, DTI, and requested loan size. Adding these controls brings the estimates much closer to the estimates reported in Table 2, and highlights the important cor-relations that race has with credit measures; the estimated effect of being black falls toⳮ2.8 percentage points. This column also provides easy comparisons of the size of the race effect. The marginal effect of being black (ⳮ2.8 percent) is somewhat less that theⳮ4.1 percent effect of moving from a credit score of above 760 (AA
The
Journal
of
Human
Resources
Table 2
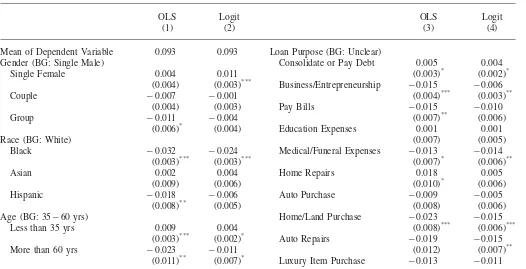
The Effect of Borrower Characteristics and Purpose on Loans Being Funded
Dependent Variable: Indicator⳱1 if the Loan was Funded
OLS Logit OLS Logit
(1) (2) (3) (4)
Mean of Dependent Variable 0.093 0.093 Loan Purpose (BG: Unclear)
Gender (BG: Single Male) Consolidate or Pay Debt 0.005 0.004 Single Female 0.004 0.011 (0.003)* (0.002)*
(0.004) (0.003)*** Business/Entrepreneurship ⳮ0.015 ⳮ0.006 Couple ⳮ0.007 ⳮ0.001 (0.004)*** (0.003)**
(0.004) (0.003) Pay Bills ⳮ0.015 ⳮ0.010 Group ⳮ0.011 ⳮ0.004 (0.007)** (0.006)
(0.006)* (0.004) Education Expenses 0.001 0.001
Race (BG: White) (0.007) (0.005)
Black ⳮ0.032 ⳮ0.024 Medical/Funeral Expenses ⳮ0.013 ⳮ0.014
(0.003)*** (0.003)*** (0.007)* (0.006)** Asian 0.002 0.004 Home Repairs 0.018 0.005
(0.009) (0.006) (0.010)* (0.006) Hispanic ⳮ0.018 ⳮ0.006 Auto Purchase ⳮ0.009 ⳮ0.005
(0.008)** (0.005) (0.008) (0.006) Age (BG: 35ⳮ60 yrs) Home/Land Purchase ⳮ0.023 ⳮ0.015
Less than 35 yrs 0.009 0.004 (0.008)*** (0.006)*** (0.003)*** (0.002)* Auto Repairs ⳮ0.019 ⳮ0.015 More than 60 yrs ⳮ0.023 ⳮ0.011 (0.012) (0.007)**
Pope
and
Sydnor
71
Happiness (BG: Neutral) (0.012) (0.008) Happy 0.007 0.002 Wedding ⳮ0.005 ⳮ0.006
(0.003)** (0.002) (0.012) (0.007) Unhappy ⳮ0.018 ⳮ0.016 Reinvest in Prosper 0.034 ⳮ0.010
(0.010)* (0.009)* (0.021) (0.006)* Weight (BG: Not Overweight) Taxes 0.010 0.008
Somewhat overweight 0.001 0.003 (0.019) (0.011) (0.004) (0.003) Vacation or Trip 0.032 0.006 Very overweight ⳮ0.016 ⳮ0.008 (0.020) ⳮ(0.011)
(0.008)** (0.006) Multiplie of Above Reasons ⳮ0.004 ⳮ0.003 Attractiveness (BG: Average) (0.005) (0.003)
Very attractive 0.007 0.004 Picture Characteristics X X (0.008) (0.005) Month Fixed Effects X X Very unattractive ⳮ0.002 ⳮ0.005 Credit Controls X X
(0.009) (0.007) R–Squared 0.310
Misc. Adult Information Observations 110,333 110,332 Profesionally Dressed 0.000 0.002
(0.005) (0.003) Child With Adult in Picture ⳮ0.005 0.001
(0.003) (0.002) Signs of Military Involvement 0.014 0.025
(0.011) (0.009)***
Notes: Coefficient values and standard errors clustered by borrower are presented using an OLS regression (Columns 1 and 3) and a Logit regression (Columns 2 and 4)-marginal effects reported. The dependent variable in both regressions is a dummy variable indicating whether a particular loan listing was funded. Each characteristic type for which a coefficient value is reported can be interpreted relative to its base group which is indicated in parenthesis. The coefficients on other variables that are included in the regression (credit controls, month fixed effects, etc.) are omitted due to space constraints. The entire set of variables used in these regressions is provided in the text under the heading “Baseline Regression Estimates.”
The
Journal
of
Human
Resources
Table 3
The Effect of Race on Loans Being Funded—Specification Robustness
Dependent Variable: Indicator⳱1 if the Loan was Funded
Only Loans with Pictures
Only 1st Loan Per Borrower (1) (2) (3) (4) (5) (6)
Mean of Dependent Variable 0.093 0.093 0.093 0.093 0.129 0.070 Race (BG: White)
Black ⳮ0.051 ⳮ0.028 ⳮ0.022 ⳮ0.024 ⳮ0.033 ⳮ0.021 (0.002)*** (0.003)*** (0.003)*** (0.003)*** (.004)*** (.004)*** Asian 0.010 0.000 0.006 0.004 0.006 ⳮ0.001
(0.008) (0.006) (0.006) (0.006) (.007) (.006) Hispanic ⳮ0.028 ⳮ0.013 ⳮ0.007 ⳮ0.006 ⳮ0.009 0.001
(0.006)*** (0.006)** (0.006) (0.005) (.007) (.009) Credit Grade (BG: HR & NC)
AA 0.745
(0.004)***
A 0.704
(0.004)***
B 0.624
(0.004)***
C 0.477
Pope
and
Sydnor
73
D 0.315
(0.004)***
E 0.106
(0.003)*** Other Key Credit Variables
Maximum Borrower’s Rate 1.756 (0.022)*** Debt to Income Ratio ⳮ0.014
(0.001)*** $ Requested (thousands) ⳮ0.000
(.000)***
All other Credit Controls X X X X
Long Description Text Controls X X X
Month Fixed Effects X X X
Other Picture Characteristics X X X
Loan Purpose Fixed Effects X X X
Observations 110,333 110,333 110,333 110,333 50,820 51,676
Notes: Coefficient values and standard errors clustered by borrower are presented using Logit regressions – marginal effects reported. The dependent variable in all regressions is a dummy variable indicating whether a particular loan listing was funded. Each Columns 1–4 progressively include a larger set of control variables. The coefficients on these control variables are omitted due to space constraints. The entire set of variables used in these regressions is provided in the text under the heading “Baseline Regression Estimates.” Column 5 restricts the sample to loans that posted a picture. Column 6 restricts the sample to first loans posted by a unique borrower (subsequent loan listings are eliminated from the sample).
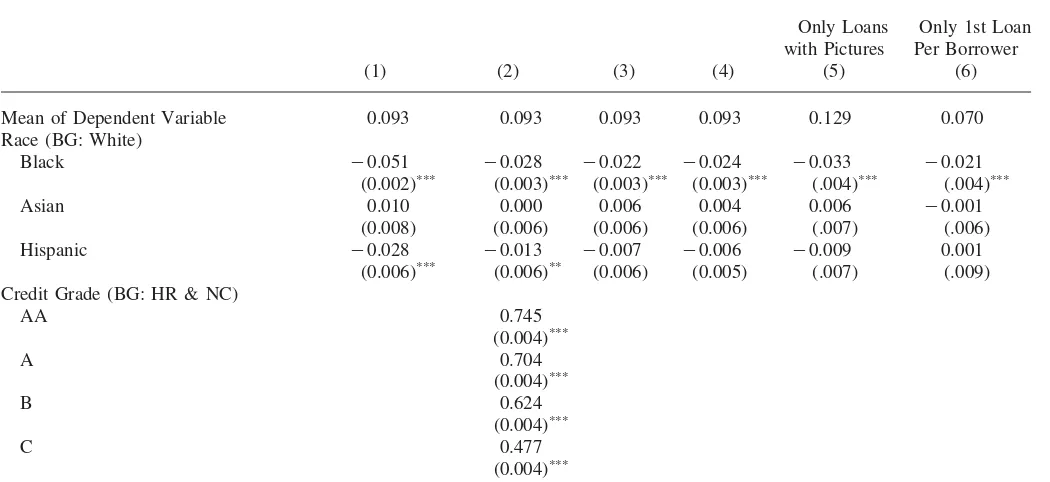
credit) to a credit-score range of 720–59 (A credit), and about one and a half times as large as the effect of a 1 percentage-point change in the maximum interest rate. Columns 3 and 4 of Table 3 add in interaction terms in the financial variables, additional credit controls, the long-description text-analysis controls (for example, percent of words misspelled), time trends, other picture controls, and loan purpose variables. There is a slight drop in the race effect when additional credit controls are added, but otherwise the effect of a black photo does not change meaningfully with these additional characteristics. Column 5 restricts the sample to loans that posted a picture (46.1 percent of all loans). Focusing on this subsample allows us to avoid any potential interaction effects between choosing to post a picture and race. This sample restriction strengthens the significant results that we find in terms of the absolute percentage point difference between black and white funding; how-ever, it is a similar percentage change from the base rate. Column 6 restricts the sample to only the first loan posted by each borrower. This restriction eliminates concerns that subsequent posting behavior may bias the results we find. The effect size in Column 6 is similar to that found in Column 4 in terms of percentage points and slightly larger in terms of percent off the new baseline.
There are a few main takeaways from this robustness table. Approximately half of the disparity in loan funding between blacks and whites observed in the sample averages can be accounted for by the different financial characteristics. It is also important to note that once basic credit controls are included in the regressions, the estimated effects on race are quite stable across different specifications.24
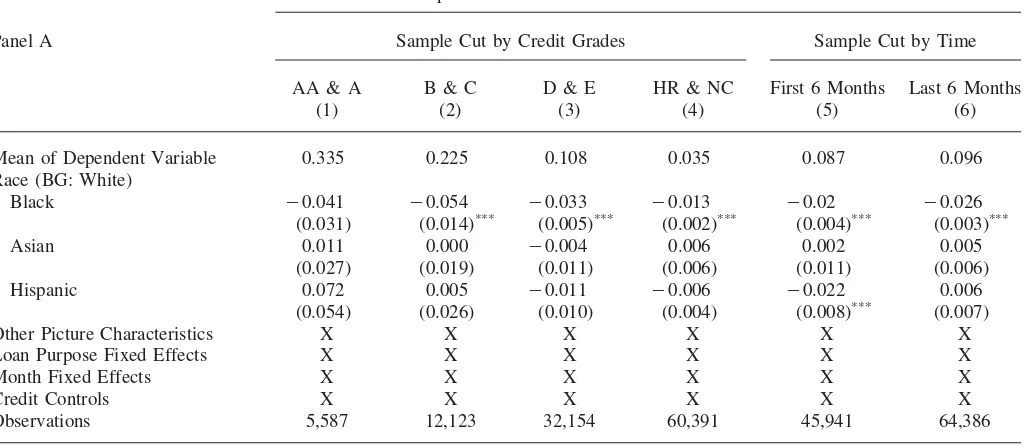
In Table 4 we investigate the race results under a number of different cuts of the data. Each cut uses the baseline Logit specification from Table 2 and reports mar-ginal effects. Cutting by credit grade reveals that across all credit grades there is a significant negative response to black pictures. The percentage point difference in the likelihood of funding between blacks and whites is actually higher for better credit grades: Blacks are 4–6 percentage points less likely to be funded amongst borrowers with credit scores above 640 (grades of C and above), compared to a 3.3 percentage point difference for D&E credit (560–640) and a 1.3 percentage point difference for the high-risk borrowers (520–560). Comparing these differences to the mean probability of funding for the different groups, however, reveals that the likelihood of funding is 37 percent lower for blacks in the high-risk category versus 12.2 percent for blacks in the highest credit grades.
The second cut we investigate splits the one-year sample in half and contrasts results estimated over listings in the first six months of the sample versus those in the second six months. None of the results are meaningfully different between these samples. Although the market itself is evolving rapidly, the market response to information contained in pictures and text has remained relatively stable.
For the third cut in Table 4, we divide the sample into quartiles of self-reported income. The negative marginal effect of a black picture versus a white picture is
Pope and Sydnor 75
slightly larger for higher income quartiles—ranging from ⳮ2.1 percentage points for the lowest income quartile to ⳮ3.4 percentage points for the highest income quartile. Of course, these income quartiles have different mean rates of funding, and thus in percentage terms the negative effect of a black picture is quite a bit larger in the lowest quartiles.
The final cut in the Table 4 investigates whether the race and gender effects vary depending on the borrower’s stated occupation. We split the sample based on oc-cupations that are likely to require a college degree versus those that do not. The negative marginal effect of a black picture is slightly more than a percentage point larger for those with high education jobs (ⳮ3.3 percent to ⳮ1.9 percent). When compared to the funding base rates of the two groups, however, the marginal effects are quite similar in percent terms. The fact that the results for blacks are not strongly related to these occupation cuts, again suggests that any failure on our part to fully capture inferences that lenders can make about educational attainment of the bor-rowers based on observables is unlikely to explain the race results.
One final note on the robustness of our estimates of the probability of funding is in order. Lenders have the option of creating settings that automatically bid on loans based on lender-chosen criteria of credit score, DTI, and the like. We are not able to ascertain how many lenders use this option, but if all lenders exclusively used this process, we would not find any effect on the picture or text characteristics. Hence our results may underestimate the market response that would be observed in a market without automatic bidding. The results also highlight that market par-ticipants do in fact react to the nonfinancial information and that many forgo the option to bid on loans without reviewing the listing in detail.
B. Final Interest Rate on Funded Loans
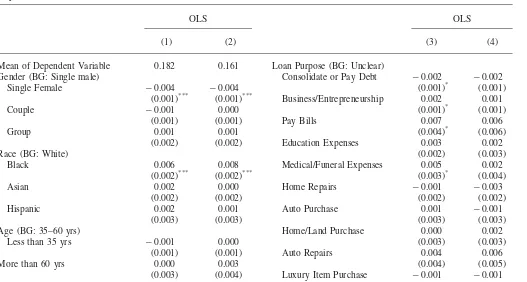
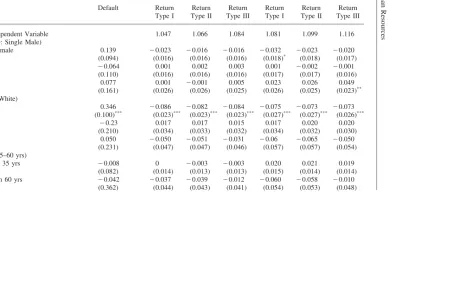
The differences in the likelihood of funding translate into different final interest rates conditional on a loan getting funded. Table 5 presents the results from an OLS regression of the final interest rate of a funded loan on the borrower and listing characteristics used in the baseline specification (Table 2), excluding the maximum interest rate the borrower set. The estimates are in the directions one would expect based on the estimates of the probability of loan funding. The first column of the table is estimated over all 10,207 loans made in the Prosper market during our sample year. All else equal, a funded listing with a picture of a black borrower ends up with an interest rate that is 60 basis points higher than an equivalent listing for a white borrower. Single females have rates that are 40 basis points lower than males. The results for age and happiness are much smaller and not statistically distinguishable from zero. The very unattractive end up with rates that are 60 basis points higher than their average-looking counterparts. The effects of the stated loan purposes are also sensible given the results above. For instance, those expressing a desire to consolidate credit-card debt obtain loans with interest rates that are 20 basis points lower than their counterparts who express a need for a business loan.
The
Journal
of
Human
Resources
Table 4
The Effect of Race on Loans Being Funded—Sample Cuts
Dependent Variable: Indicator⳱1 if the Loan was Funded
Panel A Sample Cut by Credit Grades Sample Cut by Time
AA & A B & C D & E HR & NC First 6 Months Last 6 Months
(1) (2) (3) (4) (5) (6)
Mean of Dependent Variable 0.335 0.225 0.108 0.035 0.087 0.096 Race (BG: White)
Black ⳮ0.041 ⳮ0.054 ⳮ0.033 ⳮ0.013 ⳮ0.02 ⳮ0.026 (0.031) (0.014)*** (0.005)*** (0.002)*** (0.004)*** (0.003)*** Asian 0.011 0.000 ⳮ0.004 0.006 0.002 0.005
(0.027) (0.019) (0.011) (0.006) (0.011) (0.006) Hispanic 0.072 0.005 ⳮ0.011 ⳮ0.006 ⳮ0.022 0.006
(0.054) (0.026) (0.010) (0.004) (0.008)*** (0.007) Other Picture Characteristics X X X X X X Loan Purpose Fixed Effects X X X X X X
Month Fixed Effects X X X X X X
Credit Controls X X X X X X
Pope
and
Sydnor
77
Panel B Sample Cut by Income Quartiles Sample Cut by Occupation
Low Quartile 2nd Quartile 3rd Quartile High Quartile No College College
(1) (2) (3) (4) (5) (6)
Mean of Dependent Variable 0.059 0.072 0.091 0.147 0.086 0.116 Race (BG: White)
Black ⳮ0.021 ⳮ0.022 ⳮ0.022 ⳮ0.034 ⳮ0.019 ⳮ0.032 (.004)*** (0.004)*** (0.005)*** (0.007)*** (0.004)*** (0.006)*** Asian ⳮ0.003 ⳮ0.001 0.008 0.016 ⳮ0.006 0.003
(.009) (0.010) (0.011) (0.013) (0.008) (0.010) Hispanic ⳮ0.020 0.000 0.003 ⳮ0.013 ⳮ0.003 ⳮ0.012
(.006)*** (0.009) (0.013) (0.013) (0.007) (0.014) Other Picture Characteristics X X X X X X Loan Purpose Fixed Effects X X X X X X
Month Fixed Effects X X X X X X
Credit Controls X X X X X X
Observations 28,480 26,054 27,244 27,288 56,208 20,432
Notes: Coefficient values and standard errors clustered by borrower are presented using Logit regressions—marginal effects reported. The dependent variable in all regressions is a dummy variable indicating whether a particular loan listing was funded. Columns 1–4 of Panel A present results from regressions using data cut by credit grades. The second half of Panel A presents results from regressions using data from June 2006 to November 2006 (Column 5) and December 2006 to May 2007 (Column 6). Columns 1–4 of Panel B present results from regression using data cut by income quartiles. The second half of Panel A present results from regressions using data from individuals whose self-reported occupation does not typically require a college degree (Column 5) and for those whose occupation typically does require a college degree (Column 6). The coefficients on other variables that are included in the regression (credit controls, month fixed effects, etc.) are omitted due to space constraints. The entire set of variables used in these regressions is provided in the text under the heading “Baseline Regression Estimates.”
The
Journal
of
Human
Resources
Table 5
The Effect of Borrower Characteristics and Purpose on the Final Interest Rate for Funded Loans
Dependent Variable: The Final Interest Rate for Funded Loans
OLS OLS
(1) (2) (3) (4)
Mean of Dependent Variable 0.182 0.161 Loan Purpose (BG: Unclear)
Gender (BG: Single male) Consolidate or Pay Debt ⳮ0.002 ⳮ0.002 Single Female ⳮ0.004 ⳮ0.004 (0.001)* (0.001)
(0.001)*** (0.001)*** Business/Entrepreneurship 0.002 0.001 Couple ⳮ0.001 0.000 (0.001)* (0.001)
(0.001) (0.001) Pay Bills 0.007 0.006
Group 0.001 0.001 (0.004)* (0.006)
(0.002) (0.002) Education Expenses 0.003 0.002
Race (BG: White) (0.002) (0.003)
Black 0.006 0.008 Medical/Funeral Expenses 0.005 0.002 (0.002)*** (0.002)*** (0.003)* (0.004) Asian 0.002 0.000 Home Repairs ⳮ0.001 ⳮ0.003
(0.002) (0.002) (0.002) (0.002) Hispanic 0.002 0.001 Auto Purchase 0.001 ⳮ0.001
(0.003) (0.003) (0.003) (0.003) Age (BG: 35–60 yrs) Home/Land Purchase 0.000 0.002
Less than 35 yrs ⳮ0.001 0.000 (0.003) (0.003)
(0.001) (0.001) Auto Repairs 0.004 0.006 More than 60 yrs 0.000 0.003 (0.004) (0.005)
Pope
and
Sydnor
79
Happiness (BG: Neutral) (0.003) (0.004) Happy ⳮ0.001 ⳮ0.001 Wedding 0.010 0.007
(0.001) (0.001) (0.004)** (0.005) Unhappy 0.002 0.002 Reinvest in Prosper 0.004 0.004
(0.004) (0.005) (0.002)** (0.002)** Weight (BG: Not Overweight) Taxes ⳮ0.007 ⳮ0.012
Somewhat overweight 0.002 0.002 (0.004)* (0.005)** (0.001)* (0.001) Vacation or Trip 0.005 0.007 Very overweight 0.003 0.005 (0.004) (0.008)
(0.002) (0.003) Multiplie of Above Reasons 0.003 0.003 Attractiveness (BG: Average) (0.002) (0.002)
Very attractive 0.003 0.003 Open Funding Option Only X (0.002)* (0.002) Picture Characteristics X X Very unattractive 0.006 0.009 Month Fixed Effects X X (0.003)** (0.003)*** Credit Controls X X Misc. Adult Information R–Squared 0.79 0.76
Profesionally Dressed 0.003 0.003 Observations 10,207 6,419 (0.001)** (0.001)*
Child With Adult in Picture 0.003 0.002 (0.001)*** (0.001) Signs of Military Involvement ⳮ0.002 0.000
(0.003) (0.004)
Notes: Coefficient values and standard errors clustered by borrower are presented using two OLS regressions. The dependent variable in both regressions is the final interest rate that borrowers have to pay for a particular loan. The regression presented in Columns 1 and 3 uses the entire sample of funded loans while the regression reported in Columns 2 and 4 restricts the sample to loans for which the setting of the loan listing was such to allow an auction system to determine the final interest rate. Each characteristic type for which a coefficient value is reported can be interpreted relative to its base group which is indicated in parenthesis. The coefficients on other variables that are included in the regression (credit controls, month fixed effects, etc.) are omitted due to space constraints. The entire set of variables used in these regressions is provided in the text under the heading “Baseline Regression Estimates.”
results in that way. Borrowers may elect to forgo the “bid-down” process and receive their loan funds at the maximum interest rate they set as soon the loan becomes fully funded. The worry here is that if, for example, black borrowers were more likely to use this feature and occasionally set maximum interest rates that were highly attractive to lenders, it might result in higher interest rates for funded black loans than similar funded white loans, even if the reservation rates of the lenders were the same for the two groups. To address this concern, Column 2 of Table 5 restricts the analysis to the 6,419 funded loans that used the “open funding” option that allows interest rates to be bid down to the reservation rate of the marginal lender. The results are quite similar, and in fact the effect of a black loan increases from 60 basis points in Column 1 to 80 basis points for the loans that allow bid down.
C. Net Return on Funded Loans
The preceding analysis reveals that the market discriminates based on information contained in pictures and text and that this discrimination leads to disparities in interest rates on funded loans. Here we ask whether the discrimination we observe in the Prosper.com market is efficient for the lenders.
1. Loan-Performance Data25
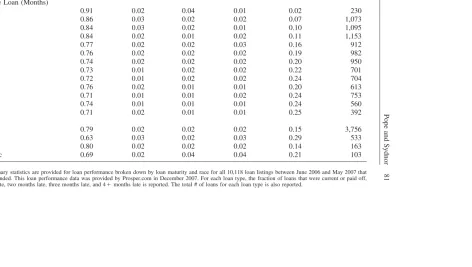
Prosper provides performance data on all loans that have been made in the market-place. The analysis here is based on the available performance data as of December, 2007, at which point the loans made during our sample year ranged in age from seven months to 19 months. Prosper provides information on payment status of each loan showing whether the loan was current, paid off, one month late, two months late, three months late, four months late or more, and officially defaulted. Table 6 shows summary statistics for this performance data, combining defaulted loans with those that are four months late or more (which exceeds the usual standards for considering a loan in default). Among all loans made during the sample year, as of December 2007, 78 percent had been paid off or were in good standing. Approxi-mately 2 percent fell in each of the categories, one month late, two months late, and three months late. A sizeable fraction (17 percent) of all loans was four months late or more.
The table breaks down the performance data by the age of the loan. Naturally, the number of loans in good standing is higher for the more recent loans. For instance, only 2 percent of the loans made in May, 2007 were four months late or more in payments as of December, 2007, which is sensible when one considers that these borrowers would have had to stop paying by the third month of their loan to fall into this category. The payment characteristics are rather stable, however, for loans that are at least 13 months old, suggesting that most default in the Prosper market may occur during the first year of the loan. Somewhere between 71 percent and 74 percent of loans were in good standing after 13 months, while payments for 20–25 percent of loans were at least four months late.
Pope
and
Sydnor
81
Table 6
Loan Performance Summary Statistics
Current Status of All Funded Loans (Fractions Reported)
Current or Paid Off
1 Month Late
2 Months Late
3 Months Late
4ⳭMonths
Late
Total # of Loans
All Loans 0.78 0.02 0.02 0.02 0.17 10,118 Age of the Loan (Months)
7 0.91 0.02 0.04 0.01 0.02 230
8 0.86 0.03 0.02 0.02 0.07 1,073
9 0.84 0.03 0.02 0.01 0.10 1,095
10 0.84 0.02 0.01 0.02 0.11 1,153
11 0.77 0.02 0.02 0.03 0.16 912
12 0.76 0.02 0.02 0.02 0.19 982
13 0.74 0.02 0.02 0.02 0.20 950
14 0.73 0.01 0.02 0.02 0.22 701
15 0.72 0.01 0.02 0.02 0.24 704
16 0.76 0.02 0.01 0.01 0.20 613
17 0.71 0.01 0.01 0.02 0.24 753
18 0.74 0.01 0.01 0.01 0.24 560
19 0.71 0.02 0.01 0.01 0.25 392
Race
White 0.79 0.02 0.02 0.02 0.15 3,756
Black 0.63 0.03 0.02 0.03 0.29 533
Asian 0.80 0.02 0.02 0.02 0.14 163
Hispanic 0.69 0.02 0.04 0.04 0.21 103
Table 6 continues by indicating loan performance information by race. There are large differences in default rates across racial groups. Most notably, 29 percent of loans made to black individuals are four months late or more. In comparison, only 14–15 percent of loans made to white or Asian borrowers are four months late or more. Hispanic default rates fall in between these groups with 21 percent of loans that are four or more months late. Once again, however, given the correlations that exist between these groups and other variables (for example credit grades), the sum-mary statistics do not provide conclusive evidence that these groups have higher default rates controlling for all of the other information available to lenders.
2. Hazard Model of Default
In order to formally test whether there exist ceteris paribusdifferences in default rates across gender, race, and other groups, we employ a simple hazard model where default is considered to be a nonnegative random variable. We estimate the hazard function,(t), as defined in the analysis of Cox’s proportional hazard model (Cox, 1972).(t)measures the instantaneous failure rate at time t given that the individual survives until time t. In our model, a “failure” is a loan that goes into default. For this model, we define a loan as entering default when the borrower misses three consecutive pay cycles (a common assumption in the literature on loan repayment). In this model the baseline hazard rate, 0(t), remains unspecified and through the exponential link function, the same covariatesXiandZithat are used in our baseline regressions in Table 2 act multiplicatively on the hazard rate.
The hazard-model estimation results are presented in Column 1 of Table 7. Once again, the largest and most significant effects that we find in the estimation of the hazard model involve the race variables. Blacks are approximately 36 percent more likely to default on their loans than are whites with similar characteristics. The summary statistics indicated that blacks were twice as likely to default as whites. While the estimate on the black coefficient is smaller after controlling for credit and other variables, it is still statistically significant and obviously economically large. While not statistically significant, Asians and Hispanics are estimated to be 24 per-cent less likely and 10 perper-cent more likely to default than whites, respectively.
Few of the coefficients on the other picture characteristics are statistically signifi-cant. However, the direction of the effects is interesting. The parameter estimates suggest, for instance, that women are 14 percent more likely to default than men. The difference across age groups is essentially zero. Borrowers that the coders re-corded as appearing unhappy are estimated to be 42 percent more likely to default. The results of being somewhat or very overweight relative to being thin are mixed. Borrowers coded as being very unattractive are estimated to be 32 percent more likely to default, though not significant and borrowers that indicated signs of military involvement are estimated to be 49 percent more likely to default.
3. Estimates of Net Return
Pope and Sydnor 83
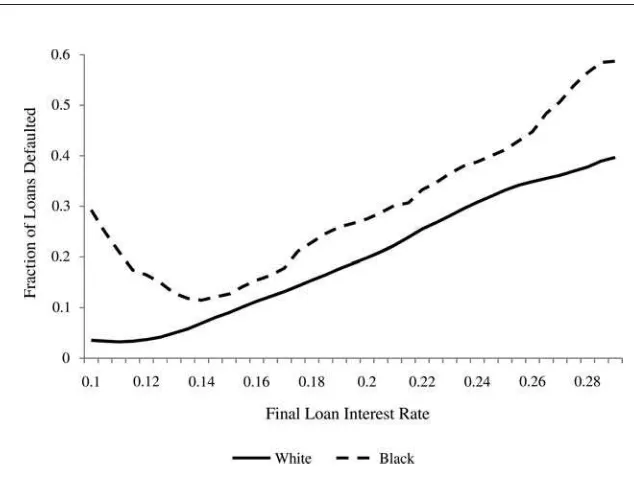
actually paid. We begin with a simple graph. Figure 3 presents the fraction of loans defaulted versus the final interest rate on the loan using linear smoothing.26 It is clear from the graph that at each interest rate, the proportion of black loans defaulting is higher than the proportion of white loans defaulting. Figure 4 adds to the evidence presented in Figure 3 by illustrating the dynamics of loan performance. We begin by calculating the returns lenders see as an average annual percentage rate (APR) across black and white loans for each month as the loans age. Under the assumption that borrowers who are current or less than two months behind will continue to make payments until loan maturity and that borrowers that are three or more months behind are in default, we graphically demonstrate how the average APR by race declines over the maturation of loans as defaults begin occurring. Figure 4a and 4b illustrate this by looking at loans for which we have at least 12 and 15 months of loan-performance data, respectively. As can be seen in each of these figures, black loans have a higher APR at the beginning (due to the fact that they are required to pay higher interest rates on average). As loans mature, however, the higher default rate on black loans causes the net return on these loans to fall below the net return on white loans. In fact, the black default rates are such that by four months the net return on black loans is lower than the for white loans, at nine months the net return on black loans is negative, and at 12 months the average APR on black loans is approximatelyⳮ5 percent relative to a 5 percent APR for the average white loan. While Figures 3 and 4 provide a nice visual representation of loan repayment by race, it does not allow us to estimate the difference in net return for race while controlling for credit grade and other important variables. In order to do this more rigorous analysis, we begin by calculating the net return over a three-year period on a dollar invested.27 The calculation uses the monthly payment on the loan, and thereby incorporates the interest rate on the loan. We consider three different mea-sures of net return, based on different assumptions about the future repayment of loans. Each measure assumes that any loan that is in good standing (current or paid off), in December, 2007 will continue to be paid off throughout the remainder of the three-year loan period. This assumption is obviously generous, as some of the loans in good standing will default in the future. Furthermore, assuming that the loans that are paid off earn the full three-year return, is equivalent to assuming that lenders who are paid early can costlessly find another loan with the same terms. The differences between the return measures come from different assumptions about the repayment stream for loans that were late as of December 2007. Our first net return variable, Return Type I, is the most pessimistic about future loan performance; we assume that any loan that is not in good standing (one month or more late) in December, 2007 will not produce any future payments. For Return Type II we assume that a loan that is only one month late will eventually pay in full, and for
26. This graph makes use of the lowess command in STATA. For this Figure, we define a loan to be in default if the borrower has missed three or more consecutive pay cycles.