and Welfare Caseloads
Chien-Chung Huang
Irwin Garnkel
Jane Waldfogel
a b s t r a c t
Although there is a large body of research devoted to the issue of the de-terminants of welfare caseloads, none of these studies has incorporated the effects of child support enforcement (CSE). We employ annual state panel data from 1980 to 1999 and nd that states with more effective CSE have signicantly lower welfare caseloads. The improvement in CSE over this period reduces welfare caseloads by about 9 percent in 1999. We also discover that individual child support variables may not be good indicators of state CSE vigor and that a CSE index that includes multiple dimensions of CSE is more likely to capture the multiplicative functions of CSE.
I. Introduction
As a consequence of increasing rates of nonmarital births and di-vorces, the proportion of American families with children that are headed by single mothers rose sharply in the last quarter of the twentieth century. One of every eight families with children was headed by a single mother in 1970. By 1998, the propor-tion had doubled to one of every four. Unfortunately, the economic insecurity of
Chien-Chung Huang is an assistant professor in the school of social work at Rutgers, the State Univer-sity of New Jersey; Irwin Garnkel is Mitchell I. Ginsberg Professor of Contemporary Urban Problems in the school of social work at Columbia University; Jane Waldfogel is a professor in the school of so-cial work at Columbia University. This research was supported by a grant from NICHD-HD19375. The authors want to thank Rebecca Blank, Wen-Jui Han, Robert Moftt, and James Ziliak for provid-ing data. The data used in this article can be obtained beginnprovid-ing August 2004 through July 2007 from Chien-Chung Huang, 536 George Street, School of Social Work, Rutgers University, New Brunswick, New Jersey, NJ 08901 (huangc@rci.rutgers.edu).
[Submitted June 1999; accepted March 2003]
ISSN 0222166XÓ2004 by the Board of Regents of the University of Wisconsin System
single-mother families remains dangerously high. Nearly 40 percent are poor and another 45 percent are near-poor (below 200 percent of the poverty line) (U.S. House of Representatives 2000).
The rising number of single-mother families and their persistent disadvantage has increased public and political concerns over the roles of welfare and child support. In response to the increase of divorced and never-married mothers in Aid to Families with Dependent Children (AFDC) caseloads, state and federal legislators have taken a number of steps to prevent nonresident fathers from abandoning their children nancially and to increase the responsibility of resident mothers (for a brief history, see Garnkel, Meyer, and McLanahan 1998). In 1975, Congress created the Child Support Enforcement (CSE) Program, which established state ofces of CSE and authorized Federal matching funds for states to help locate absent parents, establish paternity, establish child support orders, and obtain child support payments. From 1981 through 1999 (with the exception of 1983, 1985, and 1991), Congress passed new laws every year strengthening child support (Lerman and Sorenson 2000). The 1984, 1988, and 1996 bills were the most important. The 1984 Child Support Amend-ments required states to develop legislative guidelines to be used in determining child support awards and to withhold child support obligations from the paychecks of delinquent fathers. In 1988, the Family Support Act mandated states to adopt presumptive guidelines for child support awards and to initiate automatic withhold-ing from fathers’ paychecks, regardless of delinquency. The Personal Responsibility and Work Opportunity Reconciliation Act (PRWORA) of 1996 reinforced paternity establishment by streamlining the legal processes for establishment, requiring states to adopt in-hospital voluntary paternity establishment programs, and providing man-datory genetic testing in contested cases. It also strengthened income withholding by reducing the time for employers to remit withheld wages to seven business days and allowing issuance of electronic withholding orders by State agencies without notice to obligors. The collection system is changing from one where payment is often discretionary to one where payment is compelled and automatic (Legler 1996; Wolk and Schmahl 1999).
State and federal legislators also have passed a series of proposals designed to re duce the welfare eligibility of single mothers and increase the costs of single mother-hood. These initiatives included a series of welfare waivers in the late 1980s and rst half of the 1990s that lowered welfare benets, imposed work requirements, and limited eligibility. This trend culminated in the 1996 PRWORA, which replaced AFDC by Temporary Assistance for Needy Families (TANF), eliminated the entitle-ment to welfare, substantially tightened work requireentitle-ments, and limited total lifetime eligibility to ve years.
end of 1999. Numerous studies have found that the changes in demographics, macro-economic conditions, political party, and AFDC program characteristics help to ac-count for the changes over time (CBO 1993; CEA 1997, 1999; Moftt 1992, 1999; Wallace and Blank 1999; Figlio and Ziliak 1999; Schoeni and Blank 2000; Ziliak et al. 2000; Blank 2001; Klerman and Haider 2001; O’Neill and Hill 2001).
What is missing from the studies of welfare caseloads is the effect of CSE. Both reductions in welfare benets and increases in child support payments will decrease welfare caseloads. Perhaps because direct effects are more obvious and easier to document compared with indirect effects, academic studies as well as the popular media have paid more attention to changes in welfare policies than to changes in child support policies in accounting for changes in welfare caseloads. For a number of reasons, this omission is both surprising and regrettable. First, policy makers strengthened CSE in the belief that doing so would improve collections and thereby reduce welfare costs and caseloads. Second, there is evidence that CSE has improved collections, especially among fathers whose children are likely to be on welfare. Third, as we show below, there are good reasons to expect, and fairly strong empiri-cal evidence to support the belief, that strong CSE will reduce welfare caseloads. Finally, while cuts in welfare benets and increases in child support payments both decrease welfare caseloads, the former reduces the economic well-being of single-mother families while the latter increases it. Thus previous studies of welfare case-loads are incomplete.
In this paper we test the hypothesis that strong CSE is associated with lower welfare caseloads. The results indicate that states with more effective CSE have signicantly lower welfare caseloads, suggesting that future caseload studies should incorporate the effects of CSE. In the next section, the theory and empirical evidence that motivate our analysis are discussed. In the third and fourth sections, we describe our analytical methods and data. After that, the effects of CSE on welfare caseloads are presented. In the nal section we discuss our results and their implications for both policy and future research.
II. The Multiple Effects of Child Support
Enforcement on Welfare Caseloads: Theory and
Previous Literature
1985; Robins 1986; Garnkel, Robins, Wong, and Meyer 1990). In terms of ows into and out of welfare, two studies (Meyer 1993; Huang, Kunz, and Garnkel 2002) using longitudinal data nd that child support payments signicantly increase the likelihood of exiting welfare and decrease the probability of reentering welfare.
Though economic theory does not yield general conclusions about the effects of strong CSE on nonmarital births or divorce, theory suggests that in the presence of a welfare system, deterrence effects are likely. Stronger CSE increases the income of the custodial or resident parent and reduces the income of the nonresident parent. To simplify, yet account for most cases, we call resident parents mothers and nonresi-dent parents fathers. If CSE is tougher, mothers will be more prone to parent a child out-of-wedlock and to divorce, while fathers will be less prone to do either. Which effect will dominate cannot be ascertained in general. But Nixon (1997) shows that stronger enforcement is more likely to deter divorce among couples where the di-vorced wife would rely on welfare. And, Willis (1999) nds that in the presence of a shortage of males and relatively high female income (which is produced by wel-fare), theory predicts stronger enforcement reduces nonmarital births. One simple though not quite full story is that among couples where the mother goes on welfare if she has a nonmarital birth or is divorced, welfare removes or at least reduces the benet of strong enforcement. Consequently, the effect of enforcement on the in-comes of these mothers and fathers is asymmetrical. In sum, previous explorations of economic theory predict that in conditions that pertain in the United States today, stronger CSE will reduce nonmarital births and may reduce divorce. Further, there is empirical conrmation that stronger enforcement reduces marital disruption (Nixon 1997), and out-of-wedlock childbearing (Case 1998; Blau, Kahn, and Waldfogel 1999; Huang 2002; Garnkel, Huang, McLanahan, and Gaylin 2003).
In short, theory strongly suggests and empirical research conrms that strong CSE decreases welfare participation by increasing the income of single mothers and by deterring single-motherhood. The total effect on welfare caseloads could be quite substantial even if each of the individual effects were only small to modest.
There is also a relatively large body of research devoted to predicting welfare participation and welfare caseloads (see Moftt 1992, Figlio and Ziliak 1999, Blank 2001, 2002 for thorough reviews). In studies done in the 1980s, the focus was on the effects of welfare program characteristics on the participation decision. Although the data and methods are different, the results across the studies are remarkably consistent in showing that welfare participation is an economic decision. Higher caseloads are associated with higher welfare benets, and also with higher unem-ployment rates and lower wages as well as fewer other sources of income (which include but are neither limited to nor dominated by child support payments). Women who are less educated, older, in poorer health, and with more and younger children are more likely to participate in welfare.
caseloads as a function of unemployment rates, welfare waivers, and AFDC maxi-mum benet guarantees. The CEA study concluded that 44 percent of the decline in welfare receipt from 1993 to 1996 can be attributed to economic growth and that 31 percent is related to welfare waivers. Wallace and Blank (1999) used annual state data for 1980–96 and a rich set of control variables to examine the changes in welfare participation. They found that caseloads are strongly affected by macroeconomic, welfare waivers, programmatic, and political factors. In the 1994– 96 simulation, economic factors contribute 47 percent of caseload decline and welfare waivers ac-count for 22 percent of the decline. Ziliak et al. (2000) argued that the use of annual caseloads masks the importance of short-run dynamics in caseload levels, and thus employed monthly state-level data and a more dynamic specication to examine AFDC caseloads. They used 1987– 96 monthly data and attributed 66 percent of the caseloads decline between 1993 and 1996 to macroeconomic factors and a negligible effect to welfare waivers. Figlio and Ziliak (1999) further conducted an extensive reconciliation between the ndings in Ziliak et al. and those of the CEA, and con-cluded that these differences are largely due to the fact that the CEA used a static model while Ziliak et al. employed a dynamic one, and that the primary consequence of controlling for caseload dynamics is to reduce the role of welfare reform relative to macroeconomic factors in generating the decline in AFDC caseloads.
Several papers extend the data period to post-1996 and compare the TANF era with the AFDC period (Council of Economic Advisers 1999; Grogger and Michalo-poulos 1999; Wallace and Blank 1999; Rector and Youssef 1999; Schoeni and Blank 2000; O’Neill and Hill 2001; Grogger Forthcoming). They found welfare policy had a bigger effect in the TANF period, while unemployment had a lesser impact on caseloads. For example, the CEA (1999) indicates that the 1996 PRWORA has been a key contributor to the recent decline of the caseloads. TANF accounts for one-third of the caseload reduction from 1996 to 1998 while the improvements in the labor market account for 8 to 10 percent.
Unlike previous studies that were based on the stock of caseloads, Klerman and Haider (2001) used a stock-ow approach to examine welfare caseloads. They argued that the stock approach, which assumes welfare caseloads are static and are a function of explanatory variables, is problematic because welfare receipt is also dependent on the previous history of welfare receipt, or negative duration depen-dence. Such dependence is well-supported by previous welfare-ow studies (Hutch-ens 1981; Bane and Ellwood 1986, 1994; Hoynes 2000). Using 1989 to 1998 Califor-nia data (the national data for the stock-ow approach is not available), they modeled welfare caseloads into two parts, entry and continuation rates, and allowed these rates to vary with explanatory variables. They found that approximately 50 percent of the caseload decline in California can be attributed to economic factors, substan-tially larger than the 20–35 percent estimates that are obtained from the stock ap-proach.
III. Methods
The primary analysis technique is xed-effects regression with wel-fare caseloads as the dependent variable, and child support enforcement, demo-graphic, economic, welfare, and political variables as independent variables. Fixed-effects models are run as ordinary least squares (OLS) regressions with state and year binary variables and state-specic time trends as the xed effects. The model specication uses the natural logarithm form and is given by:
(1) lnyit5ai1b1*CSEit1b2*cit1dt1hit 1eit
whereyitis welfare caseloads measured for stateiat timet,aiis the individual state effect (which is taken to be constant over time), CSE is a child support enforcement variable, cis a vector of demographic, economic, welfare, and political variables, dtis the time effect (which is taken to be constant across states), h is the state-specic time trends (which is the interaction of state dummies and the linear time trend variables),bis a regression coefcient, andeitis the cross-section time-series error component. Note that with state and year effects and state-specic time trends, the only way in which a variable can inuence the dependent variable is through its deviation from linear time trends in the state. Variables that are largely constant over time within states or affect all states in a given year such as the Earned Income Tax Credit (EITC) will be subsumed within the state and year xed effect. (It is for this reason that the EITC has not been included in the welfare caseloads studies).
The coefcientb1in Equation 1 may be biased if CSE is endogenous. States with high caseloads may have a greater incentive to enforce child support. Consequently, the error term of Equation 1 is correlated with CSE and OLS generates biased coef-cients. In results not shown, female legislator ratio was used as an instrument to correct this potential endogeneity in two-stage least square regression, but most of the estimates are not substantially different from the ones from OLS. Female legisla-tor ratio, however, may also affect other government programs, such as the generos-ity of welfare and child care benets, which affect welfare caseloads and thus may not be a good instrument. Like some previous analyses of welfare caseloads, we also estimate dynamic versions of the Model 1 by including lagged welfare caseloads as an independent variable. In results not shown, the estimates of CSE are still sig-nicant although the magnitudes are reduced substantially due to the dynamic speci-cation. Klerman and Haider (2001) provided evidence that including a lagged de-pendent variable in combination with the xed effects could cause a Nickell bias that results in biased estimation in dynamic simulation, although it may identify the underlying structure of the stock-ow model if the continuation rate does not vary with duration.
or show signicant effects. This may partly be due to the difculty of measuring the effect of individual legislation or efforts and partly to the ambiguity of the correct specication of CSE. A successful enforcement of child support requires three steps: establish a legal child support order; determine award amount; and collect the pay-ment. Moreover, effective CSE requires strict child support legislation, sufcient expenditures, and strong implementation. The benecial effect of child support legis-lation would not be observed unless strong and effective enforcement is implemented (Freeman and Waldfogel 2001; Huang, Kunz, and Garnkel 2002). Most studies, however, measure one dimension of CSE. For example, Case (1998) emphasizes child support legislation and does not include measures of states’ abilities to imple-ment. Nixon (1997) uses payment rate, average payment, and accounts receivable to measure state CSE and does not include legislation activity.
Effective CSE is derived in part, but not in whole, from laws. Good laws that are not effectively enforced may have little effect. Thus, it seems reasonable to hy-pothesize that welfare caseloads will be more strongly related to effective enforce-ment practices than to laws per se. While utilizing measures of child support pay-ments has advantages, there are disadvantages as well. Most important, not all of the effects of child support laws on welfare caseloads operate indirectly through their effects on child support payments. For example, laws that strengthen the re-quirements for mothers receiving AFDC/TANF to cooperate with OCSE ofcials in the establishment of paternity and enforcement of support could deter mothers from applying for welfare even if the law had no effect on child support payments. Simi-larly, laws strengthening paternity establishment could affect father’s marriage and fertility behavior rather than payment behavior. Because CSE is a multiplicative function of the probability of having a legal obligation, the level of the obligation, and the probability of paying the full obligation, individual child support variables may not be a good indicator of state CSE, and this may be the reason that individual child support variables do not show consistent results in previous studies.
Thus, to capture the strength of a state’s CSE, we create a CSE index that includes state child support legislation, expenditures, and implementation ability. First, a leg-islative index is created to measure the vigor of state child support legislation (for an earlier example of a legislative index, see Freeman and Waldfogel 2001). The legislative index includes eight measures of child support legislation (values range from zero for states with no law to eight for states with all eight laws) and covers steps for establishing paternity, obtaining an award, and collecting child support payments: genetic tests, paternity establishment, numerical guidelines, presumptive guidelines, wage withholding under delinquency, immediate wage withholding for a new case, universal wage withholding, and state income tax refund interception (for detailed information on these child support laws, please see Huang 2002 and Huang, Kunz, and Garnkel 2002).
provide services to all welfare families and to offer to provide services to nonwelfare families. As a result, state OCSE is more likely to spend money on current or former welfare cases. Thus, we create four alternative variables to measure per capita child support expenditure, in which each state’s child support expenditures are divided by number of single-mother families, total OCSE caseload, total OCSE current and former welfare caseload, and total OCSE current welfare caseload.
Finally, we create a measure of the state’s CSE implementation ability, using three variables: collection rate, amount, and effectiveness. The collection rate is the proportion of single-mother families on welfare who receive any child support, and the collection amount is the average child support payment for families on welfare, calculated as total state child support collection for families on welfare divided by the total number of families on welfare. The collection effectiveness is dened as the child support collection amount in a state divided by the child support amount owed under the Wisconsin guideline for that state (Garnkel 1992). The collection effectiveness is the most comprehensive measure of the strength of a state’s CSE system because it captures the effects of: 1) the probability of establishing a legal child support obligation, 2) the dollar value of the obligation, and 3) the degree to which the obligation is paid. The collection rate and amount, while not quite as comprehensive as collection effectiveness are still very good measures of the strength of a state’s enforcement system because they reect success at both getting a child support award and securing a payment.
In addition to these variables, we create a variable to measure the level of child support payments relative to welfare generosity in each state, calculated as state average child support payments divided by maximum AFDC/TANF benets. The higher the proportion of child support payments relative to welfare benets is, the more likely it is that single mothers would move out of welfare caseloads.
IV. Data
The data for this study came from several sources. In previous stud-ies, welfare caseloads have been dened as AFDC-Basic caseloads divided by the state population or by the female population aged 15–44. Although both measures adjust for state size, the latter one is preferred because it takes account of the size of the population at risk in that state and therefore we follow it here.1AFDC-Basic caseloads come from Quarterly Public Assistance Statistics (QPAS) from 1980 to 1996 and are from the Ofce of Planning, Research and Evaluation (OPRE) for 1997– 99 (Department of Health and Human Services 2002). State female population aged 15–44 come from the 1980– 99 March Current Population Survey (CPS).
As discussed above, the key independent variable, the strength of the state’s CSE system is measured by an index that is made up of three types of measures: child support legislation, enforcement expenditures, and implementation ability (which
includes the collection rate, collection amount, effectiveness, and the level of child support payments relative to welfare benets). The data for child support legislation are from Huang (2002) and Huang, Kunz, and Garnkel (2002). Child support expen-diture and number of OCSE caseloads are from OCSE’s annual report to Congress. The number of single-mother families comes from 1980– 99 March CPS.
We calculate the collection rate and amount from two different data sources: OCSE and CPS. For OCSE measures, the number of families on welfare receiving child support and the dollar amount received reported by OCSE are divided by the number of OCSE welfare cases to measure the OCSE collection rate and amount for current welfare mothers. The OCSE data are not reliable for tracking payments to all families eligible for child support. Federal legislation does not require each state OCSE to provide services to nonwelfare families. States differ on the extent to which they incorporate nonwelfare cases into their administrative systems. Over time, however, virtually all states have brought an increasing proportion of all eligi-ble families into their state OCSE systems. Thus a large part of the difference among states and over time in OCSE collections for nonwelfare families is a result of count-ing more families in one state than in others where child support was already becount-ing paid. The OCSE administrative data are subject to various kinds of reporting error (Guyer, Miller, and Garnkel 1996). It is possible that states report child support payments to former welfare cases as payments to current welfare cases. Though the data matching capabilities of state ofces of welfare and CSE have improved over time, this type of error is still likely to occur, especially since federal law gives state ofces of CSE greater incentives for collecting from welfare than from nonwelfare cases. Also, welfare caseloads dropped dramatically after 1996 PRWORA, and state OCSE may not have had the capacity to update their caseloads promptly. Most im-portant, mothers who leave welfare are less likely to reenter if they receive child support (Meyer 1993; Huang, Kunz, and Garnkel 2002). Thus, the OCSE measures for current and former welfare cases may be better indicators of state CSE. We create these measures accordingly, in addition to the OCSE measures for current welfare cases.
For CPS measures, both numerators (number of families on welfare receiving child support and amount received) and the denominator (number of families on welfare) are from CPS.2The major weaknesses of the CPS measures are the small sample size of single mothers in many states and the underreporting of welfare re-ceipt. Sample sizes are smallest and sampling error greatest for the proportion of welfare cases receiving child support. This problem is more serious after 1996 when welfare caseloads dropped substantially. In the 1999 CPS, there are 773 cases of single-mother families on welfare. About 26 states report numbers of families on welfare as fewer than 10 cases. The underreporting of welfare receipt in the CPS is a well-known problem and one that leads to identifying a welfare sample with error. To reduce the impact of sampling and reporting error, we utilize three-year moving averages for CPS measures. In addition welfare recipients receive at most $50 per month in child support before 1996 and, in most states, receive zero payment after
1996. These families may underreport receipt of child support because the child support payment comes not as a separate check, but as an addition to their welfare check. Finally, we calculated collection effectiveness, child support collection amount divided by the child support amount owed under the Wisconsin guideline, from CPS. Because we need the micro data to match the guideline amount for a given family, we are unable to calculate this variable from the aggregate data in the OCSE reports.
In addition to CPS measures for families on welfare, we calculate the same vari-ables for never-married mothers. Compared to divorced mothers, never-married mothers are more economically disadvantaged and more likely to be on welfare (U.S. House of Representatives 2000). In addition, the number of never-married mothers increases over time and is, therefore, less likely to suffer from sampling error in later years. In the 1999 CPS, 1,917 cases of never-married mothers were sampled and only one state reported cases fewer than 10. The CPS measures for never-married mothers may provide better assessments of state CSE than the CPS measures for families on welfare.
Thus, both the OCSE and CPS measures suffer from measurement errors, the CPS measure is subject to sampling error, while the OCSE measures may have re-porting errors. The measurement errors of the variables may be a reason that CSE does not have consistent results in previous studies (Case 1998; Sorensen and Hal-pern 1999; Freeman and Waldfogel 2001; Garnkel, Heintze, and Huang 2001; Gar-nkel et al. 2003; Huang, Han, and GarGar-nkel 2003). That measurement errors exist on individual measures highlights the importance of creating a CSE index that con-siders more than one measure. In this paper, we create a new CSE index, which consists of the summative rating of standardized scores of child support variables, to represent state CSE vigor. We also test the robustness of our results to alternative indices (please see results section for discussion of the different CSE indices).
For welfare variables, maximum AFDC/TANF benets for a four-person family were collected from various Green Books. Average Medicaid expenditures for a family with one adult and two children came from the Health Care Financing Admin-istration. Following the 1999 CEA study, the welfare waivers include six major types of waivers: termination time limits, work requirement time limits, family caps, JOBS exemptions, JOBS sanctions, and the earnings disregard. A dummy variable is cre-ated to indicate whether a state had any major waiver implemented by the survey year. Although TANF came into effect in September 1996, the actual implementation date varied among states. Like the 1999 CEA study, we used state actual date of TANF implementation, and turned off the welfare waiver indicator once states imple-mented TANF. A dummy variable is created to indicate whether a state impleimple-mented TANF by the survey year. Data on the dates of state welfare waivers and TANF implementation come from the 1999 CEA study.
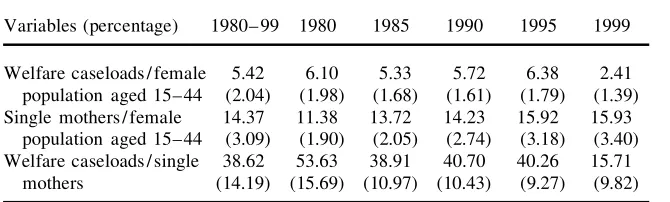
Table 1
Welfare Caseloads and Participation
Variables (percentage) 1980– 99 1980 1985 1990 1995 1999
Welfare caseloads / female 5.42 6.10 5.33 5.72 6.38 2.41 population aged 15–44 (2.04) (1.98) (1.68) (1.61) (1.79) (1.39) Single mothers / female 14.37 11.38 13.72 14.23 15.92 15.93
population aged 15–44 (3.09) (1.90) (2.05) (2.74) (3.18) (3.40) Welfare caseloads / single 38.62 53.63 38.91 40.70 40.26 15.71
mothers (14.19) (15.69) (10.97) (10.43) (9.27) (9.82)
Note: Unit is state. Standard errors appear in the parentheses
wages were computed from the 1980– 99 CPS. Unemployment rates were taken from the Statistical Abstract, U.S. Census Bureau. Political variables include the party afliation of the governor and the majority party of the state House and state Senate, collected from the Book of States reports.
We use annual data because our CPS gures and some aggregate data are only available at the annual level. Data were complete for every variable for each state and year. The nal sample consists of 1,000 observations— 50 states for 20 years, 1980 to 1999.3 Variables expressed in dollars were collected as nominal amounts, and converted to real (constant) 1999 dollars using the consumer price index.
V. Results
A. Descriptive Results
Means and standard deviations of welfare caseloads and state CSE variables are listed in Table 1 and 2. The welfare caseload rate—a state’s welfare caseload divided by its female population aged 15 to 44— is around 6 percent over the 1980– 95 period and then falls to 2.4 percent in 1999. The rate is affected both by the proportion of females who are single mothers and the proportion of single mothers who participate in welfare, and the trends in these variables are quite different. The proportion of females who are single mothers increases steadily, but at a decreasing rate. By way of contrast, the proportion of single mothers who receive welfare declines over the period, except for periods of economic recession.
For state CSE, it is evident that states have stricter child support legislation, allo-cate more expenditures for enforcement, and collect more child support payments over time. Different measures have different rates of increase. The trends in some measures, however, indicate they may not be appropriate indicators of state CSE.
For example, child-support expenditure per OCSE current welfare cases increases almost six times over the period while other per capita child- support measures in-crease less than three times. The large inin-crease in OCSE current welfare case measure is mainly because of the substantial reduction in OCSE current welfare cases after 1996. The collection rate also shows substantial increases for both OCSE and CPS measures before 1996, but shows different trends after 1996. For CPS measures of mothers on welfare, the collection rate declines, while OCSE measures and CPS measures of never-married mothers continually increase. The decline in CPS mea-sures of mothers on welfare may partly be due to more advantaged mothers moving out of caseloads after 1996, thus increasing the proportion of the most disadvantaged cases (who are less likely to receive child support payments), and partly due to sampling errors given the small sample sizes after 1996. In contrast, the high OCSE collection rates in 1999, 30 percent for current welfare mothers and 39 percent for current and former welfare mothers, may suggest OCSE improved their child support collection on current and former welfare cases after 1996, but may also be due to measurement and reporting errors of OCSE (Guyer, Miller, and Garnkel 1996). These ndings, again, highlight that an individual child support variable may not be a good indicator of state CSE vigor. Finally, the collection effectiveness and level of child support payments relative to maximum welfare benets show substantial increases for both CPS and OCSE measures.
As mentioned earlier, we create a CSE index to represent state CSE vigor. Because we are less condent of OCSE measures of current welfare mothers, our preferred index is composed of the summative rating of standardized scores of 13 child support variables in Table 2: Child support legislation (Variable 1), child support expenditure per OCSE current and former welfare cases (Variable 4), three OCSE collection measures of current and former welfare cases (Variables 6–8), and all eight CPS collection measures (Variables 12–19) (please see next section for discussion of the different CSE indexes). The Cronbach’s alpha of this index is 0.92 and indicates high reliability of the index.
State environments changed over the period as well (shown in appendix). Some of these changes, such as the decrease in wage rates, are expected to increase case-loads. Other changes, such as the decrease in AFDC/TANF benets, implementation of welfare waivers and TANF, and increase in education attainment, are expected to decrease caseloads. In short, welfare caseloads uctuate over the period, and this is accompanied by improvements in CSE and changes in states’ welfare and socio-economic environments. The decline in welfare participation among single mothers and the rate of growth of female headship are consistent with the hypothesis that improvements in CSE have led to decreases in welfare caseloads. These simple time trends, however, do not control for the effects of other variables or for the differences across states and time.
T
h
e
Journal
of
H
um
an
R
es
ourc
es
Table 2
Measures of State Child Support Enforcement
Variables All 1980 1985 1990 1995 1999
1. Child support legislationa* 3.72 0.28 1.02 3.90 6.92 7.78
(2.98) (0.50) (1.15) (1.09) (0.98) (0.42) Child support expenditure per capita
2. Per single-mother family 296 174 183 301 478 489 (178) (109) (104) (128) (248) (197) 3. Per OCSE total caseload 186 197 161 177 219 257 (99) (197) (98) (63) (97) (93) 4. Per OCSE current and former welfare cases * 326 253 226 306 462 418 (214) (276) (160) (148) (242) (174) 5. Per OCSE current welfare cases 501 253 226 461 670 1468 (425) (276) (160) (223) (347) (663) Child support (CS) Implementation
Current and former welfare mothers, OCSE
6. Percent of mothers with CS payment (CSP) * 15.54 13.99 13.00 13.33 16.84 38.87 (10.42) (11.78) (11.66) (6.39) (7.33) (13.61)
7. Average CSP * 279 169 206 261 334 726
(201) (175) (172) (141) (140) (365) 8. Average CSP / maximum welfare benets * 0.04 0.02 0.03 0.04 0.06 0.13
(0.04) (0.02) (0.02) (0.02) (0.02) (0.06) Current welfare mothers, OCSE
9. Percent of mothers with CSP 14.88 13.79 12.98 14.82 15.75 29.58 (9.62) (11.29) (11.65) (6.91) (7.09) (16.55)
10. Average CSP 462 343 318 511 542 526
H
ua
n
g,
G
ar
nkel
and
W
al
d
fog
el
121
Welfare Mothers, CPS
12. Percent of mothers with CSP * 17.47 8.99 10.11 19.93 26.09 20.62 (10.64) (6.37) (5.40) (11.17) (10.14) (11.77)
13. Average CSP * 252 182 166 228 318 386
(210) (144) (113) (166) (178) (366) 14. Ratio of CS collections to CS guidelines * 0.07 0.05 0.05 0.06 0.10 0.10
(0.06) (0.04) (0.03) (0.03) (0.07) (0.10) 15. Average CSP / maximum welfare benets * 0.04 0.02 0.03 0.04 0.06 0.07
(0.04) (0.02) (0.02) (0.02) (0.04) (0.07) Never-married mothers, CPS
16. Percent of mothers with CSP * 12.53 5.14 7.01 13.30 19.15 21.09 (8.55) (5.45) (4.35) (6.89) (7.06) (7.83)
17. Average CSP * 235 94 127 223 367 521
(203) (119) (96) (124) (201) (270) 18. Ratio of CS collections to CS guidelines * 0.08 0.03 0.04 0.08 0.13 0.13
(0.06) (0.04) (0.04) (0.04) (0.06) (0.06) 19. Average CSP / maximum welfare benets * 0.04 0.01 0.02 0.03 0.07 0.10
(0.04) (0.02) (0.02) (0.02) (0.04) (0.06)
Preferred CSE Index 0.00 20.60 20.50 20.06 0.55 1.21 (0.72) (0.36) (0.38) (0.39) (0.54) (0.82)
Note: Unit is state. Standard errors appear in parentheses. All dollars amounts are in 1999 dollars. a. Child support legislation is the sum of indicators for eight child support laws.
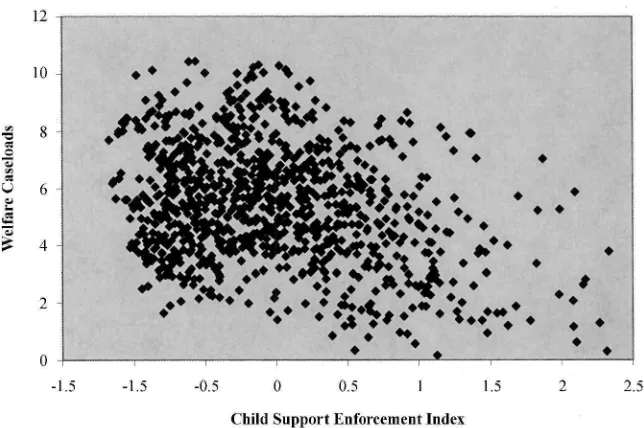
Figure 1
Welfare Caseloads and Child Support Enforcement (r5 20.33)
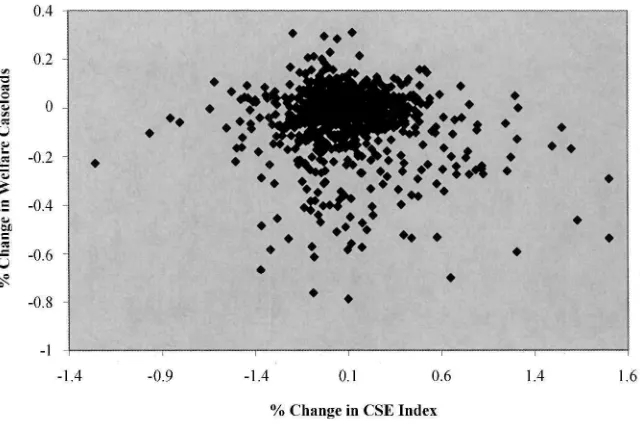
a strong negative relationship between state welfare caseloads and CSE. Once state-xed effects are removed by examining percentage changes in these variables in Figure 2, the negative relationship between welfare caseloads and CSE is still strong but decreases substantially, with a correlation of20.11 (p,.01). We explore these relationships further in the next section in the context of multivariate analyses.
1. Regression Results
Figure 2
Percentage Change in Welfare Caseloads and Child Support Enforcement (r 5 20.11)
T
h
e
Journal
of
H
um
an
R
es
ourc
es
Table 3
Determinants of State Welfare Caseloads, 1980–99
Model 1 Model 2
Robust Robust
Variable b Standard Errors P b Standard Errors P
Child support enforcement index — — 24.43 1.98 **
Unemployment rate 0.20 0.63 0.09 0.63
Unemployment rate,t21 1.41 0.66 ** 1.40 0.66 ** Unemployment rate,t22 2.95 0.58 *** 2.89 0.57 *** Log (male tenth-percentile wage) 250.14 10.79 *** 251.64 10.82 *** Log (female tenth-percentile wage) 232.59 11.57 *** 234.20 11.46 ** Log (maximum welfare benets) 24.88 14.36 * 24.01 14.35 * Log (yearly Medicaid benet level) 1.82 2.02 1.97 1.92 Any major waiver implemented 20.07 0.03 ** 20.07 0.03 * TANF implemented 20.10 0.06 * 20.09 0.06 1 Republican governor 20.05 0.01 *** 20.06 0.01 *** Both state senate and house Democratic 0.04 0.02 * 0.04 0.02 *
Percent black 29.33 6.09 1 29.89 6.07 1
Percent with less than high school education 20.31 1.00 20.27 0.99 Percent immigrantst21 2.76 3.97 3.37 3.90
State and year effects Yes Yes
State time trends Yes Yes
R2 0.910 0.911
Political variables matter, too. Having a Republican governor substantially reduces caseloads, by 5 percent, while having both the state House and Senate controlled by Democrats increases caseloads by 4 percent. These ndings suggest that Republican governors and Democratic legislators are able to shape administrative processes to affect caseloads.
Turning to the CSE index, our main independent variable, we see this has a strong and negative effect on welfare caseloads in Model 2. Using the improvement of CSE over the 1980 to 1999 period, this coefcient predicts a 9 percent reduction in caseloads. That is, without the improvement in CSE over this period, the actual welfare caseloads would be about 9 percent higher in 1999. Including state CSE does not notably change the ndings from Model 1. This suggests that models that omit CSE will probably not yield greatly biased coefcients.
T
h
e
Journal
of
H
um
an
R
es
ourc
es
Table 4
Robustness Tests of Child Support Enforcement
Model 1 Model 2
Robust Robust
Variable b Standard Errors P b Standard Errors P
CSE index
Preferred Index: 1, 26.90 2.09 *** 24.43 1.98 ** 4, 6–8, and 12–19.
Alternative Index 24.89 1.70 *** 22.63 1.53 * A: 1, 4, 12–19.
Alternative Index 25.74 2.31 ** 25.05 2.38 ** B: 1, 4, and 6–8.
Alternative Index 29.07 2.15 *** 26.45 2.20 *** C: 1, 4, 6–8, and 16–19.
Alternative Index 26.43 2.08 *** 23.65 1.99 * D: 1, 3, 6–8, and 12–19.
Alternaive Index 27.08 1.86 *** 24.36 1.81 ** E: 1, 5, 9–19.
Alternative Index 26.03 1.58 *** 23.30 1.63 ** F: 1, and 16–19.
Individual CSE variable
1. Child Support Legislation 21.91 0.61 *** 20.79 0.63 Log (child support expenditure per capita)
H
ua
n
g,
G
ar
nkel
and
W
al
d
fog
el
127
5. Per OCSE current welfare cases 29.33 2.02 *** 29.04 2.05 *** Current and former welfare mothers, OCSE
6. Percent of Mothers with Child Support Payment (CSP) 20.09 0.12 0.08 0.11 7. Log (Average CSP) 22.47 1.82 24.16 2.08 ** 8. Average CSP / welfare benets 22.17 0.71 *** 21.91 0.70 *** Current welfare mothers, OCSE
9. Percent of mothers with CSP 20.13 0.11 20.10 0.11 10. Log (Average CSP) 0.75 2.39 1.45 2.99 11. Average CSP / welfare benets 20.33 0.37 0.02 0.40 Welfare mothers, CPS
12. Percent of mothers with CSP 20.19 0.10 * 20.13 0.09 13. Log (average CSP) 0.45 0.89 0.13 0.62 14. Collection effectiveness 20.17 0.12 1 20.16 0.12 15. Average CSP / welfare benets 20.15 0.24 0.17 0.20 Never-married mothers, CPS
16. Percent of mothers with CSP 20.46 0.14 *** 20.38 0.14 ** 17. Log (average CSP) 20.86 0.43 ** 21.35 0.39 *** 18. Collection effectiveness 20.67 0.20 *** 20.50 0.19 ** 19. Average CSP / welfare benets 21.01 0.30 *** 20.35 0.30
State time trends No Yes
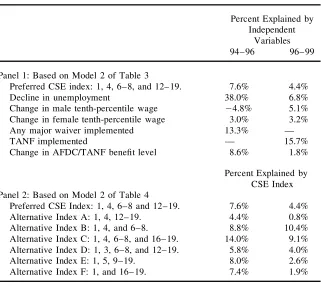
Table 5
Simulation of Recent Caseload Changes
Percent Explained by Independent
Variables
94–96 96–99
Panel 1: Based on Model 2 of Table 3
Preferred CSE index: 1, 4, 6–8, and 12–19. 7.6% 4.4%
Decline in unemployment 38.0% 6.8%
Change in male tenth-percentile wage 24.8% 5.1%
Change in female tenth-percentile wage 3.0% 3.2%
Any major waiver implemented 13.3% —
TANF implemented — 15.7%
Change in AFDC/TANF benet level 8.6% 1.8%
Percent Explained by CSE Index Panel 2: Based on Model 2 of Table 4
Preferred CSE Index: 1, 4, 6–8 and 12–19. 7.6% 4.4%
Alternative Index A: 1, 4, 12–19. 4.4% 0.8%
Alternative Index B: 1, 4, and 6–8. 8.8% 10.4%
Alternative Index C: 1, 4, 6–8, and 16–19. 14.0% 9.1%
Alternative Index D: 1, 3, 6–8, and 12–19. 5.8% 4.0%
Alternative Index E: 1, 5, 9–19. 8.0% 2.6%
Alternative Index F: 1, and 16–19. 7.4% 1.9%
likely to be corrupted by sampling and reporting errors, particularly after 1996, and may not be a good indicator of state CSE on its own.
2. Relative Importance of Child Support Enforcement
The results from Tables 3 and 4 are used to calculate the importance of CSE, as well as other variables, in explaining recent caseload declines between 1994 and 1996 (the waiver period) and 1996– 99 (the TANF period). Specically, the change in each variable is multiplied by its relative coefcient in Tables 3 and 4 to determine the changes induced by that factor. The ratio of the share of this change to the total change in welfare caseloads during this period is reported in Table 5. In results not shown, we found adding CSE into the model increases the percentage of variance explained by the independent variables, although it does not substantially change the estimated proportion explained by other variables.
factor and explains about 38 percent of the decline. Both male and female tenth-percentile wage decline in this period and contribute to an increase, rather than de-crease, in the caseloads. For example, male tenth-percentile wage was reduced from $6.80 in 1994 to $6.73 in 1996 (both in 1999 dollars) and led to a 0.6 percent increase in caseloads, which is about a 24.8 percent of the caseload decline in this period (0.6/212.5). Implementing a major welfare waiver contributes to a 13 percent of the decline, and the decline in AFDC benets explains 9 percent of the decline. For CSE, the preferred index on its own explains about 8 percent of the caseload decline. The estimates from alternative indices range from 4 to 14 percent. The wide range is largely due to the different improvements of individual child support variables over time. With respect to the 1996 to 1999 period, the overall caseloads are reduced by 59 percent. The decline in the unemployment rate and the increase in both male and female wages explain 15 percent of the decline, while implementation of TANF explains 16 percent of the decline. The CSE index contributes to 4 percent of the decline, while the estimates of alternative indexes range from 1 to 10 percent. The fact that less variance explained is by the independent variables over the 1996 to 1999 period warrants further research on this period.
The estimates of the caseload reduction attributed to welfare waivers and TANF implementation found here are lower than the ones found in the CEA study (1999). For example, the CEA study attributed 15 percent of the caseload reduction in the waiver period to welfare waiver and 36 percent of the reduction in the TANF period to TANF implementation, while our estimates are 13 and 16 percent respectively. In contrast, we found a bigger impact of macroeconomic factors than the CEA study. About 17 percent of the reduction in the waiver period was attributed to macroeco-nomic factors in the CEA study. The estimate found in this study is 30 percent. As mentioned earlier, the CEA’s model did not include a rich set of socioeconomic covariates and tend to overestimate the impacts of welfare waivers and TANF imple-mentation and underestimate the effects of other variables.
VI. Conclusion
Previous research on the determinants of welfare caseloads has not incorporated the effects of CSE. This is regrettable because legislators passed laws to strengthen enforcement with the expectation that stronger CSE would reduce wel-fare costs and caseloads. Furthermore, their expectations were not unreasonable: There are good theoretical reasons and relatively strong empirical support for the belief that strong enforcement reduces welfare caseloads by deterring entrances into and promoting exits from welfare and by deterring divorce and nonmarital births. Finally, CSE among current and former welfare families has improved dramatically in recent years.
inclusion of CSE improves the ability to explain the changes in welfare caseloads that would not be explained by welfare and/or economic factors alone. This paper also provides evidence that individual child support variables may not be good indi-cators of state CSE vigor and that a CSE index that includes multiple dimensions of CSE is less likely to suffer from the measurement errors of individual variables and is more likely to capture the multiplicative functions of CSE.
H
ua
n
g,
G
ar
nkel
and
W
al
d
fog
el
131
Variables 1980–99 1980 1985 1990 1995 1999
Unemployment (percent) 6.23 6.76 7.07 5.35 5.23 4.11
(2.19) (1.63) (1.93) (1.11) (1.36) (1.01) Male tenth-percentile wage ($ real 1999) 7.15 8.14 7.26 7.00 6.74 7.13
(1.05) (1.19) (1.09) (1.04) (0.70) (0.79) Female tenth-percentile wage ($ real 1999) 5.22 5.34 5.20 5.13 5.22 5.49
(0.59) (0.53) (0.61) (0.75) (0.52) (0.52) Yearly maximum welfare benets ($ real 1999) 6884 8514 7401 6936 6138 5739
(2646) (2993) (2636) (2646) (2331) (2173) Yearly Medicaid benet level ($ real 1999) 4445 3087 3356 4573 5527 5623 (1580) (847) (900) (1336) (1514) (1449) Any major welfare waiver implemented (percent) 5.4 0.00 0.00 0.00 38.00 0.00
(22.6) (0) (0) (0) (49.0) (0)
TANF implemented (percent) 17.3 0.00 0.00 0.00 0.00 100
(37.84) (0) (0) (0) (0) (0.00)
Party of governor (Republican51) (percent) 43.8 34.00 30.00 44.00 38.00 64.00 (49.63) (47.8) (46.3) (50.1) (49.0) (48.5) Both state senate and house Democratic (percent) 59.2 68.00 70.00 60.00 54.00 44.00 (49.2) (47.1) (46.3) (49.5) (50.3) (50.1) Female population aged 15–44 (1,000) 1149 1054 1111 1167 1198 1223
(1253) (1110) (1202) (1298) (1333) (1363)
Percent black 9.36 9.02 9.22 9.36 9.58 9.71
(9.16) (9.12) (9.15) (9.19) (9.36) (9.49) Percent with less than high school education 23.55 32.53 28.41 23.71 17.16 15.47
(8.22) (7.57) (6.56) (5.63) (4.80) (4.44)
New immigrants (1,000) 16 10 11 30 14 13
(47) (23) (27) (101) (31) (28)
References
Bane, Mary J., and David Ellwod. 1986. “Slipping Into and Out of Poverty: The Dynamics of Spells.”Journal of Human Resources 21(1):1– 23.
———. 1994.Welfare Realities: From Rhetoric to Reform.Cambridge: Harvard Univer-sity Press.
Blank, Rebecca M. 2001. “What Causes Public Assistance Caseloads to Grow?”Journal of Human Resources36(1):85– 118.
———. 2002. “Evaluating Welfare Reform in the United States.”Journal of Economic Lit-erature40(4):1105– 66.
Blau, Francine, Lawrence Kahn, and Jane Waldfogel. 1999. “Does Welfare Inuence Young Women’s Marriage, Single Parenthood, and Female Headship Decisions?” Work-ing paper, Columbia University.
Case, Anne. 1998. “The Effects of Stronger Child Support Enforcement on Nonmarital Fer-tility.” InFathers Under Fire: The Revolution in Child Support Enforcement,ed. Irwin Garnkel, Sara McLanahan, Daniel Meyer, and Judith A. Seltzer, 191–215. New York: Russell Sage Foundation.
Congressional Budget Ofce. 1993. “Forecasting AFDC Caseloads, with an Emphasis on Economic Factors.” Staff memorandum. July. Washington, D.C.:CBO.
Council of Economic Advisers. 1997. “Technical Report: Explaining the Decline in Wel-fare Receipt, 1993– 1996.” Executive Ofce of the President of the United States. Wash-ington, D.C.
———. 1999. “Technical Report: The Effects of Welfare Policy and the Economic Expan-sion on Welfare Caseloads: An Update.” Executive Ofce of the President of the United States. Washington, D.C.
Freeman, Richard, and Jane Waldfogel. 2001. “Dunning Delinquent Dads: The Effect of Child Support Enforcement Policy on Child Support Receipt by Never Married Women.”Journal of Human Resources 36(2):207– 25.
Figlio, David, and James Ziliak. 1999. “Welfare Reform, the Business Cycle, and the De-cline in AFDC Caseloads.” InEconomic Conditions and Welfare Reform, ed. Sheldon H. Danziger, 17–48. Michigan: W. E. Upjohn Institute for Employment Research. Garnkel, Irwin, Daniel Meyer, and Sara McLanahan. 1999. “A Brief History of Child
Support Policies in the United States.” InFathers Under Fire: The Revolution in Child Support Enforcement, ed. Irwin Garnkel, Sara McLanahan, Daniel Meyer, and Judith A. Seltzer, 14– 30. New York: Russell Sage Foundation.
Garnkel, Irwin, Theresa Heintze, and Chien-Chung Huang. 2001. “The Effect of Child Support Enforcement on Women’s Income.” InThe Incentives of Government Programs and the Well-Being of Families, ed. Bruce Meyer and Greg Duncan, 1–25 (chapter 9). Chicago: Joint Center for Poverty Research.
Garnkel, Irwin, Philip P. Robins, Patrick Wong, and Daniel Meyer. 1990. “The Wiscon-sin Child Support Assurance System: Estimated Effects on Poverty, Labor Supply, Case-loads, and Costs.”Journal of Human Resources25(1):1– 31.
Garnkel, Irwin, Chien-Chung Huang, Sara McLanahan, and Daniel Gaylin. 2003. “Will Child Support Enforcement Reduce Non-Marital Childbearing?” Journal of Population Economics16 (1):55– 70.
Grogger, Jeffrey. Forthcoming. “The Effects of Time Limits, the EITC, and Other Policy Changes on Welfare Use, Work, and Income Among Female-Headed Families.”Review of Economics and Statistics.
Sup-port Enforcement Data to Rank the States: A Cautionary Note.”Social Service Review
70(4):635– 52.
Hoynes, Hilary W. 2000. “Local Labor Markets and Welfare Spells: Do Demand Condi-tions Matter?”Review of Economics and Statistics 82(3):351– 68.
Huang, Chien-Chung. 2002. “The Impact of Child Support Enforcement on Nonmarital and Marital Births: Does It Differ by Racial and Age Groups?”Social Service
Re-view76(2):275– 301.
Huang Chien-Chung, James Kunz, and Irwin Garnkel. 2002. “The Effect of Child Sup-port on Welfare Exits and Re-Entries.” Journal of Policy Analysis and Management
21(4):557– 76.
Huang, Chien-Chung, and Ronald B. Mincy. 2002. “Marriage Promotion: Are Men Marriageable?” Paper presented in the 42nd Annual Workshop of the National Associa-tion for Welfare Research and Statistics, Albuquerque, New Mexico, August 25–28, 2002.
Huang, Chien-Chung, Wen-Jui Han, and Irwin Garnkel. 2003. “Child Support Enforce-ment, Joint Legal Custody, and Parental Involvement.” Social Service Review77(2): 255-78.
Hutchins, Robert M. 1981. “Entry and Exit Transitions in a Government Transfer Program: The Case of Aid to Families with Dependent Children.”Journal of Human Resources 16(2):217– 37.
Legler, Paul. 1996. “The Coming Revolution in Child Support Policy: Implications of the 1996 Welfare Act.”Family Law Quarterly30(3):519– 63.
Lerman, Robert, and Elaine Sorensen. 2000. “Child Support: Interactions between Private and Public Transfers.” Paper presented at the NBER Conference on Means-Tested Trans-fer Programs in the U. S. May 11–12, 2000. Boston, Mass.
Klerman, Jacob A., and Steven J. Haider. 2001. A Stock-Flow Analysis of the Welfare Caseload: Insights from California Economic Conditions. Working Paper Series 01– 02, Labor and Population Program, RAND.
Meyer, Daniel R. 1993. “Child Support and Welfare Dynamics: Evidence from Wiscon-sin.”Demography 30(1):45– 62.
Moftt, Robert. 1992. “Incentive Effects of the U.S. Welfare System: A Review.” Journal of Economic Literature30(March):1– 61.
———. 1999. “The Effects of Pre-PRWORA Waivers on AFDC Caseloads and Female Earnings, Income, and Labor Force Behavior.” InEconomic Conditions and Welfare Re-form, ed. Sheldon H. Danziger, 91–118. Michigan: W. E. Upjohn Institute for Employ-ment Research.
Nixon, Lucia A. 1997. “The Effect of Child Support Enforcement on Marital Dissolution.” Journal of Human Resources32(1):159– 81.
O’Neill, June E., and M. Anne Hill. 2001. “Gaining Ground? Measuring the Impact of Welfare Reform on Welfare and Work.” Civic Report No. 17, Center for Civic Innova-tion. New York: Manhattan Institute.
Rector, Robert E., and Sarah E. Youssef. 1999. “The Determinants of Welfare Caseload Decline.” The Heritage Foundation Paper # CDA99204. Washington, DC: The Heritage Foundation.
Robins, Philip. 1986. “Child Support, Welfare Dependency, and Poverty.” The American Economic Review76(4):768– 88.
Robins, Philip, and Katherine Dickinson. 1985. “Child Support and Welfare Dependence: A Multinominal Logit Analysis.” Demography22(3):367– 80.
Sorensen, Elaine, and Ariel Halpern. 1999. “Child Support Enforcement: How Well Is It Doing?” Urban Institute. Discussion papers 99–11.
U.S. House of Representatives, Committee on Ways and Means. 2000. Overview of Entitle-ment Programs. 2000 Green Book. Washington, D.C.: GPO.
U.S. Department of Health and Human Services, Ofce of Child Support Enforcement. 1980– 99. Child Support Enforcement: Annual Report to Congress. Washington, D.C.: The Department of Health and Human Services, Administration for Children and Fami-lies.
U.S. Department of Health and Human Services. 2002. Data on Temporary Assistance for Needy Families, 1997– 1999. Ofce of Planning, Research and Evaluation.(http:// www.acf.dhhs.gov/ programs/ opre/tanfdata/ caseload/ tanfcaseload.htm) Data retrieved on October 2002.
Wallace, Geoffrey, and Rebecca Blank. 1999. “What Goes Up Must Come Down?” In Eco-nomic Conditions and Welfare Reform, ed. Sheldon H. Danziger, 49– 90. Michigan: W. E. Upjohn Institute for Employment Research.
Wolk, James L., and Sandra Schmahl. 1999. “Child Support Enforcement: The Ignored Component of Welfare Reform.”Families in Society80(5):526– 30.
Willis, Robert J. 1999. “A theory of out-of-wedlock childbearing.” Journal of Political Economy107(6):33– 64.