Full Terms & Conditions of access and use can be found at
http://www.tandfonline.com/action/journalInformation?journalCode=cbie20
Download by: [Universitas Maritim Raja Ali Haji] Date: 18 January 2016, At: 00:25
Bulletin of Indonesian Economic Studies
ISSN: 0007-4918 (Print) 1472-7234 (Online) Journal homepage: http://www.tandfonline.com/loi/cbie20
Survey of recent developments
Susan Olivia & Chikako Yamauchi
To cite this article: Susan Olivia & Chikako Yamauchi (2012) Survey of recent developments, Bulletin of Indonesian Economic Studies, 48:2, 143-171, DOI: 10.1080/00074918.2012.694150 To link to this article: http://dx.doi.org/10.1080/00074918.2012.694150
Published online: 27 Jul 2012.
Submit your article to this journal
Article views: 359
View related articles
ISSN 0007-4918 print/ISSN 1472-7234 online/12/020143-29 © 2012 Indonesia Project ANU http://dx.doi.org/10.1080/00074918.2012.694150
SURVEY OF RECENT DEVELOPMENTS
Susan Olivia Chikako Yamauchi
Monash University, National Graduate Institute
Melbourne for Policy Studies, Tokyo
SUMMARY
It is evident that President Susilo Bambang Yudhoyono and the party he leads are becoming increasingly unpopular. Several senior party igures are embroiled in cor-ruption scandals. Moreover, the president was forced into a humiliating reversal on the proposed decrease in oil subsidies when the government’s coalition partners refused to support it.
Economic growth slowed moderately in the irst quarter of 2012 as export and import growth decelerated, but the overall economic growth rate nevertheless remained robust at 6.3%. Inlation has been rising since February but is still within Bank Indonesia’s target range. While the current account remains in deicit, capital inlows are growing. The rupiah has come under pressure since the beginning of the year. Although macroeconomic indicators suggest that the economy is in good shape, recent policy initiatives could deter investment and curb economic growth. With income growth pushing up demand for fuel and the likelihood of fuel subsidy cuts fading, energy subsidies are likely to continue to weigh heavily on the budget. Expenditure on fuel subsidies is likely to come at the expense of other compelling public expenditure items such as social assistance and health. For Indonesia to reach its objective of higher yet inclusive growth, the government will need to ind a way to reduce subsidies and to increase the allocation of government spending for poverty reduction.
The government has put a range of social assistance programs in place to protect the poor and vulnerable. However, current methods of beneiciary selection and resource delivery suggest that targeting could be improved. The government is attempting to address this issue through the establishment of a national targeting system based on a recently completed, uniied database of poor households. For the system to be effec-tive, implementation issues must be addressed carefully.
The health system is likely to undergo major changes as Indonesia moves towards universal health insurance coverage. While the health status of Indo nesians continues to improve, several challenges remain, such as the inadequate supply of health ser-vices in remote areas and the low quality of health care. Among the changes that are needed are better systems to train and deploy health workers; an increase in public investment in health; a clearer deinition of the responsibilities of the central and local governments with regard to the deployment of health workers; and more effective incentive schemes to attract health care workers to remote areas.
POLITICAL DEVELOPMENTS
The popularity of the government led by President Susilo Bambang Yudho-yono (SBY) continues to decline, with the president’s Democratic Party (Partai Demokrat, PD) suffering further reputational damage from corruption scandals. More details of scandals highlighted in the previous survey (Mahi and Nazara 2012) have come to light, including the payment of kickbacks to PD members in relation to the construction of a sports complex in Hambalang, West Java. Naz -aruddin, the former treasurer of the party, claimed that party president Anas Urbaningrum had received Rp 50 billion in kickbacks, while Minister for Youth and Sport Andi Mallarangeng (the secretary of the party’s advisory board) had received Rp 20 billion (Gatra, 13/6/2012). An oficial from the Corruption Eradi -cation Commission (Komisi Pemberantasan Korupsi, KPK) disclosed that the total budgeted funds for the construction and outitting of the complex had risen to Rp 2.5 trillion, more than double the previously reported estimate of Rp 1.2 tril-lion (Gatra, 13/6/2012). There has been speculation that kickbacks could account for the gap between the two igures (Tempo, 28/5/2012).
To make matters worse, on 30 March 2012 two political allies of the SBY cabinet deied the government to vote against a controversial plan to reduce subsidies that would have increased fuel prices by 33% from 1 April (Republika, 31/3/2012). The Prosperous Justice Party (Partai Keadilan Sejahtera, PKS) rejected the pro -posal outright, while the Golkar party agreed to a compromise that would allow the government to reduce the subsidy if the Indonesian crude oil price (ICP) rose beyond a certain level during 2012 (see below).1 It seems that both parties were trying to improve their electoral fortunes by voting against this unpopular policy. These developments are signiicant because SBY has a relatively weak power base. From the outset of his presidency, he has had to forge a multi-party coalition to stay in power. Several polls show SBY’s approval rating – and that of PD – fall-ing. For example, the Indonesian Survey Institute (Lembaga Survei Indonesia, LSI) found that the president’s approval rating had dropped from 63% in Janu -ary 2010 to 46% in October 2011 (Jakarta Post, 16/10/2011). The igures for the party are equally discouraging. LSI reported that PD’s approval rating fell from 21% in January 2011 to 14% in January 2012, and then to just 11% in June 2012, with a large number of respondents citing concerns about corruption (Jakarta Post, 19/6/2012). The declining popularity of the president and his party should pro -vide encouragement to candidates considering standing for the parliamentary and presidential elections in 2014.
In another high-proile corruption case, in June 2012 KPK oficials detained a former senior deputy governor of Bank Indonesia (BI), Miranda Goeltom, for questioning after a four-year investigation into a vote-buying scandal. The case has already led to the imprisonment of over 30 current and former members of parliament, as well as Nunun Nurbaeti, a businesswoman and the wife of the
1 In late March Aburizal Bakrie, the chair of Golkar and a potential candidate in the 2014 presidential elections, had urged the president to reduce the fuel price subsidies. But sen-ior party igures denounced the comments, leading him to reverse his position (Reformasi Weekly, 1/6/2012). Despite this change of heart, in late May Bakrie was still maintaining that Indonesia could go bankrupt if the subsidised price for premium gasoline remained at its current level of Rp 4,500 per litre (detikFinance, 29/5/2012).
former deputy national police chief, Adang Daradjatun (Jakarta Globe, 1/6/2012).2 The parliamentarians were found to have received bribes in 2004 in the form of traveller’s cheques issued by Bank Internasional Indonesia. Bank Artha Graha, part of the Artha Graha business group controlled by prominent businessman Tomy Winata, ordered the cheques on behalf of palm oil company PT First Mujur Plantation and Industry. The cheques were supposed to pay for the purchase of a number of small plantations in North Sumatra, but somehow many of them ended up in the pockets of law makers.
The portfolio of the Artha Graha Group includes oil palm plantations, so when the allegations of bribery irst emerged, it was suspected that resource companies were seeking to inluence monetary policy in the expectation that a depressed exchange rate would help to expand their proit margins (Suara Merdeka, 28/1/2012). It has been alleged that Artha Graha distributed the traveller’s cheques to parliamentarians to secure the appointment of Goeltom as BI deputy governor; in return, she would be expected to provide inside information about the inancial system and monetary policy, particularly BI’s open market opera -tions and its sale and purchase of Bank Indonesia Certiicates (SBIs). Goeltom’s arrest and detention may lead investigators to higher-level actors in this bribery case, but it remains to be seen whether they will be brought to justice.
MACROECONOMIC DEVELOPMENTS AND POLICY Economic growth
Despite the impact of these and other corruption cases on the business environ-ment, Indonesia’s economic growth remained robust, with year-on-year GDP growth of 6.3% in the irst quarter of 2012 (table 1). This was slightly lower than the rate of about 6.5% recorded during the previous three quarters. The slowdown was partly due to a deceleration in export and import growth. Export growth fell from just under 18% in the third quarter of 2011 to 8% in the fourth quarter, and remained at 8% in the irst quarter of 2012. Similarly, the growth rate of imports declined from 14% to 10% in the last quarter of 2011, before falling further to 8% in the irst quarter of 2012.
The signiicantly lower growth of exports can be attributed to a decline in global commodity prices in response to weakening demand. The fall in commod-ity prices, together with slower economic growth among Indonesia’s main trad-ing partners, caused a slowdown in non-oil and gas exports (Danamon 2012b). It is clear that the prolonged crisis in the EU, the weak recovery in the US and the sustained economic anaemia in Japan are continuing to affect the Indonesian economy, calling for preparedness and caution on the part of policy makers.3 The weakening growth in exports could be a drag on GDP growth in 2012. As the
2 Nurbaeti was found guilty of funnelling Rp 20.8 billion in traveller’s cheques to law makers to secure Goeltom’s appointment to BI (Republika, 9/5/2012). She was sentenced to two and a half years in jail.
3 The risks to the Indonesian economy are likely to increase if the economic crisis in Eu -rope deepens. A recovery in the Eurozone has been thrown into uncertainty by the elec-tion in France and Greece of political parties that are opposed to the austerity measures required to contain the crisis (Economist, 7/5/2012).
government has identiied a 6.5% growth target for 2012, private consumption and investment will have to expand at higher rates than in the irst quarter to make up for any weakness in export growth.
Growth of investment spending declined from 12% in the last quarter of 2011 to 10% in the irst quarter of 2012, chiely because of a deceleration of investment in transport, as well as machinery and equipment. On the other hand, government consumption grew by almost 6%, in strong contrast to the igures of less than 3% recorded in the preceding two quarters. Private consumption growth remained unchanged at 4.9%. As private consumption accounts for almost 60% of GDP, continuing growth of the sector will be an important factor in alleviating the effect of a depressed global economy on GDP growth.
On the production side, growth in tradables rose from 4.3% in the last quarter of 2011 to 4.7% in the irst quarter of 2012, compared with a slight deceleration in non-tradables from 8.4% to 7.7%. Among the tradable sub-sectors, the growth rate of agricultural production increased from 1.9% to 3.9%, and that of mining and quarrying from –0.3% to 2.9%. This may be a relection of the rise in global commodity prices in early 2012 (Mahi and Nazara 2012: 10), although prices have
TABLE 1 Components of GDP Growth (2000 prices; % year on year)
Dec-10 Mar-11 Jun-11 Sep-11 Dec-11 Mar-12
Gross domestic product (GDP) 6.8 6.4 6.5 6.5 6.5 6.3
By expenditure
Private consumption 4.9 4.5 4.6 4.8 4.9 4.9
Government consumption 7.3 2.8 4.5 2.8 2.8 5.9
Investment 8.7 7.3 9.3 7.1 11.5 9.9
Construction 6.7 5.2 7.5 6.3 7.8 7.3
Machinery & equipment 22.6 19.9 19.9 12.4 20.5 15.3
Transport 2.0 5.6 6.3 5.6 35.6 28.2
Exports 16.5 12.2 17.2 17.8 7.9 7.8
Imports 17.1 14.4 15.3 14.0 10.1 8.2
By sector
Tradables 4.8 4.5 4.6 4.5 4.3 4.7
Agriculture, livestock,
forestry & isheries 4.1 3.7 3.6 2.6 1.9 3.9
Mining & quarrying 4.4 4.4 1.0 0.6 –0.3 2.9
Manufacturing 5.3 5.0 6.2 6.9 6.7 5.7
Non-tradables 8.6 8.2 8.2 8.2 8.4 7.7
Electricity, gas & water supply 4.4 4.3 3.9 5.2 5.8 6.1
Construction 6.7 5.2 7.5 6.3 7.8 7.3
Trade, hotels & restaurants 8.5 7.9 9.3 9.2 10.2 8.5
Transport 7.2 8.7 8.7 7.7 5.6 6.8
Communication 19.4 16.5 12.3 10.7 11.6 12.5
Financial, rental &
business services 6.0
7.0 6.7 6.9 6.7 6.3
Other services 7.5 7.0 5.7 7.8 6.5 5.5
Source: CEIC Asia Database.
declined since then.4 Despite slowing slightly from 6.7% to 5.7%, manufacturing output remained robust. This trend is likely to continue; after low growth in 2009, manufacturing exhibited a revival in 2010–11.5
Among the non-tradable sub-sectors, trade, hotels and restaurants as well as the remainder of services (comprising government and private services) experi-enced a slowing of growth. However, an increase in growth was observed for the electricity, transport and communication sub-sectors.
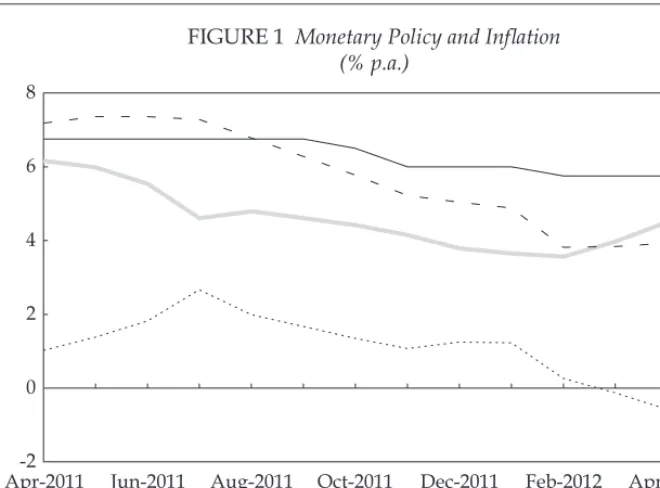
Inlation, monetary policy and the exchange rate
Indonesia’s annualised inlation rate rose from 3.97% in March to 4.50% in April, reaching a seven-month high (igure 1). Inlationary pressures increased despite a slight fall in food prices coinciding with the start of the rice harvest (BPS 2012). Public expectations of an increase in fuel prices, a major talking point during March and April (see below), may also have put pressure on inlation. In May, however, the inlation rate eased unexpectedly to 4.45%, giving the central bank a reason not to change interest rates.
BI left its policy rate unchanged at 5.75% in May after cutting the rate in Febru -ary to encourage lending and spur economic growth (BI 2012a). Given that inla -tion is still within the bank’s target range of 4.5% plus or minus 1%, BI is unlikely to use the policy rate as a tightening signal. In a previous survey, Kuncoro, Widodo
4 See the International Monetary Fund indices of primary commodity prices, available at <http://www.imf.org/external/np/res/commod/Table1.pdf>.
5 See, for example, Manning and Purnagunawan (2011: 307-8), Suryadarma and Sumarto (2011: 159) and Thee and Negara (2010: 286).
SBI = Bank Indonesia Certiicate.
Source: CEIC Asia Database.
FIGURE 1 Monetary Policy and Inlation (% p.a.)
Apr-2011-2 Jun-2011 Aug-2011 Oct-2011 Dec-2011 Feb-2012 Apr-2012 0
2 4 6 8
CPI 9-month SBI rate Real SBI rate Policy rate
and McLeod (2009: 161) described the policy rate as ‘ictitious’ because it does not apply to any security in the market. Instead, BI relies on its liquidity management tools – chiely its capacity to raise interest rates on other monetary instruments, and to absorb excess rupiah liquidity – to tame short-term inlationary pressures and support the exchange rate (BI 2012b).
BI’s main monetary policy instrument is the nine-month SBI rate. It fell from 50 basis points above the policy rate in July 2011 to 150 basis points below it in May 2012. As inlation has increased, the SBI rate has decreased in real terms. This should serve as a disincentive for banks to place their excess liquidity with the central bank, and allow BI to reduce the cost of monetary operations. The nine-month SBI rate fell from 4.8% in January to 3.9% in March before increasing to 4.2% in May.
On 16 March 2012, BI released new regulations on loan-to-valuation ratios for housing loans and minimum down-payments for motorcycle and car loans, to take effect in mid-June. The bank now requires a maximum 70% loan-to-valu -ation ratio for housing loans, excluding the government’s subsidised housing program. The regulation is aimed at houses with a minimum loor space of 70 square metres, so will mainly affect middle and upper-income households. BI also increased the minimum down-payments on vehicle purchases by as much as 25% for motorcycles and 30% for cars. These macro-prudential measures come at a time when overall loan growth is around 25% year-on-year, suggesting the need to curb excessive credit growth. It is unclear to what extent the new restrictions will be binding, however, as around two-thirds of recent loan growth has come from working capital and investment loans rather than consumer loans (Reuters, 16/3/2012; World Bank 2012a).
The new regulations are designed to avoid a property bubble and minimise credit risk while allowing the central bank to maintain a low interest rate regime. But BI’s cuts to interest rates at the same time as it is discouraging borrowing may be sending a mixed message to the public. The challenge for the central bank is to use the various policy instruments at its disposal in a consistent way to ensure that temporary inlation pressures do not translate into sustained increases in inlation or in inlation expectations. The latest regulations may signal that BI is exploring ways to tighten policy without lifting rates. Its prudential measures should tighten credit and rein in loan growth. At the same time, BI is seeking to sustain economic growth and contain inlation without raising its benchmark interest rate, which has remained steady at 5.75% since February. It took steps to reduce excess funds in the economy in May 2012, raising the rates on central bank bills and term deposits to absorb liquidity.
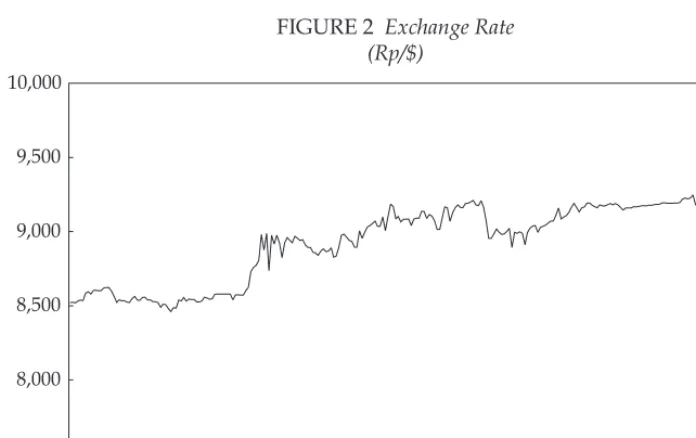
The rupiah has come under pressure since the beginning of the year (igure 2). It depreciated by 1.0% between the last quarter of 2011 and the irst quarter of 2012, moving from an average of Rp 8,972/$ to Rp 9,066/$. The depreciation was caused by a number of external factors that bore down on the domestic economy. Among them were the hard-fought negotiations over the details of a proposal to resolve the Greek debt crisis, the downgrading of sovereign debt for a number of European countries and uncertainty over Spain’s deicit target. In Asia, weaker growth in China dampened the prospects for exports from the rest of Asia to the world’s second-largest economy, in turn putting pressure on the exchange rate. Movement in the rupiah was also inluenced by domestic factors, particularly
inlation expectations sparked by uncertainty over the government’s subsidised fuel policy, and Standard & Poor’s decision in April 2012 to retain its positive outlook for the Indonesian economy, but to hold off on lifting its sovereign debt rating for the country. The latter decision disappointed observers, who had been encouraged by the recent upgrades of Indonesia’s sovereign long-term debt to investment grade by Fitch (in December 2011) and Moody’s (in January 2012).
The rupiah depreciation accelerated sharply in May, with the currency hitting Rp 9,570 on 30 May, its weakest level in 30 months. A lack of dollars caused by a rush to cash in rupiah assets exacerbated this slide (Bisnis Indonesia, 25/5/2012). In response, BI stepped up its market intervention to steady the exchange rate in the expectation that the escalating European crisis would continue to spur outlows from Indonesia. In May, the central bank announced that it would sell dollar-denominated term deposits to lenders to boost the supply of the US cur-rency locally and stabilise the rupiah. BI will offer seven-day, 14-day and one-month deposits at weekly auctions, allowing local lenders to bring back about $2 billion per day from offshore banks (BI 2012b; Jakarta Globe, 31/5/2012). This move is intended to provide an incentive for banks to place their offshore dollar liquidity onshore, thereby helping BI to increase dollar reserves in an effort to smooth out rupiah volatility.
Balance of payments
The latest balance of payments igures released by BI show that Indonesia recorded a third consecutive deicit in the irst quarter of 2012 (table 2).6 However, the size
6 It is important to note that the balance of payments data are announced as preliminary estimates. Because they are subject to revision, the latest releases should always be treated with caution.
Source: Datastream.
FIGURE 2 Exchange Rate (Rp/$)
8-Jun-2011 8-Aug-2011 6-Oct-2011 6-Dec-2011 3-Feb-2012 4-Apr-2012 4-Jun-2012 7,500
8,000 8,500 9,000 9,500 10,000
of the deicit fell from $3.7 billion in the last quarter of 2011 to $1 billion in the irst quarter of 2012, driven largely by surpluses in capital and inancial transactions that partially offset the widening of the current account deicit.
The current account deicit almost doubled in the irst quarter of 2012 to $2.9 billion because of increasing imports, particularly of oil and gas, and declining exports. The weakening in global demand for Indonesia’s exports, combined with lower commodity prices, accounted for the decline in the value of exports. Imports of capital goods and machinery remained irm, consistent with strong domestic demand. A fall in domestic crude oil production, coupled with rising consumption of oil-based fuels in a context of high international oil prices, led to a jump in the value of oil imports in the irst quarter of the year (BI 2012c).
The aggregate inancial account reveals signiicant inlows in the irst quar -ter amounting to $2.2 billion. Af-ter recording deicits in the previous two quar -ters, net portfolio inlows surged to $2.8 billion, driven mainly by purchases of foreign currency-denominated government securities, stocks and private sector debt securities. Levels of net foreign direct investment also remained healthy in the irst quarter of the year. The good performance of the inancial account was in line with positive market perceptions of Indonesia’s economic fundamentals
TABLE 2 Balance of Payments ($ billion per quarter)
Mar-11 Jun-11 Sep-11 Dec-11 Mar-12
Current account 2.7 0.1 0.5 –1.6 –2.9
Exports 45.9 51.7 52.3 50.6 48.2
Non-oil & gas 37.1 42.3 42.2 41.2 38.4
Oil & gas 8.8 9.4 10.1 9.5 9.8
Imports 36.9 42.7 42.9 44.2 44.7
Non-oil & gas 28.5 31.8 33.1 34.6 33.9
Oil & gas 8.4 10.9 9.8 9.6 10.9
Merchandise trade balance 9.0 9.1 9.4 6.4 3.5
Non-oil & gas 8.6 10.6 9.1 6.5 4.5
Oil & gas 0.4 –1.5 0.3 –0.1 –1.0
Services –1.8 –3.1 –2.6 –3.1 –2.0
Income –5.5 –6.8 –7.4 –6.1 –5.3
Current transfers 1.0 1.0 1.0 1.2 1.0
Capital account 0.0 0.0 0.1 0.0 0.0
Financial account 5.0 13.5 –3.5 –1.0 2.2
Direct investment 3.5 3.8 2.0 1.9 2.0
Portfolio investment 3.8 5.5 –4.7 –0.2 2.8
Other investment –2.3 4.2 –0.8 –2.8 –2.6
Errors & omissions 0.4 –1.8 –1.0 –1.2 –0.3
Overall balance 8.1 11.9 –4.0 –3.7 –1.0
Foreign reserves 105.7 119.7 114.5 110.1 110.5
Source: BI (2012c).
and outlook.7 Nevertheless, balance of payments risks remain. Further down -ward revisions of external demand, further decreases in commodity prices and additional shocks to global inancial markets are all key external risks that may impinge on the positive outlook for the economy.
Fuel subsidies
The issue of government subsidies for fuel came to a head in March in the context of the revision of the 2012 budget.8 The SBY administration had been aiming to reduce the subsidies for over a year but had struggled to persuade the parliament to approve this politically unpopular measure. The government planned to raise the price of petrol from the current price of Rp 4,500 to Rp 6,000 per litre in April 2012, but the parliament rejected this proposal. It did agree, however, to allow fuel prices to rise if the average Indonesian crude oil price (ICP) over a six-month period exceeded the oil price assumption in the government budget by more than 15%. Business representatives claimed that this decision contained too much political compromise and not enough economic resolve, and that it would create months of uncertainty for business as they waited to see if the ‘escape’ clause was triggered. Of course, with the eventual magnitude of fuel subsidies in doubt, the policy also creates uncertainty for the budget.
The SBY government has lost several chances to formulate a more sustaina-ble budget. It could have raised fuel prices in 2011 when asked to do so by Vice President Boediono and Finance Minister Agus Martowardojo (Straits Times, 1/5/2012), given that, under the 2011 budget legislation, it would not have needed parliamentary approval. The decision not to increase fuel prices was a missed opportunity to change spending priorities at a time when risks remain in the global environment.
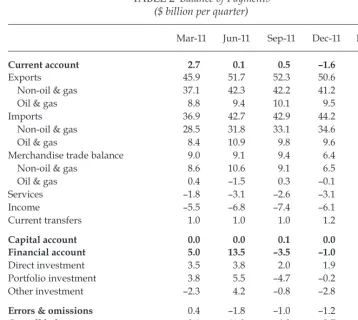
Figure 3 shows that international oil prices have been declining since late March. If this trend continues, there is little chance that the ICP will climb above the threshold of $120.75 per barrel required for parliament to consider a fuel price increase. If there is no fuel price rise this year, the budget deicit is likely to increase. This in turn would require the government to raise more funds from the debt market, leading to higher bond yields, which would increase the govern-ment’s borrowing costs.
Moreover, the government decided against the rationing of subsidised fuel based on vehicle type. Instead, it called for alternative measures such as con-servation by government entities, a prohibition on the use of subsidised fuel in the resources sector and the substitution of petroleum with other energy sources
7 For instance, in March 2012 the Organisation for Economic Co-operation and Develop -ment changed Indonesia’s country risk classiication from 4 to 3 (on a scale of 0 to 7, where 0 is the lowest level of risk). This means that Indonesia now has the same classiication as countries such as Thailand, Uruguay, South Africa, the Russian Federation, India, Brazil and Peru. Improved ratings imply a lower country risk premium and thus reduced costs of inancing for both the public and private sectors. The risk ratings are available at <http:// www.oecd.org/dataoecd/47/29/49487829.pdf>.
8 See past issues of the survey for details of the evolution of fuel subsidy policy in Indo-nesia (Manning and Purnagunawan 2011; McLeod 2011; Suryadarma and Sumarto 2011; Mahi and Nazara 2012).
(Kompas, 4/5/2012). Such measures will have virtually no effect on the cost to the government of high fuel subsidies. For instance, the government’s long-stand -ing goal of substitut-ing petroleum in both the transport and electricity sectors is highly laudable, but not economically feasible because of the existing price con-trols for fuel and electricity. Although Indonesia has ample energy reserves, the SBY administration has provided inadequate incentives for investors to develop these resources. Contractual uncertainty, unfavourable cost recovery rules and preferential treatment for the state oil enterprise, Pertamina, have all damp-ened investor interest in hydrocarbon exploration, such that oil production has languished and gas production is below its potential (Braithwaite et al. 2012; Reformasi Weekly, 4/5/2012).
There is still a scarcity of subsidised fuel outside Java, especially in Kalimantan, where long queues are commonplace at illing stations. In May, the governors of the oil-rich provinces of West, Central, South and East Kalimantan threatened to block coal exports to Java unless the government increased Kalimantan’s share of the nationwide quota of subsidised petrol and diesel (Bisnis Indonesia, 15/5/2012). The government agreed to increase the quota from 7% to 12% – far less than the 28% demanded by the governors. At the same time, drawing on a reserve fund in the revised 2012 budget equivalent to 2.5 million kilolitres of oil, the government decided to marginally increase the subsidised fuel allocation for all regions ( Refor-masi Weekly, 23/5/2012). The marginal increase in the subsidised petrol quota for Kalimantan may alleviate complaints in the short term. However, the incident also highlights the new-found inluence that the governors of the resource-rich provinces are able to wield.
Source: Datastream; Ministry of Energy and Mineral Resources. FIGURE 3 Oil Price Movements
($/barrel)
Jun-2010 Oct-2010 Feb-2011 Jun-2011 Oct-2011 Feb-2012 Jun-2012 0
20 40 60 80 100 120 140
Indonesian crude price
West Texas Intermediate crude spot price
Brent crude spot price
FISCAL DEVELOPMENTS 2011 budget outcome
Preliminary data on government expenditure in 2011 show that the government was rather less successful than had been hoped in providing a iscal stimulus. Actual central government expenditure was 3% lower than the amount speciied in the revised budget, and actual revenue slightly higher (table 3). As a result, the realised budget outcome recorded a small deicit of around 1.2% of GDP, lower than the initially projected 2.1%. One consequence of this was that unspent funds amounting to Rp 30 trillion were carried over to 2012 (Bisnis Indonesia, 18/5/2012). Revenue collection was relatively strong at Rp 1,200 trillion – exceed-ing the revised budget level by 2.5%. This was mainly due to a 12% increase in natural resources revenue, driven by rising prices for commodities such as crude oil and palm oil.
Spending on energy subsidies signiicantly overshot the revised budget alloca -tion. Fuel subsidy expenditure was 27% higher than planned. The relatively low price of subsidised fuel, together with the tendency for vehicle usage to increase in line with rises in income levels, pushed the consumption of subsidised fuel to 41.7 million kilolitres, 3% higher than the level envisaged in the revised budget (Jakarta Post, 10/1/2012). The electricity subsidy exceeded its budget allocation by 38% owing to rising oil prices and a shortage of gas to use as an alternative fuel to run the plants (Jakarta Post, 29/11/2011). Capital and material expenditures, however, came in below the revised budget estimates.
2012 budget revision
Parliament approved a revised budget for 2012 on 30 March. The revisions were necessitated by a weakening global economic environment and a surge in the West Texas Intermediate (WTI) oil price to almost $110 per barrel in late February 2012.9 Given these developments, a number of assumptions about key macro economic indicators had to be modiied. The revised budget assumptions included a lower growth rate (6.5%, compared with 6.7% previously), a higher inlation rate (6.8% rather than 5.3%) and a lower interest rate (5% rather than 6%). The higher inla -tion rate relected the expected impact of an increase in the subsidised fuel price, while the lower interest rate relected the expectation of strong investor demand for government securities, backed by Indonesia’s sovereign rating upgrades.
Higher inlation and uncertainty in the global economic outlook contributed to the assumption of a slightly weaker exchange rate in 2012. The assumed level of oil production in 2012 was also revised down to 930,000 barrels per day (bpd), because actual oil production in 2011 was just 898,000 bpd (Danamon 2012a: 1), signiicantly below the government’s initial target of 950,000 bpd (table 3). The assumed oil price was revised up from $90 to $105 per barrel, in line with the rising oil price at the beginning of the year. Nevertheless, the igure seems low, because the average ICP reached $122 per barrel in the irst quarter of 2012, as igure 3 indicates.
9 The increase in oil prices in February was driven in part by Iran’s decision to halt oil exports to European countries (Telegraph, 15/2/2012).
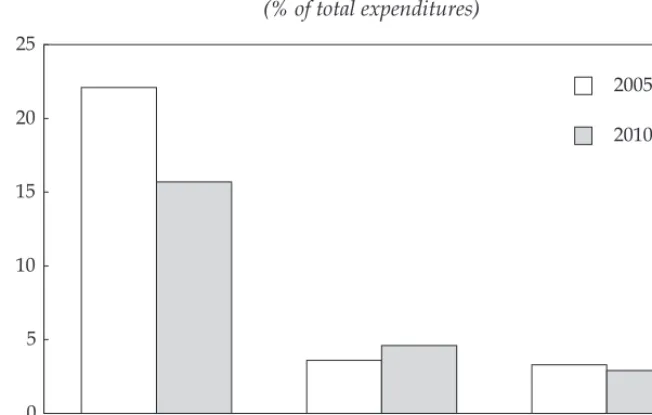
TABLE 3 2011 Budget Outcome and 2012 Budget (Rp trillion)
2011 2012
Revised Actuala Proposed Revised
REVENUE & GRANTS 1,169.9 1,199.5 1,311.4 1,358.2
Domestic revenue 1,165.3 1,196.9 1,310.6 1,357.4
Tax 878.7 872.6 1,032.6 1,016.2
Domestic 831.7 818.6 989.6 968.3
Income tax 432.0 430.8 520.0 513.7
VAT 298.4 277.0 352.9 336.1
Other 101.4 110.8 116.7 118.6
International trade taxes 46.9 54.0 42.9 47.9
Non-tax 286.6 324.3 278.0 341.1
Natural resource revenue 192.0 215.3 177.3 217.2
Proits of state-owned enterprises 28.8 28.2 28.0 30.8
Revenue from public service centres 50.3 66.6 53.5 72.8
Other 15.4 14.1 19.2 20.4
Grants 4.7 2.6 0.8 0.8
EXPENDITURE 1,320.8 1,289.6 1,435.4 1,548.3
Central government 908.2 878.3 965.0 1,069.5
Personnel 182.9 175.5 215.9 212.3
Material 142.8 121.0 188.0 186.6
Capital 141.0 115.9 152.0 168.7
Interest 106.6 93.3 122.2 117.8
Subsidies 237.2 294.9 208.9 245.1
Energy 195.3 255.6 168.6 202.4
Fuel 129.7 165.2 123.6 137.4
Electricity 65.6 90.4 45.0 65.0
Non-energy 41.9 39.3 40.3 42.7
Grants expenditure 0.4 0.3 1.8 1.8
Social expenditure 81.8 70.9 47.8 55.4
Other 15.6 6.5 28.5 65.5
Transfers to regions 412.5 411.4 470.4 478.8
DEFICIT –150.9 –90.1 –124.0 –190.1
(% of GDP) 2.1 1.2 1.5 2.2
FINANCING 150.8 129.3 124.0 190.1
Domestic inancing 153.6 148.5 125.9 194.5
Foreign inancing (net) –2.8 –19.5 –1.9 –4.4
BASIC ASSUMPTIONS
Gross domestic product 7,227.0 7,427.0 8,119.8 8,524.9
GDP growth (%) 6.5 6.5 6.7 6.5
Inlation (%) 5.7 5.7 5.3 6.8
Exchange rate (average Rp/$) 8,700 8,700 8,800 9,000
SBI interest rate (average %)b 5.6 5.6 6.0 5.0
Crude oil price (average $/barrel) 95.0 95.0 90.0 105.0 Oil production (average ‘000 barrels/day) 945 898 950 930
a Figures for the actual 2011 budget are unaudited. b SBI = Bank Indonesia Certiicate.
Source: Ministry of Finance (2012a, 2012c, 2012d).
Relecting the slightly lower projection for GDP growth, expected revenue from tax collection was adjusted downward by 1.6%. However, non-tax revenue was adjusted upward because of expectations that a weaker exchange rate would increase the rupiah value of commodity-based revenues (mainly from exports of oil, gas and crude palm oil). As a result, the total value of revenue and grants increased in the revised budget.
The total value of expenditure was also revised upward, mainly because of a blowout in energy subsidies; the electricity subsidy in particular increased by 45%.10 There is a slight chance of a cut in fuel subsidies later in the year because, as discussed earlier, the government is allowed to increase the subsidised fuel price from Rp 4,500 to Rp 6,000 per litre if the average oil price over a six-month period exceeds the budget assumption of $105 per barrel by at least 15%. How-ever, if the global economy does not recover quickly, this condition is unlikely to be met. Expected social and ’other’ expenditures rose substantially, relecting the cost of a program that was initially intended to compensate the poor for the anticipated fuel price rises. Capital expenditures were boosted by 11% to inance infrastructure development in eastern Indonesia and to promote domestic con-nectivity (Ministry of Finance 2012b: 3).
Building these new assumptions into the original budget resulted in a projected deicit of Rp 190 trillion (2.2% of GDP), compared with the earlier igure of Rp 124 trillion (1.5% of GDP). From a inancing point of view, deicits of around 2% of GDP should be manageable without risking an adverse revision of Indonesia’s credit rating. Additional inance from oficial creditors may also be available to fund worthwhile development programs or to provide stand-by inancing in case market conditions deteriorate.11
The above discussion indicates the considerable impact that energy subsidies can have on other areas of public spending. Allocations for other expenditure items may be compromised if energy prices rise, unless the subsidies are reduced. Fuel subsidies should be reduced sooner rather than later because of the incen -tives they create to increase fuel consumption, on top of the rises accompanying income growth. Lower subsidies would allow the government to reallocate public funds to more compelling public expenditure needs, such as social assistance and health.
Despite sustained economic growth, some 30 million Indonesians – or around 12.5% of the population – still live in poverty (BPS 2011; Economist, 3/8/2011). Although the shares of public expenditure on household social assistance and
10 The signiicant increase in the allowance for electricity subsidies was necessitated by delays in completing new coal-based power plants for the state electricity company, Peru-sahaan Listrik Negara (PLN), and interruptions in the supply of gas to the company’s gas-based generators. This means that PLN will need to rely more on its oil-gas-based generators, which not only use subsidised fuel but are more expensive to run than either coal or gas (Bisnis Indonesia, 12/3/2012; Jakarta Post, 7/4/2012).
11 For example, on 15 May 2012 the World Bank approved $2 billion in support for the Program for Economic Resilience, Investment and Social Assistance in Indonesia (Perisai), ‘to help shield Indonesia against possible future shocks and volatility in global inancial markets and economic outlook’. See <http://www.worldbank.org/projects/P130048/ program-economic-resilience-investment-social-assistance-indonesia?lang=en>.
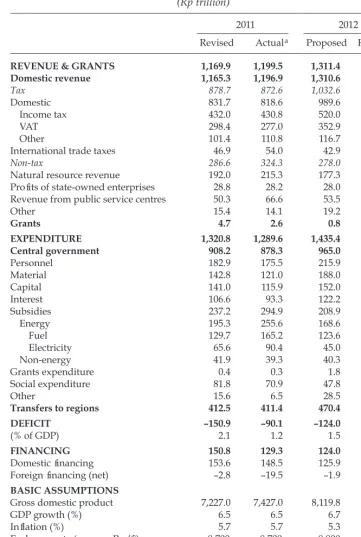
health have increased in recent years, they still receive signiicantly lower priority in the budget than energy and other subsidies (igure 4). In 2010, such subsidies amounted to 16% of total government spending, compared with only 5% and 3% respectively for health and social assistance. A reduction in energy subsidies would allow the government to increase spending on health and social assistance without putting pressure on the budget deicit. In contrast to energy subsidies, which mainly beneit the better-off, social spending tends to be more pro-poor. A re-allocation of public funds to social assistance and health could therefore be expected to involve a transfer of beneits from middle-income families to low-income families, contributing to a reduction in poverty.
Recent regulatory changes and Indonesia’s business climate
Several policy changes during the irst half of 2012 suggest that the business cli -mate is getting tougher for foreign irms in Indonesia. One such change is the new mining decree announced in March that requires foreign companies to sell down their stakes in mines and increase domestic ownership to at least 51% by the 10th year of production (Reuters, 7/3/2012). This divestment policy may reduce inves -tor interest in the mining sec-tor. Also, foreign-controlled mining companies may face dificulties in inding local companies with suficient funds to buy into their ventures.
In addition, the Ministry of Finance issued a decree extending taxes on exports of raw minerals and agricultural commodities. The decree speciies a 20% export tax on 65 categories of minerals – up from 14 previously – and variable rates of, for example, 0–40% on various palm oil products and 0–15% on cocoa products. The ministry says that the intention of the policy is not to raise revenue but to ‘preserve resources’ and increase value added (Bisnis Indonesia, 18/5/2012). To be legally
FIGURE 4 Spending on Health, Social Assistance and Energy Subsidies (% of total expenditures)
Source: World Bank (2012a). Energy & other subsidies
(excl. social assistance)
Health (excl. social assistance)
Household social assistance 0
5 10 15 20 25
2005
2010
eligible to export the 65 speciied commodities, mining companies are required to be registered exporters and to submit plans to construct smelters to process ore for export (Media Indonesia, 7/5/2012). For a irm to become a registered mining exporter, it must apply to the Ministry of Trade after receiving approval from the Ministry of Energy and Resources. The requirement to construct smelters may not be economically feasible for all mining irms, especially those that operate on a small scale, as smelting is a low-margin business that requires large sums of capital.
Another policy that may discourage foreign investment relates to proposed new rules for the ownership of commercial banks. BI reportedly plans to reduce the permissible level of foreign ownership of banks from 99% to 40% (Wall Street Journal, 24/6/2012). If it moves ahead with the plan, this could delay the $7.3 billion acquisition of Bank Danamon Indonesia by Singapore-based DBS Group Holdings (Financial Times, 2/4/12). The lood of foreign acquisitions of Indo-nesian banks in recent years has aroused concern among politicians about foreign control of the country’s inancial sector (Jakarta Post, 23/4/2012).12
New regulations are also being imposed on imports of horticultural goods: they will only be able to enter Indonesia through selected ports, excluding the country’s main seaport, Tanjung Priok in Jakarta, and importers will have to be registered. The new regulations were supposed to take effect on 15 June but have been postponed until mid-September (Jakarta Post, 18/5/2012; Reformasi Weekly, 22/6/2012). These import restrictions could increase food prices and poten -tially damage the country’s fast-growing retail food industry (Financial Times, 12/6/2012).
In sum, the recently implemented investment and trade policies run the risk of alienating foreign investors and damaging Indonesia’s investment climate. The changes will not cause economic growth to stagnate overnight, but they may sig-nal further changes that could damage the business climate. With a presidential election approaching in 2014, politicians and policy makers could become com-placent about the health of the economy, and turn to inward-looking policies in the expectation that economic nationalism will be a vote winner.
TARGETING THE POOR IN INDONESIA
Indonesia has made substantial progress in alleviating poverty over the last dec-ade. The poverty rate fell from 23.4% in 1999 to 12.5% in 2011 (BPS 2011: 44, 47), and the government aims to reduce the rate further to 8% by 2014. In addition, it is committed to tackling the issue of near-poor households. In 2011, about 40% of the population was clustered just above the poverty line of Rp 233,700 per
12 For example, Bank CIMB Niaga is 97% owned by Malaysia-based CIMB Group, Bank Internasional Indonesia is 97.5% owned by Malayan Banking Berhad, and Bank Danamon Indonesia is 67% owned by Singapore-based Temasek Holdings (Business Times, 5/6/2012). It is Temasek’s stake in Bank Danamon that is currently subject to a takeover offer from DBS Group Holdings. For further details see, for example, <http://www.bloomberg.com/ news/2012-04-02/dbs-to-buy-temasek-stake-in-bank-danamon-for-4-9-billion.html>.
month (World Bank 2012b: 22).13 This implies that there is a signiicant number
of non-poor individuals who could be pushed into poverty as a consequence of transitory shocks.
One way to reduce poverty is to support rapid economic growth, as long as the fruits of growth trickle down to the poorest individuals. Targeted social assistance for the poor, in combination with economic growth, is likely to be the most efi -cient way to alleviate poverty. For social assistance programs to reduce poverty effectively, however, the beneiciaries must be targeted accurately and the ben -eits delivered with minimum leakage. Thus, the challenge for the government is to develop a targeting approach that identiies the intended recipients (that is, the poor and vulnerable) while minimising leakage of beneits to the non-poor (Coady, Grosh and Hoddinot 2004). This is particularly important given that the budget for social assistance is relatively limited, as noted above. In 2011, social expenditure accounted for less than 10% of central government spending and a mere 1% of GDP, in contrast to the 3.4% of GDP spent on regressive energy sub -sidies (table 3).
International experience suggests that targeting can be an effective way of delivering public resources to the poor. According to a meta-study of 122 targeted social assistance programs in 48 developing countries, a ‘typical’ targeting pro-gram is better at providing transfers to relatively poor households than a bench-mark distribution scheme providing a subsidy of the same size to all households regardless of income level (Coady, Grosh and Hoddinot 2004). The study shows that the median share of funds accruing to the poorest 20% of the population was 25% under a typical targeting program. It also indicates that there is considerable variation in the accuracy of targeting. The best performing program in the study, Argentina’s Trabajar public works program, was able to transfer 80% of program beneits to the poorest quintile, compared with less than 20% for some of the poor -est performing programs. The lesson for the Indonesian government is that it is possible to design effective targeting methods and implementation procedures to accelerate poverty alleviation.
How much is being allocated to social assistance programs?
Although social assistance spending accounts for only a small fraction of cen-tral government spending, the absolute value of such spending increased sub-stantially from Rp 6.7 trillion in 2004 to Rp 26.1 trillion in 2010 (World Bank 2012d: 15).14 The programs covered by this spending include a subsidised rice scheme (Beras untuk Keluarga Miskin, Raskin); a health card scheme (Jaminan
13 The poverty line is based on food consumption of 2,100 calories per day plus an allow -ance for basic necessities such as housing, transport, health and education (BPS 2011). A point to note is that about 30 million Indonesians are classiied as poor if one uses the gov -ernment’s oficial poverty line, but the number almost triples if one uses the international poverty line of purchasing power parity (PPP) of $2 per day (Economist, 3/8/2011). 14 The Indonesian government does not compile statistics on the share of social assistance in general social expenditure, so the exact amount of social assistance expenditure cannot be determined directly through oficial budget documentation (World Bank 2012c: 41). The World Bank aggregates identiiable social assistance expenditures and reports the igures as a stand-alone item.
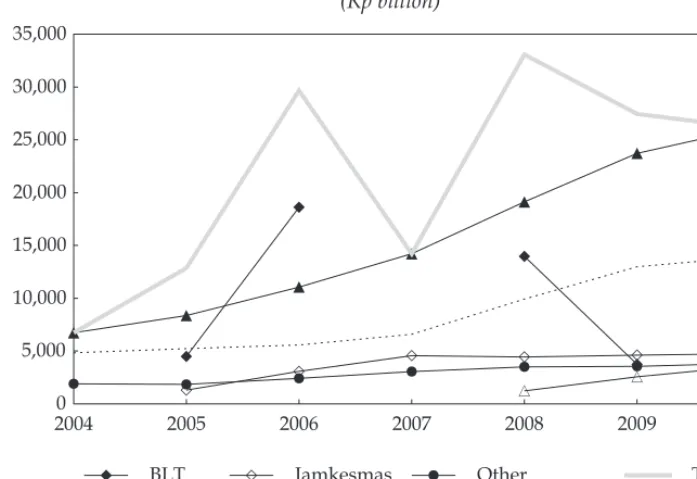
Kesehatan Masyarakat, Jamkesmas); a scholarship program for poor students (Beasiswa untuk Siswa Miskin, BSM); a conditional cash transfer program (Pro-gram Keluarga Harapan, PKH); and a temporary unconditional cash transfer program (Bantuan Langsung Tunai, BLT).15 Other measures to help particularly vulnerable groups have included cash transfers and services for at-risk children (Program Kesejahteraan Sosial Anak, PKSA), the disabled (Jaminan Sosial Pen -yandang Cacat Berat, JSPACA) and the vulnerable elderly (Jaminan Sosial Lanjut Usia, JSLU). The subsidised rice program, Raskin, usually accounts for over half of total social assistance expenditure and Jamkesmas for approximately one-third (igure 5). But in the years when the government increased subsidised fuel prices (2005–06 and 2008–09), the BLT accounted for a large share of social expenditure – over 60% in 2006 and around 40% in 2008.
How well are social assistance resources being delivered to the poor?
In general, the beneits of Indonesia’s various safety net and poverty reduction programs do reach the poor despite leakage to the non-poor. However, they all
15 The BLT was irst implemented in 2005–06 to compensate poor households for a sud -den and large increase in fuel costs. It was then relaunched in 2008–09 to protect the poor against further fuel price increases in mid-2008.
FIGURE 5 Central Government Expenditure on Social Assistance by Programa (Rp billion)
a BLT (Bantuan Langsung Tunai) is an unconditional cash transfer program; BSM (Beasiswa untuk
Siswa Miskin) is a scholarship program; Jamkesmas (Jaminan Kesehatan Masyarakat) is a health card scheme; and Raskin (Beras untuk Keluarga Miskin) is a subsidised rice program.
Source: World Bank (2012d).
2004 2005 2006 2007 2008 2009 2010 0
suffer from targeting deiciencies, with many poor households excluded from beneits and many non-poor households receiving them.
The unconditional cash transfer program (BLT) aimed to reach the poorest 30% of households, but only 46% of them actually received transfers in 2009. On the other hand, 18% of non-target households (the other 70%) beneited from the pro -gram (World Bank 2012b: 44). In 2010, over 70% of poor households were able to buy rice at a subsidised price under the Raskin program, but many non-poor households also shared in the beneits because of the tendency for the rice to be shared among all households in the community. In 2010, the program promised to deliver 14 kilograms of rice per month to poor households, but on average deliv-ered only 3.8 kilograms (World Bank 2012c: 54).
Under Jamkesmas, poor and near-poor households receive a card entitling them to free treatment and other services at local public health clinics and some public hospitals. In 2010, 45% of the poorest 30% of the population (the target group) reported receiving the card – around the same proportion as for the BLT – but 23% of the remaining 70%, including many wealthy households, also man -aged to obtain it. Actual use of the card to receive free health care, however, was considerably lower – only 11% among all card holders (World Bank 2012b: 43–4).
The targeting of the scholarship program for poor students (BSM) is neither progressive nor regressive. Students from the poorest 40% of households take up around half the scholarships, while households in the top 60% account for the other half. That is, non-poor students have about the same chance of receiving beneits as poor students (World Bank 2012b: 45).
In addition to examining the proportion of beneits received by the non-poor, the degree of targeting accuracy can be evaluated
by determining the extent to which the poor have gained compared to random tar-geting (that is, where all households have an equal chance of receiving beneits), with the scores for pro-poor program targeting ranging from 0% (the same perfor-mance as random targeting) to 100% (perfect targeting, where all the beneits are received by the poor) (Alatas, Purnamasari and Wai-Poi 2011: 323).
On this measure, Alatas, Purnamasari and Wai-Poi (2011: 323) ind that the BLT was the most accurately targeted program, performing 24% better than random targeting. They conclude that this relatively low score captures the extent to which non-poor beneiciaries have been included in the program and poor households have missed out, while observing that perfect targeting is unachievable in prac-tice. Two of the government’s other lagship programs, Jamkesmas and Raskin, were even less effective at reaching the poor, respectively performing 16% and 13% better than random targeting (World Bank 2012c: 46).
The inconsistency between oficial targeting methods and actual implemen -tation procedures is one possible reason for the poor performance of targeting. There is considerable evidence that, in practice, targeting often deviates from the oficial guidelines. For example, the agency in charge of the Raskin program is supposed to use the oficial list of the poor constructed by Indonesia’s central sta -tistics agency, Badan Pusat Statistik (BPS), to determine the program’s beneiciar -ies, and the list is then supposed to be veriied through community meetings. In practice, however, village meetings are often not held, and the decision about who receives beneits is made by a local leader. Also, it is common for the subsidised
rice to be shared among the entire community, to avoid conlict and perceptions of ‘unfairness’ (World Bank 2012b: 35).
Improving poverty targeting
The above discussion indicates the need to improve Indonesia’s targeting system. This can be done in two ways. The irst is to ensure that the different implement -ing agencies use consistent and accurate information on the poverty level of each household. The second is to ensure that the oficial targeting methods are imple -mented in practice. Three possible ways to improve accuracy in identifying the poor are to harness the knowledge of communities about their members; to con-duct a proxy means test (PMT);16 and to allow self-selection by poor and non-poor households.
Alatas et al. (2012) conducted an experiment in 640 Indonesian villages using three approaches to targeting the poor: proxy means testing; community targeting in which villagers ranked households from richest to poorest; and a hybrid sys-tem that combined the community ranking procedure with subsequent PMT veri-ication. They found that proxy means testing outperformed both the community and hybrid methods in terms of reducing the overall mis-targeting rate (leakage of beneits to non-poor households); the mis-targeting rates for both the commu -nity and hybrid methods were about 10% higher than the rate using proxy means testing. However, communities were better at identifying the households most in need of assistance, correctly categorising 67% of the very poor as poor, compared with 56% for proxy means testing. An added beneit was higher satisfaction levels in the villages where the genuinely impoverished were more accurately targeted.
In 2011, the government inished compiling a uniied database of poor house -holds, called Data Collection for Targeting Social Protection Programs (Penda-taan Program Perlindungan Sosial 2011, PPLS11).17 It identiies about 26 million households (the poorest 40%) from which implementing agencies can draw lists of those eligible to beneit from particular social programs (Vice President’s Ofice 2012).
The second issue, implementation, will also be critical for the national targeting system to be effective. In particular, a number of decisions need to be made about how to manage the PPLS11 database. This includes decisions about who admin-isters it, who has access to it, how it is shared, and how it is veriied and recerti -ied. In addition, the government will need to establish logistical and institutional frameworks governing which agencies perform the required functions, a proce-dure to manage complaints, and adequate monitoring and evaluation processes. Finally, it is crucial that the database is updated constantly. This is particularly important given that Indonesia has a large population living close to the poverty line, many of whom risk falling into poverty if they encounter economic or other (particularly health) shocks. Continual updating of the data on the poverty level
16 Proxy means testing uses a relatively small number of household characteristics to cal -culate a score that indicates the household’s economic welfare. This score is then used to determine eligibility for receipt of program beneits and possibly also the level of beneits. 17 PPLS11 was developed by the National Team for the Acceleration of Poverty Reduction (Tim Nasional Percepatan Penanggulan Kemiskinan, TNP2K). For further information, see Suryadarma and Sumarto (2011).
of households is likely to minimise the under-coverage of households that have been newly pushed into poverty, and leakage to households that have recently escaped from poverty.
RECENT TRENDS IN HEALTH OUTCOMES
Good health is important not only to improve individual welfare but also to reduce poverty and increase economic growth. Poor health often pushes indi-viduals into poverty, and physical health is one of the critical determinants of labour productivity.
Indonesia has experienced signiicant improvements in the health status of its population since the 1990s. Life expectancy at birth increased from 65 in 1990 to 68 in 2009, while the infant mortality rate (the number of deaths between birth and age 1 per 1,000 live births) declined from 56 in 1990 to 27 in 2010.18 The under-5 mortality rate (the number of deaths between birth and age 5 per 1,000 live births) also fell, from 85 in 1990 to 35 in 2010 (table 4).
Figures such as these put Indonesia in a good position to achieve some of its health-related Millennium Development Goals (MDGs).19 For example, if the under-5 mortality rate continues to decrease at the exponential rate observed between 2008 and 2010 (ive percentage points per year), it will fall to 26.7 by 2015 – lower than the oficial goal of 28.3, or one-third the 1990 rate. However, it is unclear if the country will meet its goal of reducing the maternal mortality ratio – the number of maternal deaths per 100,000 live births – by three-quarters between 1990 and 2015. While the ratio declined continuously from 620 in 1990 to 240 in 2008, the speed of reduction appears to have slowed. If it continues to fall at the rate observed between 2005 and 2008 (four percentage points per year), the maternal mortality ratio will be 182 in 2015, or just over a quarter of the 1990 ratio.
Among Southeast Asian countries, Indonesia’s health status as measured by these mortality indicators in 2008 is above average, although not as good as might be expected on the basis of its economic status. Table 4 shows that Indonesia has worse maternal mortality and under-5 mortality rates than the Philippines and Vietnam, despite having higher GDP per capita. The gap is particularly large for maternal mortality. The relative health status of the countries listed in table 4 has not changed since 1990.
One possible factor contributing to Indonesia’s failure to improve its relative health status is the amount of spending on health. Table 5 shows that Indonesia spent $51 per capita on health in 2008, less than the regional average of $282, and
18 Information on life expectancy at birth and infant mortality is extracted from the World Health Organization’s Global Health Observatory Data Repository; see <http://apps.who. int/ghodata/>.
19 Information on the MDGs for Indonesia can be found at <http://mdgs.un.org/unsd/ mdg/Default.aspx>. Progress between the base level in 1990 and the target year, 2015, is assessed by monitoring speciied indicators. For child mortality, the main indicators are the infant mortality rate, the under-5 mortality rate and the percentage of children under one year of age who have been immunised against measles. For maternal health, the indica -tors include the maternal mortality ratio and the proportion of births attended by a skilled health practitioner.
Survey of r
ecent developments
163
TABLE 4 Comparison of Health Indicators among Southeast Asian Countries
GDP Per Capita (in current $)
Maternal Mortality Ratio (deaths per 100,000 live births)
Under-5 Mortality Rate (deaths per 1,000 live births)
Births Attended by Skilled Personnel
(%) 1990 2008 2010 1990 2008 Goal 1990 2008 2010 Goal 2000 2008
Brunei Darussalam 14,273 37,414 n.a. 28 21 7 12 8 7 4 99 100
Singapore 13,737 36,739 41,120 6 9 2 8 3 3 3 n.a. n.a.
Malaysia 2,626 8,099 8,373 56 31 14 18 7 6 6 97 99
Thailand 1,702 3,993 4,608 50 48 13 32 14 13 11 99 99
Indonesia 684 2,172 2,946 620 240 155 85 39 35 28 67 75
Philippines 719 1,925 2,140 180 94 45 59 31 29 20 58 62
Vietnam 143 1,070 1,224 170 56 43 51 25 23 17 70 88
Laos 238 910 1,177 1,200 580 300 145 60 54 48 19 20
Cambodia n.a. 749 795 690 290 173 121 59 51 40 32 44
Timor-Leste n.a. 461 624 650 370 163 169 62 55 56 24 29
Myanmar n.a. n.a. n.a. 420 240 105 112 70 66 37 57 64
Average 4,265 9,353 7,001 370 180 93 74 34 31 25 62 68
n.a. = not available.
164
Susan Olivia and Chikako
Y
amauchi
TABLE 5 Comparison of Health Expenditure among Southeast Asian Countriesa
GDP 2008 2000 2008 2000 2008 2000 2008 2000 2008 2000 2008 2000 2008
Brunei Darussalam
37,414 541 834 468 713 3.0 2.3 86.5 85.5 13.5 14.5 6.3 7.0
Singapore 36,739 648 1,404 291 479 2.8 3.3 44.9 34.1 55.1 65.9 6.2 7.8 Malaysia 8,099 128 353 67 156 3.2 4.3 52.4 44.1 47.6 55.9 6.2 6.9 Thailand 3,993 67 164 38 122 3.4 4.1 56.1 74.3 43.9 25.7 9.9 14.2 Indonesia 2,172 16 51 6 28 2.0 2.3 36.6 54.4 63.4 45.6 4.5 6.2 Philippines 1,925 33 68 16 24 3.4 3.7 47.6 34.7 52.4 65.3 7.0 6.1
Vietnam 1,070 22 76 6 29 5.4 7.2 30.1 38.5 69.9 61.5 6.6 9.3
Laos 910 10 34 3 6 3.2 4.0 32.5 17.6 67.5 82.4 5.1 3.7
Cambodia 749 17 43 4 10 5.8 5.7 22.5 23.8 77.5 76.2 8.7 9.0
Timor-Leste 461 34 63 24 52 8.8 13.9 70.9 82.9 29.1 17.1 12.7 11.9 Myanmar n.a. 3 12 <1 <1 2.1 2.3 13.4 7.5 86.6 92.5 1.2 0.7
Average 9,353 138 282 84 147 3.9 4.8 44.9 45.2 55.1 54.8 6.8 7.5
n.a. = not available.
a Expenditure is in current US dollars, based on the average exchange rate for the year.
also less than the amounts spent by the Philippines and Vietnam.20 Indonesia’s total expenditure on health as a share of GDP (2.3%) was also below the regional average and less than in these two countries.
Nevertheless, in absolute terms, health spending in Indonesia has increased signiicantly over the past two decades. Per capita total expenditure on health rose from $16 in 2000 to $51 in 2008, with the government’s share of this increas -ing from $6 to $28. As a result, the proportion of total health spend-ing inanced by the government expanded from 37% in 2000 to 54% in 2008.21 The share of government health expenditure in total government expenditure also grew, from 4.5% in 2000 to 6.2% in 2008. According to the Ministry of Finance (2012a), public expenditure on health has risen further since then, from Rp 14.0 trillion in 2008 to Rp 18.8 trillion in 2010.
The relatively low level of health spending in Indonesia as a share of GDP is likely to be related to the inadequate supply and quality of health facilities, as discussed below. This in turn is likely to be one of the factors keeping the health care utilisation rate relatively low in Indonesia. For instance, the share of births attended by a skilled health practitioner is lower in Indonesia than in Vietnam (table 4).
Supply-side issues
While greater expenditure may not always lead to improved service delivery if there is corruption or ineficient implementation, in the case of Indonesia, the use of public outpatient care has increased as public health spending has increased (Kruse, Pradhan and Sparrow 2012). Indonesia faces several long-standing chal-lenges in providing health services, particularly in rural areas. These include limited access to health facilities and health personnel,22 inadequate quality of existing health personnel, and other issues such as inadequate medical supplies and unclear lines of authority between health departments at different levels (World Bank 2008; Rokx et al. 2010).
One of the dificulties in providing an adequate supply of health facilities and health workers is that it is unclear how the responsibility to hire and ire workers
20 The conversion of expenditure values to US dollars is based on the average exchange rates for the year. The igures for 2008 are unlikely to be severely affected by the global i -nancial crisis because its impact was concentrated in the last two months of the year. For in -stance, while the Indonesian rupiah depreciated substantially in November and December 2008 to around Rp 11,000–12,500/$, during the irst nine months of the year it luctuated within a very limited range (Rp 9,000–9,500/$).
21 Public expenditure includes both central and regional government spending, and so-cial security funds (OECD 2000; Partners for Health Reformplus 2003). Thus, the statistics are not affected by the devolution of responsibility for health from the central to the local government level in 2001.
22 Opportunities to work in lucrative private practices in urban areas may be a factor in limiting the supply of health workers in rural areas, and be related to absenteeism and a decline in the quality of care at public facilities. However, data on health workers’ time use is limited, and the available evidence on quality suggests that the expansion of private practices is not correlated with a decline in the diagnostic ability of health workers at pub-lic health centres (Rokx et al. 2010: 85–7).
is divided between the central and district levels of government.23 Even though district governments were put in charge of operating public health facilities when decentralisation started in 2001, the central government is still involved in the deployment and inancing of public doctors who work under civil service con -tracts. The division of responsibilities needs to be clariied to facilitate a more lexible and eficient allocation of health personnel. Except for the few district governments that have relatively large own-source revenues (mainly those in resource-rich areas), districts do not have the inancial capacity to take on large numbers of additional health workers. Also, they do not yet have established channels for hiring newly graduated doctors and nurses, which seems important for recruitment (World Bank 2009).
Attracting health workers to remote areas is a long-standing challenge for the public sector. From the early 1980s to 1992, all newly graduated doctors were required to enter the permanent civil service and undertake a spell of compulsory service at a public health facility, with the length of service reduced for those who were willing to accept assignments in remote areas. From 1992 until 2007, under the Temporary Civil Servant scheme (Pegawai Tidak Tetap, PTT), doctors had to work in the public sector for three years to obtain a licence to practise, but were not given the security of a permanent civil service position (World Bank 2009: 39–40). Those who accepted contracts in remote areas were compensated with higher salaries, although this was not a strong incentive, given the lucrative opportunities for private practice in urban areas (Chomitz et al. 1998).
In 1996, the government offered doctors an additional incentive to serve in remote areas: an improved chance of a permanent position in the civil service, accompanied by subsidised specialist training. Chomitz et al. (1998) ind that this initiative succeeded in attracting more graduating doctors to remote areas, but it was also expensive, and plagued by a mismatch between the skills doctors had attained and the skills needed in such areas. In addition, the number of doc-tors who succeeded in obtaining permanent positions in the civil service fell in the 2000s as the supply of doctors increased, and graduates became increasingly unwilling to undertake compulsory service in a remote area without adequate compensation. As a result, the policy of mandatory placement of doctors under the PTT scheme was abolished in 2007 (World Bank 2009: 41). Since then, medi -cal school graduates have been able to enter the labour market directly as private providers without undertaking compulsory service in a public health facility.
In 2008 the government launched a new program to improve access to special-ist services in remote and other hard-to-service areas. Particularly promising is its policy to provide scholarships to doctors from such areas to train as specialists, on condition that they return to their districts of origin afterward (World Bank 2009: 41; Jakarta Post, 1/9/2008).
The quality of health workers in Indonesia is also considered inadequate. Rokx et al. (2010) used health worker vignettes included in the 2007 Indonesian Family
23 For example, the Ministry of State Apparatus Reform produces an annual list of perma -nent civil service positions from which central and local health agencies must draw, while the Ministry of Home Affairs, in coordination with the State Civil Service Agency (Badan Kepegawaian Negara, BKN), manages transfers of health personnel between localities, and between levels of government (World Bank 2009: 38).
Life Survey to examine whether health workers were able to answer correctly questions about proper diagnosis and treatment procedures.24 The results indi-cated that respondents correctly answered 64% of the questions on child curative care, but only 56% of those on adult curative care and 46% of those on pre-natal care. Workers at public health centres (puskesmas) were more likely to score well on the maternal care questions, and achieved scores on adult and child curative care that were comparable to those attained by private physicians. This relects the high level of resources put into training puskesmas workers by all levels of government (Rokx et al. 2010: 71–84).
The quality of midwives is likely to be an important factor in ensuring satis-factory primary health care, particularly in remote areas, where the numbers of midwives stand up quite well. In 2006, for example, Indonesia had 39,684 physi -cians and 79,661 midwives, or an average of 18 physi-cians and 37 midwives per 100,000 people. In rural areas, however, the ratios were six physicians and 40 mid-wives per 100,000 residents (Rokx et al. 2010: tables 3.1 and 3.3).25 The relatively high number of midwives in rural areas is mainly due to the Village Midwife program (Bidan di Desa), which has dispatched large numbers of midwives to remote villages since 1992. Using village-level longitudinal analysis, Frankenberg and Thomas (2001) found that the program had improved the health of women of reproductive age (through increases in body mass index) and their children (through increases in birth weight), although Shrestha (2010) concluded that it had not contributed to the reduction in infant mortality observed in his district-level longitudinal analysis.
To improve the quality of midwives, in 2010 the government raised the mini-mum qualiication for new midwives from Diploma I to Diploma III. Existing midwives also need to comply with the new requirement by 2015 in order to have their licences renewed. Among the publicly and privately practising midwives currently registered with the Indonesian Midwives Association (Ikatan Bidan Indo nesia, IBI), about one-third still hold only a Diploma I certiicate.26 Complet-ing the upgrade of qualiications for all midwives will therefore require a huge effort on the part of the Ministry of Health, the IBI and the midwives themselves. A related issue in maintaining the quality of health workers concerns the accreditation of the institutions that educate them. The number of private insti-tutions providing diplomas or degrees to midwives and doctors has increased rapidly, but many of them are not properly regulated (Rokx et al. 2010: 84). A con -sistent accreditation scheme for public and private institutions is therefore neces-sary to ensure minimum standards among new health workers.
After obtaining their qualiications, health workers also need periodic training on new technology and information to keep their skills up to date. Such opportu-nities are generally available for most public health workers, but not always for
24 The questions about child health care covered areas such as when a health worker should take the temperature of a child, whether the worker had asked about the frequency of diarrhoea and whether the worker had asked about the nature of the stool.
25 Of course, nurses also play an important role in providing primary care, but accurate data on the distribution of nurses are not available.
26 Of around 200,000 midwives in Indonesia in 2012, about 100,000 are registered with the IBI (personal communication, chair of the IBI, 15 May 2012).