I THESIS (RC-142501)
EFFECTS OF PVA FIBER ON BOND STRENGTH
IMPROVEMENT IN GEOPOLYMER CONCRETE
KEFIYALEW ZERFU 3115 202 701
SUPERVISOR:
Dr.Eng.JANUARTI JAYA EKAPUTRI,S.T,M.T
MASTER PROGRAM
DEPARTMENT OF CIVIL ENGINEERING
FACULTY OF CIVIL ENGINEERING AND PLANNING INSTITUT TEKNOLOGI SEPULUH NOPEMBER SURABAYA
I
THESIS (RC-142501)
EFFECTS OF PVA FIBER ON BOND STRENGTH
IMPROVEMENT IN GEOPOLYMER CONCRETE
KEFIYALEW ZERFU 3115 202 701 SUPERVISOR:
Dr.Eng.JANUARTI JAYA EKAPUTRI,S.T,M.T
MASTER PROGRAM
DEPARTMENT OF CIVIL ENGINEERING
FACULTY OF CIVIL ENGINEERING AND PLANNING INSTITUT TEKNOLOGI SEPULUH NOPEMBER SURABAYA
I
DECLARATION
I hereby declare that this research has been carried out under the supervision of Dr.Eng.Januarti Jaya Ekaputri, Civil Engineering Department, Institut Teknologi Sepuluh Nopember as part of Maters of Science program in Structural Engineering. In addition, I declare that this research is my original work, the findings presented are not found in any other previous work.
Kefiyalew Zerfu Civil Engineering Department Institut Teknologi Sepuluh Nopember
II
III
ACKNOWLEDGEMENTS
First of all, I would like to praise and give thanks to the Almighty God who gave me wisdom and strength from the inception until completion of this research.
I would like to express my deeper gratitude to my adviser Dr.Eng.Januarti Jaya Ekaputri for her valuable suggestions, time, commitment, encouragement and support throughout my thesis. I would also like to acknowledge KNB scholarship council for covering all my study costs.
My deepest thanks also goes to academic and technical staffs of civil engineering department at Institut Teknologi Sepuluh Nopember. I would also like to pass my deep gratitude to Kamaji Inti Utama, PT. Petrokimia Gresik and SBI Surya Beton Indonesia companies for providing materials for this research.
I would like to acknowledge all my friends in LBE research group for their continuous support. My sincere thanks also goes to Mr. Basar Ismail, Uwitije Pierre Damian and Eskinder Desta for assisting me during my experimental work.
IV
V
EFFECTS OF PVA FIBER ON BOND STRENGTH
IMPROVEMENT IN GEOPOLYMER CONCRETE
NAME : KEFIYALEW ZERFU ID : 3115 202 701
SUPERVISOR : Dr.Eng.JANUARTI JAYA EKAPUTRI,S.T,M.T,
ABSRACT
Several researches were conducted to understand the bond behavior between reinforcing bars and surrounding concrete in Portland cement concrete. However, few results were presented on bond strength of geopolymer concrete (GPC). In this research, the effect of polyvinyl alcohol (PVA) fiber on bond strength in geopolymer concrete was studied. The main aim of this study was to investigate how bond performance affected by varying the amount of PVA fiber content. As a result, PVA fiber of 0%, 0.2%, 0.4%, 0.6% and 0.8% by volume of concrete were applied. Results showed that application of PVA fiber improves the bond resistance between reinforcing bar and concrete matrix. It has been investigated that using of PVA fiber in geopolymer concrete improves up to 25.9% bond strength from concrete without PVA fiber. From different percentage of PVA fiber used, the specimen with 0.6%PVA fiber resulted both maximum compressive and bond strength. A comparative study reveals that geopolymer concrete shows higher bond strength than OPC concrete. Furthermore, it has been studied that FEA result confirms the validity of the experimental pullout test for geopolymer concrete without fiber. The bond strength from experimental result deviates by 0.38% from the ultimate shear stress obtained in FEA analysis.
VI
VII
PENGARUH SERAT PVA TERHADAP PENINGKATAN
KUAT LEKAT BETON GEOPOLIMER
NAME : KEFIYALEW ZERFU ID : 3115 202 701
SUPERVISOR : Dr.Eng.JANUARTI JAYA EKAPUTRI,S.T,M.T,
ABSTRAK
Beberapa penelitian telah dilakukan untuk memahami perilaku lekatan antara tulangan dan beton dalam beton semen Portland (OPC). Namun, beberapa hasil pada penelitian ini, disajikan dalam kuat lekat beton geopolimer (GPC). Dalam penelitian ini, dipelajari pengaruh serat alkohol polivinil (PVA) pada kuat lekat beton geopolimer. Tujuan utama dari penelitian ini adalah untuk menyelidiki bagaimana pengaruh kinerja dari variasi jumlah kandungan serat PVA. Sebagai hasil, diterapkan serat PVA dari 0%, 0,2%, 0,4%, 0,6% dan 0,8% berdasarkan volume dari beton. Hasil penelitian menunjukkan bahwa penerapan serat PVA meningkatkan ketahanan lekatan antara tulangan dan matriks beton. Berdasarkan investigasi juga menunjukkan bahwa menggunakan serat PVA di beton geopolimer meningkatkan kuat lekat hingga 25,9% dari beton tanpa serat PVA. Berdasar presentasi serat PVA yang berbeda, spesimen dengan 0,6% serat PVA menghasilkan kondisi maksimum baik kuat tekan dan kuat lekatnya. Sebagai fakta, studi perbandingan menunjukkan bahwa beton geopolimer menghasilkan kuat lekat lebih tinggi dari beton OPC. Selain itu, dilakukan studi validitas dari hasil permodelan elemen hingga (FEA) dengan eksperimen uji tarik untuk beton geopolimer tanpa serat. Kuat lekat dari hasil eksperimen memiliki deviasi sebesar 0,38% dari tegangan geser ultimate yang diperoleh dalam analisis FEA.
VIII
1.3 Problem statements ... 4
1.4 Purpose ... 4
CHAPTER-2. LITERATURE REVIEW ... 5
2.1 Introduction ... 5
2.2 Geopolymer Concrete ... 6
2.2.1 Definition ... 6
2.2.2 Engineering properties... 8
2.2.3 Factors that affects engineering properties ... 9
2.2.4 Economic Benefits... 12
2.3 Polyvinyl Alcohol Fiber (PVA) ... 12
2.3.1 Reduces plastic shrinkage cracking ... 13
2.3.2 Improves flexural resistance ... 13
2.3.3 Improves compressive and splitting tensile strength ... 13
2.4 Bond Strength ... 14
2.4.1 Factors related to the bond strength development ... 14
2.4.2 Bond failure types... 16
2.5 Pullout Test ... 17
CHAPTER-3. METHODOLOGY ... 25
3.1 Introduction ... 26
X
3.2.1 Fly ash ... 26
3.2.2 Cement ... 26
3.2.3 Coarse and fine aggregates ... 27
3.2.4 Reinforcement bar ... 27
3.2.5 Alkali activator (NaOH & Na2SiO3) ... 27
3.2.6 Polyvinyl Alcohol (PVA) ... 27
3.2.7 PVC ... 28
3.2.8 Strain gauge ... 29
1.8 x10⁻⁵/c ... 29
3.3 Testing for Materials ... 29
3.3.1 Fly ash test ... 29
3.3.2 Coarse and fine aggregates ... 29
3.3.3 Reinforcement bar ... 38
3.4 Mix Design ... 40
3.4.1 Calculation of constituent material for concrete mix: ... 41
3.5 Pullout Test ... 45
3.5.1 Test program ... 45
3.5.2 Mould preparation, casting and curing procedure ... 46
3.5.3 Experimental set up for pullout test... 48
3.6 Finite Element Analysis... 50
CHAPTER-4. RESULTS AND DISCUSSIONS ... 53
4.1 Introduction ... 53
4.2 Material Test Results and Discussion ... 54
4.2.1 Aggregates ... 54
4.2.2 Fly ash ... 58
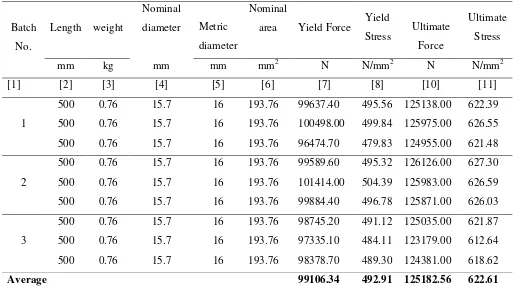
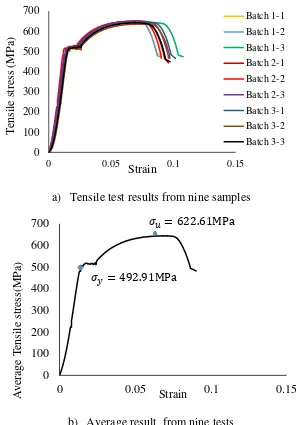
4.2.3 Reinforcement bar ... 59
4.3 Geopolymer and OPC Concrete Test Results and Discussion ... 62
4.3.1 Compressive test of geopolymer concrete ... 62
4.3.2 Direct tensile strength test ... 64
XI
4.3.4 Compressive test for OPC concrete (control specimen) ... 70
4.4 Pullout Test Results ... 70
4.4.1 Ultimate bond resistance in geopolymer concrete... 71
4.4.2 Ultimate bond resistance results from control specimens ... 74
4.4.3 Comparative studies between geopolymer and control pullout specimens ... 75
4.5 Finite Element Analysis... 79
4.5.1 Pullout CAD model ... 80
4.5.2 Engineering data definition /material properties / ... 81
4.5.3 Contact properties definitions ... 83
4.5.4 Meshing ... 84
4.5.5 Analysis type definition ... 87
4.5.6 Boundary condition and loading ... 87
4.5.7 Finite element analysis results ... 87
CHAPTER-5. Conclusions and Recommendations ... 93
5.1 Conclusions ... 93
5.1.1 Experimental test conclusion remarks ... 94
5.1.2 FEA conclusion remarks ... 95
5.2 Recommendations ... 96
REFERENCES ... 99
XII
LIST OF FIGURES
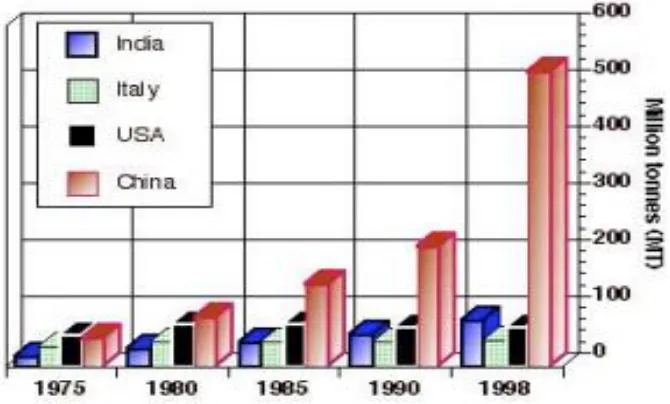
Figure 2:1 CO2 emissions during OPC manufacture for countries
(Davidovits, 2002). ... 6
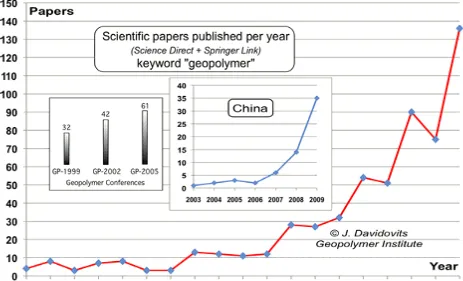
Figure 2:2 Geopolymer research progress two decades (Geiger, 2011) ... 8
Figure 2:3 Mechanical strength of fly ash geopolymer (Palomo & Fernández-jiménez 2011). ... 9
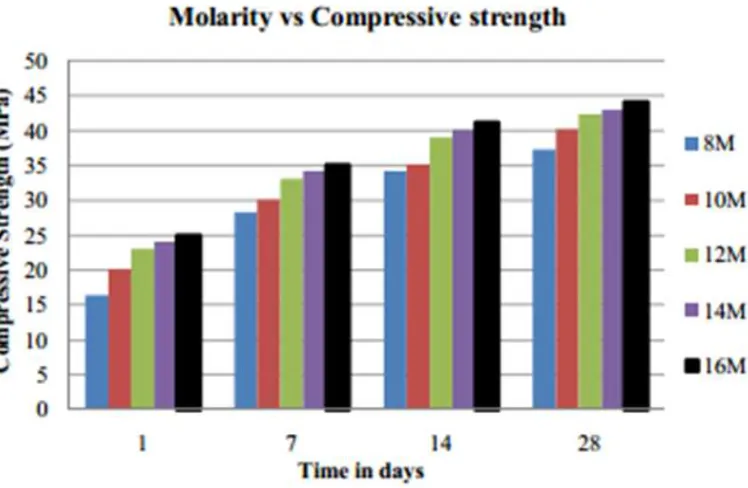
Figure 2:4 ; Strength gain with variation in molarities ... 10
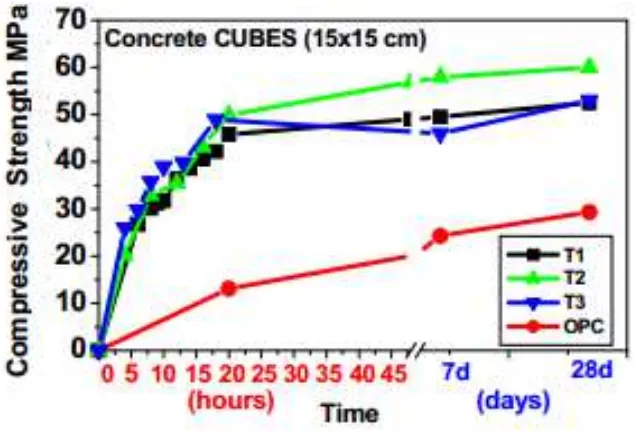
Figure 2:5 Influence of Curing Time on Compressive Strength ... 11
Figure 2:6 Steel-concrete local bond stress slip law FIB Bulletin 10 (Muñoz 2011) ... 18
Figure 2:7 Crack formation in during pullout loading (Muñoz 2011)). ... 19
Figure 3:1 Flow Chart ... 25
Figure 3:2 PVA fiber ... 28
Figure 3:3 Mix design for Geopolymer concrete chart ... 40
Figure 3:4 Universal testing machine model -I/H-500KNI ... 45
Figure 3:5 Concrete cube test specimen ... 46
Figure 3:6 Mould preparation and bar arrangement ... 48
Figure 3:7 Experimental pull-out test setup ... 50
Figure 3:8 FAE analysis steps conducted for pullout model ... 51
Figure 4:1 Summary for rebar tensile test ... 61
Figure 4:2 Comparative study from compressive test ... 64
Figure 4:3 Results from Direct tensile test of geopolymer concrete ... 66
Figure 4:4 40% compressive stress versus strain plot for Modulus of elasticity calculation ... 69
Figure 4:5 Pullout test result summary for geopolymer concrete ... 73
Figure 4:6 Comparative study between geopolymer and OPC concrete pullout test ... 76
Figure 4:7 Comparative study on splitting cracks ... 77
Figure 4:8 Full-3D pullout model ... 81
XIII
Figure 4:10 Contact definition ... 84
Figure 4:11 Hex dominant mesh generated for FEA ... 86
Figure 4:12 Shear stress at maximum pullout load ... 88
Figure 4:13 Variation of shear stress along bond length ... 89
Figure 4:14 Normal stress distribution ... 90
Figure 4:15 Comparative study between FEA and experimental results for geopolymer concrete without PVA fiber ... 91
XIV
LIST OF TABLES
Table 2:1 Summary of sample pullout study from previous researches ... 21
Table 2:2 Short summary from current study ... 23
Table 3:1 PVA fiber properties ... 28
Table 3:2 Strain gauge property ... 29
Table 3:3 General calculation for GPC mix design ... 43
Table 3:4 Summary of material considering 20 % wastage for GPC ... 43
Table 3:5 General Calculation for OPC mix design ... 44
Table 3:6 Summary of material considering 20 % wastage for OPC concrete ... 44
Table 4:1 Sieve analysis results ... 55
Table 4:2 Bulk density for coarse and fine aggregates ... 57
Table 4:3 Specific gravity result for coarse and fine aggregates ... 58
Table 4:4 Chemical composition ... 58
Table 4:5 Specific gravity result ... 59
Table 4:6 Tensile test results ... 60
Table 4:7 Compressive test result for each PVA variation ... 63
Table 4:8 Results from tensile stress test ... 65
Table 4:9 Interpolation for strains at 40% of compressive stress ... 68
Table 4:10 Compressive strength of OPC concrete ... 70
Table 4:11 Result summary from pullout test for geopolymer concrete ... 72
Table 4:12 Result summary from pullout test for control specimen ... 74
Table 4:13 Comparative study between current study with Eq. (1) & (2) .... 78
Table 4:14 Materials properties for FEA for the pull-out specimens ... 80
Ordinary Portland cement (OPC) is used as binding agent in concrete mix. The problem
behind to OPCis, it requires large burning fuels which causing carbon emissions to the
atmosphere. Production of OPC is currently exceeding 2.6 billion tons per year worldwide and growing at 5% annually. Five to eight percent of all human-generated atmospheric carbon-di-oxide worldwide comes from the cement industry. Among the greenhouse gases, carbon-di-oxide contributes about 65% of global warming (Sathish et al. 2012).
As a result, it is appropriate to search environmentally friendly binding agents for concrete. Currently geopolymer concrete (GPC) is introduced to reduce the above problem. This concrete made from geopolymer binder, which is an inorganic alumino-silicate materials like fly ash, metakaolin and blast-furnace slag (Majidi 2009). Geopolymer cements don’t need to be fired in production nor do they give off much
CO2 during curing as OPC. The energy required to produce GPC is considerably less
than that required for OPC mixes,resulting up to 80% reduction in carbon dioxide
emissions(Castel & Foster 2015).
2
Research using the pull-out test shows that geopolymer concrete generally provide
better bond strength than OPC concrete (G.B. Maranan, 2015).
Researches shows that PVA fiber improves the mechanical properties of geopolymer concrete such as flexural strength, impact resistance, toughness, and to shift failure mode. The use of short fiber is very preferable due to the simplicity and economical nature in fabrication. Considering the brittle characteristics of hardened GPC, polyvinyl alcohol (PVA) is incorporated to improve the ductility of hardened GPC. The addition of PVA fiber changes the impact failure mode of GPC from a brittle pattern to ductile one, resulting in a great increase in impact toughness (Yunsheng 2008). Another recent research in OPC shows that addition of PVA fibers increases split tensile strength up to 200% from original split tensile of bare paste without fiber. However, another publication states that addition of PVA fibers decreases the workability (Ekaputri 2015).
This research investigates mainly the effect of PVA fiber on bond strength of reinforced geopolymer and OPC concrete. Under this research, pullout test is also conducted to study the bond resistance between concrete matrix and reinforcing bars. In addition, compressive test for each variations are done with regard to standard codes and specification. Afterward, based on the experimental analysis, results are compared accordingly:
Frist, the maximum stress from experimental analysis are compared
with approximate bond strength estimation by using compressive strength of the concrete, cover, diameter of bar, and bond length.
Second, the pullout result for geopolymer concrete is compared with the
control specimen, i.e. OPC concrete.
Third, the result verification of maximum stress from 3D-finite element
model analysis were conducted with experimental pull out test results.
3
investigate the effect of PVA fiber on bond strength, PVA fiber of 0%, 0.2%, 0.4%, 0.6% and 0.8% by volume for both geopolymer and OPC concrete specimens were used. Reinforcement bar with diameter of 16mm, without lateral confinement will be used by providing bond length of 8cm, i.e. five times the diameter of bar. Class F fly ash were used as a binder in geopolymer concrete and alkaline solution of sodium silicate to sodium hydroxide ratio of 2.5 by mass ratio were also used. Analytical methods from high strength Portland concrete were used to predict the test results. Concrete specimen of 150x150mmx150mm cube was used.
In addition to experimental tests, finite element analysis (FEA) was applied by using ANSYS software to confirm maximum stress that occurs around bond. Finally the bond stress versus slip relationships is constructed for each variation, which allowed to estimate bar development length for reinforced concrete structures. Test specimen for pull out test of 150mm x150mmx 150mm concrete cube for the chosen reinforcing bar
were used according to Indian Standard Methods of Testing Bond in Reinforced
Concrete (IS : 2770 1967).
1.2 Objectives
The main objectives of this research are:
To investigate the effect of PVA fiber on pull-out strength in PVA fiber
blended class F fly ash geopolymer concrete by using different PVA fiber content.
To determine the optimum PVA fiber content for geopolymer concrete
mix that resulted optimal bond strength.
To conduct comparative study for the pullout results with bond strength
prediction formulas in ordinary Portland cement concrete.
To conduct Finite Element Analysis to validate the results from
4
1.3 Problem statements
In structural design of any kind, there are basic design requirements that should be taken into consideration. These requirements depend on design philosophy and the design code to be used. It is obvious that in condition where there are well defined design code, building materials and design philosophy available, structural design will be safe and easily to handle .However, currently design of structures using GPC is very rare due to few researches done on structural requirement as OPC. Therefore, research questions are:
How much PVA fiber will be applied in the geopolymer concrete mix to
obtain optimum bond strength?
How much maximum load can be resisted by the concrete before failure
for each variation of PVA fiber?
How bond strength and slip varies for different PVA percentage content?
How stresses are distributed under concrete matrix during pullout
loading?
1.4 Purpose
The benefits of this research is to study the bond improvement by adding PVA fiber into concrete mix. So that it deliver an important information about bond performance criteria on which designers can rely. This study provides:
Appropriate PVA fiber percentage which can be applied into concrete mix, so that the concrete matrix and re-bars have optimal bond.
The ultimate Load that breaks the adhesive bond between concrete interface and rebar
Results showing how bond stresses distribute along the bond length.
5
CHAPTER-2.
LITERATURE REVIEW
2.1 Introduction
Since 1824,after discovery of cement by Joseph Aspdin, Portland Cement Concrete is
one of the most widely used construction materials over the world. As the demand for concrete as a construction material increases, the demand for Portland cement also increases. Currently the usage of Ordinary Portland cement (OPC) as the primary binder to produce concrete is increasing due to many infrastructure construction. The
problem with Ordinary Portland cement (OPC) concreteis that it requires large kilns
burning fossil fuels to produce Portland cement causing air pollution and carbon emissions(MCCAFFREY 2002; Djwantoro Hardjito, Steenie E. Wallah, Dody M.J, Sumajouw 2003).
According to Davidovits, the production of geopolymer cement does not require more calcination of calcium carbonate, unlike ordinary Portland cement (OPC), which results from the calcination of limestone (calcium carbonate) and silico-aluminous material reaction. Furthermore, he coined that production of 1 tone of OPC directly
generates 0.55 tons of CO2. In contrary, the production of 1 tone of geopolymer cement
generates 0.184 tons of CO2 from combustion carbon-fuel, compared with 1.00 tons of
CO2 for Portland cement. That shows geopolymer cement generates 5-6 times less CO2
6
Figure 2:1 CO2 emissions during OPC manufacture for countries
(Davidovits, 2002).
In the same paper Davidovits had stated that different countries have different CO2
emission rate and China is the leading country by CO2 emission from Portland cement
factory ash shown in Fig. 2-1. Still now, the use of Portland cement as binder material
in construction is ongoing due urbanization and big infrastructure projects in different countries. Hence suitable ecofriendly alternative cement binder would needed to overcome environmental pollution. Currently geopolymer concrete had drawn the attention of researchers because of its lower carbon foot print and potential superiority over OPC in terms of its mechanical properties (Hardjito et al. 2005; Raijiwala 2011)
2.2 Geopolymer Concrete
2.2.1 Definition
7
occurring zeoltic materials, but their microstructure is amorphous instead of crystalline (Hardjito et al. 2005). According to Davidovits, the polymerization process involves a chemical reaction under highly alkaline conditions on Al-Si minerals, yielding polymeric Si-O-Al-O bonds and he proposed that an alkaline liquid could be used to react with silicon (Si) and aluminum (Al) in a source material of geological origin to produce binders (Jaarsveld & Deventer 1997; J.Davidovits 1991). Therefore, because the chemical reaction that takes place is a polymerization reaction, the term geopolymer was used to represent this reaction (J.Davidovits 1991);(Damian 2011).
The two main constituents of geopolymer are the source materials and the alkaline liquids. The source materials for geopolymer based on alumina–silicate should be rich in silicon (Si) and aluminum (Al).These could be natural minerals from kaolinite, clays. Alternatively, materials such as fly ash, silica fume, slag, rice-husk ash and red mud could be used as source materials for geopolymer concrete production(Damian 2011) . Factors such as availability, cost, type of application, and specific need of the users determine choosing of source material for making. Alkaline liquids are used to make geopolymer paste, which are usually sodium or potassium based. The most common alkaline solution used in geopolymer concrete is a combination of sodium hydroxide (NaOH) or potassium hydroxide (KOH) and sodium silicate or potassium silicate (Wallah 2006).
The number of scientific papers dealing with geopolymer science and technology before twenty five years ago are very few. But it shows that there is strong increase in
geopolymer research during last five years. Figure 2:2 shows the evolution of the
8
Figure 2:2 Geopolymer research progress two decades (Geiger, 2011)
2.2.2 Engineering properties
Due to good mechanical properties, geopolymer matrices have attracted significant attention in recent years. Geopolymer as novel cementitious materials, compressive strength is an important factor. According to previous publications, geopolymer concrete has high early strength, low shrinkage, freeze-thaw resistance, sulfate resistance and corrosion resistance (Majidi 2009; Kannapiran et al. 2013; Ariffin 2013). It also indicated that the compressive strength in GPC was higher over
controlled OPC as shown in Fig 2:3. Even though, the mechanical properties of
9
Figure 2:3 Mechanical strength of fly ash geopolymer (Palomo &
Fernández-jiménez 2011).
2.2.3 Factors that affects engineering properties
a) Alkaline ratio
Previous researches stated that Sodium silicate to Sodium hydroxide ratio between 2.0 to 3.3 provides better compressive strength of up to 71 MPa (Hardjito et al. 2005). More recently Sourav, stated that a mass ratio of sodium silicate to sodium hydroxide of 2.50 gives the optimum compressive strength (Das et al. 2014).
b) Molarity of alkaline solution
10
2011). However, 12M concentration of NaOH is ultimately the most recommended solution even if it gives slightly less strength compared with 14M and 16M, in which the later gives denser and less workable paste (S. V. Joshi and M. S. Kadu, 2012).Recent study by Raijiwala also show the increase in molarity of alkali solution has siginificant
impact on compressive strength of geopolymer concrete as shown in Fig 2:4 (D.B.
Raijiwala, 2011).
Figure 2:4 ; Strength gain with variation in molarities
(D.B. Raijiwala, 2011) c) Fineness of Fly Ash
The fineness of fly ash is also a major factor on the strength of the geopolymer concrete. It had been studied that fly ash with good fineness values results up to 80
MPa of strength at 24hrs continuous curing at 900C (Naganathan & Linda 2013).
According to Naganathan & Linda, lower fineness value of fly ash decreases the
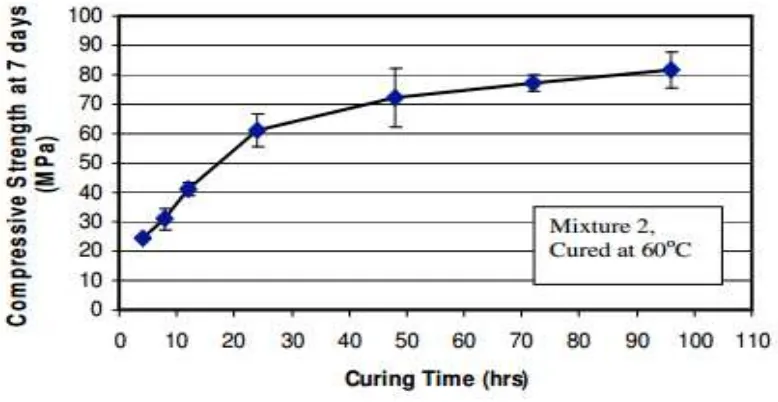
11 d) Curing temperature
In geopolymer concrete curing temperature is an important factor to obtain a better strength. The main polymerization process or the chemical reaction of geopolymer concrete takes place with the temperature imposed during the curing and it may attain almost its 70% strength with in the first 3 to 4 hours of hot curing (Anon 2014; Kong
& Sanjayan 2010). As shown in Fig 2:5, longer curing time enhanced the
polymerization process and results in a higher compressive strength (Hardjito &
Rangan 2005). According to Sourav, The rate of increase of strength is rapid in the initial 24 hours of curing beyond that the gain of strength was moderate so the specimens should be cured for 24 hours only which will sufficient enough (Das et al. 2014) . As stated in previous researches, the curing which is done for geopolymer is
hot steam curing or normal hot curing in oven with in a temperature of 600C-900C for
24 hours The curing temperature of 600C is more effective than other temperature or
can be said is the optimum curing temperature. Beyond 600C it doesn’t affect the
polymerization process significantly (Das et al. 2014).
Figure 2:5 Influence of Curing Time on Compressive Strength
12 e) Aggregate content
The proper selection of all aggregates and its ratio of fine aggregate to total aggregate content improves modulus of elasticity and Poisson’s ratio of geopolymer concrete(Joseph & Mathew 2012). At the same time, the split and flexural tensile strength increased for the total content varied from 60% to 75% (with a constant fine aggregate to the total aggregate ratio of 0.35). In addition, higher and more stable strength values can be achieved when there is an optimum surface area for interfacial bonding between the geopolymer matrix and the aggregate (Isabella et al. 2003).
2.2.4 Economic Benefits
According to previous researches, Class F fly ash geopolymer concrete yields several economic benefits over Portland cement concrete. Loyad and Rangan under their publication stated that, very little drying shrinkage, the low creep, excellent resistance to sulfate attack, and good acid resistance offered by low-calcium fly ash-based geopolymer concrete may yield economic benefits when it is utilized in infrastructure applications. The overall prices of geopolymer concrete is almost 10%
to 20% less than the same quantity of fly Portland cement concrete. In addition, In
addition, the appropriate usage of one ton of fly ash earns approximately one carbon-credit that has a redemption value of about 10 to 20 Euros. Based on the data given in this paper, one ton low-calcium fly ash can be utilized to manufacture approximately 2.5 cubic meters of high quality fly ash-based geopolymer concrete, and hence earn monetary benefits through carbon-credit trade (Wallah 2006).
2.3 Polyvinyl Alcohol Fiber (PVA)
13
(Juarez et al. 2015). The following sections will discuss how PVA fibers improves engineering properties in concrete work.
2.3.1 Reduces plastic shrinkage cracking
According to American Concrete Institute manual, there are two causes that creates plastic shrinkage cracking in concrete structures. The first one is, the loss of water that occurs after concrete casting and its exposure to ambient temperature produces deformation due to volumetric changes. And the second one is, the water consumption due to hydration reactions of Portland cement leads to a reduction of the solid’s volume, which generates internal deformations in the concrete. These cracks can be reduced by using PVA fiber. The effective use of PVA fiber can result about 93% reduction in plastic shrinkage cracking (Juarez et al. 2015).
2.3.2 Improves flexural resistance
Experimental work done by Jang, resulted that employing of PVA fiber improves the elasticity property of concrete. The loss of compressive strength and flexural strength from the freezing and thawing action reduced by utilization of PVA fiber (Jang et al. 2014). In addition, the addition of PVA fiber enhances toughness, and prevents the sudden brittle failure of concrete. This due to very strong fiber–matrix bond resulting from high chemical bonding caused the micro-fibers to rupture instead of being pulled out. Larger ductility may be achieved by fiber pullout rather than rupture (Hamoush et al. 2010; Luo et al. 2013).
2.3.3 Improves compressive and splitting tensile strength
14
2.4 Bond Strength
Bond strength of reinforced concrete is the shear resistance between a bar and the surrounding concrete matrix. This bond between concrete and reinforcement is one of the most important contributing factors in modern concrete structures. Because concrete has such a low tensile strength the proper functioning of any concrete system that contains any significant tensile forces relies completely on the strength of the bond between itself and the steel reinforcement (Damian 2011). Due to longitudinal force transfer from the reinforcement to the surrounding concrete, the force in the reinforcing bar change along its length, as does the force in the concrete embedment. Wherever steel strains are differ from concrete strains, a relative displacement between the steel and the concrete (slip) does occur. But thus lack of compliance is also the effect of highly localized strains in the concrete layer closest to the reinforcement (Tastani & S. J. Pantazopoulou 2002).
The resistance mechanisms upon which steel-to-concrete bond in Portland cement concrete are already well known due many research tests. But researches done on steel-to-concrete bond in geopolymer concrete are very few. Some researches show that geopolymer concrete has better bond resistance than OPC concrete (Ginghis Maranan, 2015).
The factors that affect the bond strength are many and their interactions are complex. Almost any variation in the chemical or physical characteristics of either the concrete or the steel bars is likely to have some effect on the ultimate strength of the bond. However, the most significant factors relating to the bond strength developed between the concrete and the reinforcement are; concrete strength, Rebar diameter and cover, chemical adhesion, friction and mechanical Interlock (Damian 2011)
2.4.1 Factors related to the bond strength development
15
The bond strength increased with reduction of the w/c ratio of concrete mixes, resulting in higher bond strength in the case of high strength concrete. Concrete strength is the most important factor to control bond strength. Splitting failure takes place when the tensile hoop stress exceed the tensile strength of the surrounding concrete. As a consequence of splitting failure, bond stress in the bar is lost abruptly and the residual bond strength is practically zero (Muñoz 2011).
According to previous studies, it is possible to estimate the bond strength by using concrete compressive strength. Some of the approximate formulations are given below.
fb = 2.5 ∗ fc0.5 (1)
Where; fc′ is the concrete compressive strength (MPa)
τmax = (0.672 ∗ (dc
Equations (1) and (2) are recommended expressions to estimate the bonding stress from (ARAÚJO 2013; Asl, Farhadani 2012),respectively
b) Rebar Diameter and cover
16 c) Chemical adhesion and Friction
Chemical Adhesion comes from the weak chemical bonds between the steel and the concrete. This weak adhesion is the first resisting mechanism for small bond stresses. Once the bond stress becomes too great for the weak chemical adhesion to resist and slip commences, frictional forces take over to take up the additional bond stress. Frictional adhesion depends upon the surface roughness of the reinforcement bar and the strength of the surrounding concrete. A stronger concrete will obviously result in a stronger bond to the steel. The quality of the concrete and the amount of voids it contains is also a factor that will increase the frictional adhesion. Fewer voids mean more surface area contact with the reinforcement bar and therefore a greater frictional adhesion that will hold to the steel longer. Frictional adhesion is the primary resisting mechanism for smooth reinforcement bars(Damian 2011).
d) Mechanical Interlock
Mechanical interlock is the primary resisting mechanism for standard steel reinforcement bars and is by far the greatest contributor to bond strength. This mechanical interlock can be caused by two actions. It can be the bearing stress against the face of the lug or the shearing stress on the concrete surface developed between the lugs as shown in the figure (Damian, 2011).
2.4.2 Bond failure types
17
taken as the ultimate bond strength. Furthermore, the loads at which the slippage or splitting occurs should define the point at which either bond failure by slippage or splitting occurs (Damian, 2011).
There are two types of bond failures, pull out and splitting failure. Pull out failure is likely to occur when the concrete in between the reinforcing steel bar ribs is weak and surrounding concrete is strong. In case of splitting type of failure large compressive stress occur on the contact point in front of the rib. These stress are inclined from the out wards the rib and the rib exerts equal and opposite stresses (ACI 318-08 ,2008) (Damian, 2011)..
2.5 Pullout Test
According to researchers conducted on reinforcing bars pull out tests, the steel-concrete bond is very complex phenomenon. Connection between the reinforcement bars and concrete which prevents slipping between each other depends on the surface of bars. For smooth bars, the bond is mainly consists of chemical adhesion between the cement paste and the bars where as in deformed bars, the strength in slipping is mainly due to the mechanical action between concrete and the ribs. Pull-out tests are usually used to study of bond performance of steel reinforcing bars and concrete. Pull out tests have been widely adopted because they offer an economical and simple solution for the evaluation of the bond performance of reinforcing bars (Tastani & S. Pantazopoulou 2002)
18 u = Pmax
πdbLd
(3)
𝑤ℎ𝑒𝑟𝑒 𝑃𝑚𝑎𝑥 = 𝑚𝑎𝑥𝑖𝑚𝑢𝑚 𝑝𝑢𝑙𝑙𝑜𝑢𝑡 𝑙𝑜𝑎𝑑,𝑑𝑏
= 𝑑𝑖𝑎𝑚𝑒𝑡𝑒𝑟 𝑜𝑓 𝑡ℎ𝑒 𝑏𝑎𝑟 𝑎𝑛𝑑 𝐿𝑑 𝑖𝑠 𝑒𝑚𝑏𝑒𝑑𝑒𝑑 𝑏𝑎𝑟 𝑙𝑒𝑛𝑔𝑡ℎ
According to previous researches, the interaction between concrete and rebar subjected to pull out test force is characterized by four different stages as shown in
Fig.2:6 (FIB Bulletin 10, 2000, (Muñoz 2011)).
Figure 2:6 Steel-concrete local bond stress slip law FIB Bulletin 10 (Muñoz 2011)
Stage I (uncracked concrete): In this stage bond strength is mostly assured by
chemical adhesion and low bond values 𝜏 ≤ 𝜏1 = (0.2 − 0.8)𝑓𝑐𝑡 occurs. The bar slip
is considered as negligible. However, highly localized stress occur close to lug tips.
Stage II (first cracking): First cracking experienced in this stage. And for higher
bond stress values 𝜏 > 𝜏1, the chemical adhesion breaks down; in deformed bars the
19
at the tips of the lugs allowing the bar to slip as shown in Fig. 2:7 (a). However, the
wedging action of the lugs remains limited and there is no concrete splitting.
(a) Bar-concrete slip and wedging action of the bar
(b) Transverse cracks and splitting (Muñoz 2011)).
20
𝑊ℎ𝑒𝑟𝑒; 𝑃 ∗ 𝑖𝑠 𝑏𝑒𝑎𝑟𝑖𝑛𝑔 𝑠𝑡𝑟𝑒𝑠𝑠𝑒𝑠 𝑖𝑛 𝑡ℎ𝑒 𝑐𝑜𝑛𝑐𝑟𝑒𝑡𝑒 𝑎𝑛𝑑 𝑃 ∗ ∗ 𝑡ℎ𝑒 𝑜𝑢𝑡𝑤𝑎𝑟𝑑 𝑐𝑜𝑚𝑝𝑜𝑛𝑒𝑛𝑡𝑠 𝑜𝑓 𝑡ℎ𝑒 𝑝𝑟𝑒𝑠𝑠𝑢𝑟𝑒
Stage III: In this stage as shown in Fig 2:7(b), for this stage also higher bond stress values, i.e.𝜏 > (1 − 3)𝑓𝑐𝑡, longitudinal cracks (splitting cracks) spread radially, the wedging action also enhanced by the crushed concrete. And the outer ward component of the pressure is resisted by the hoop stresses in the surrounding concrete. In this stage gradually more or less sudden failure occurs depending on the transverse confinement. In a case of heavy transverse reinforcement or large concrete cover, through splitting is prevented by their confining action and concrete splitting remains limited to a cracked core around the bar (stage IVc, Pull-out failure).
Stage IVa: This stage immediately follows the breaking of adhesive bond in plain bars. Force transfer is provided by friction and strongly affected by the transverse pressure, in which concrete shrinkage and bar roughness favor friction.
Stage IVb: In this stage deformed bars confined by light-to-medium transverse reinforcement. The longitudinal cracks (splitting cracks) break out through the cover and the bar spacing, and the bond tends to fail abruptly. But if sufficient transverse reinforcement (stirrups) is provided, bond can be assured in spite of concrete splitting, because of the confinement action developed by the reinforcement.
Stage IVc: In this case the force transfer mechanism changes from rib bearing to friction. Deformed bars confined by heavy transverse reinforcement, splitting does not occur and bond failure is caused by bar pull-out.
21
Table 2:1 Summary of sample pullout study from previous researches
No.
References Parameters Test specimen/mold
configuration
Experimental/Schematic Pullout test setup
Sample Bond strength versus slip plots
Compressive strength
of concrete in a range of
27.4-33MPa
2 (Hameed et
al. 2013)
Hybrid fiber-reinforced
Concrete
Compressive strength
of concrete in a range of
42-50MPa
Diameter of pullout
bar-12mm (deformed)
22
3 (Maranan
et al. 2015)
Geopolymer Concrete
Compressive strength
of concrete in a range of
33MPa
*GFRP bar
diameter-12.7,15.9, and 19.0mm
Bond length 5,10, and
15db
4
(Castel & Foster 2015)
Geopolymer concrete
and OPC Concrete
(control)
12mm diameter bars
(smooth and deformed)
Bond length 5db
Cross-sections of specimen
100×100 mm
23
Hence, the current study was developed from pervious researches considering the experimental setups as given in reference
[2] in Table 2:1. Table 2:2 summarizes the study parameters, experimental setups and sample result from this study.
Table 2:2 Short summary from current study
References Parameters Test specimen/mold
configuration (unit in mm)
Experimental/Schematic Pullout test setup
Sample Bond strength versus slip plots
Current study (Kefiyalew)
Geopolymer Concrete
Main variable-PVA
fiber content
Compressive strength
of concrete in a range
of 36.08-43.16MPa
Diameter of pullout
bar-16mm
(deformed).
24
Prepare Compressive test specimen for OPC and GPC using 20cm high and dia_10cm cylinder
Test the specimens at age of 28 days
Strain
If the deviation of compressive strength between OPC and GPC is
Prepare Pull out test specimen
Pull out test, test specimens at 28 days age
Result and Discussion
FINSH
Finite Element(FE) Analysis
Compare FE analysis with Experimental Results, if the result is…..
OK! Not OK! Repeat
Conclusions Do material testing according to
standards Use available material test data’s
Direct tensile test
Test for Modulus of Elasticity and
poison’s ration
Cure(wet) the specimen for 28 days
26
3.1 Introduction
In this section, mainly constitute materials for geopolymer concrete specimen, Preliminary tests for constitute materials, mix design, pull out test preparation, experimental set up, direct cost of the research and schedule were discussed.
3.2 Preparation of Materials
In order to study the bond performance of reinforcement bar in geopolymer concrete, different materials were used for specimen preparation. Materials that are used for making fly ash based geopolymer concrete specimen are:
Fly ash(class F fly ash)
Cement
Coarse and fine aggregates
Reinforcement bar
Alkali activator (NaOH & Na2SiO3)
Polyvinyl Alcohol(PVA)
Strain gauge
PVC
3.2.1 Fly ash
Fly ash was used as a binder material in this research was class F fly from PT. Petrokimia Gresik, Indonesia. It is available with low lime content and greater combination of silica, alumina and iron.
3.2.2 Cement
27
3.2.3 Coarse and fine aggregates
Local aggregates, coarse and fine aggregates, which were used in this research, were from PT.Surya Beton Indonesia. Coarse aggregate from crushed stone with maximum size less than 14mm and fine aggregate of sand in saturated dry condition were used.
3.2.4 Reinforcement bar
Deformed reinforcing bar with diameter of 16mm was used in order to perform pull out test to investigate and compare bond performance of geopolymer concrete with OPC concrete.
3.2.5 Alkali activator (NaOH & Na2SiO3)
The alkaline solution was used from combination of sodium silicate solution and sodium hydroxide solution. The sodium silicate solution (Na2O= 18%, SiO2=36%, and water=46% by mass) was purchased from a local supplier in bulk. The sodium hydroxide (NaOH) with in flakes form was also purchased from a local supplier in bulk. The sodium silicate to sodium hydroxide ratio of 2.5 by mass is used.
3.2.6 Polyvinyl Alcohol (PVA)
28
Figure 3:2 PVA fiber
The physical characterizes of the PVA fiber is given in Table 3:1. Table 3:1 PVA fiber properties
Fiber
29
3.2.8 Strain gauge
TML strain gauge type FLA-2-11-1L was used in this research. Its properties is given in Table 3:2. This strain gauge was used to measure the longitudinal and transverse strain to calculate modulus of elasticity and poison’s ratio of geopolymer concrete.
Table 3:2 Strain gauge property
Strain gauge Type FLA-11-1L
Gauge length (mm) 2
Gauge factor 2.12 ± 1%
Gauge resistance 120.3 ± 0.5φ Thermal expansion 1.8x10⁻⁵/c
3.3 Testing for Materials
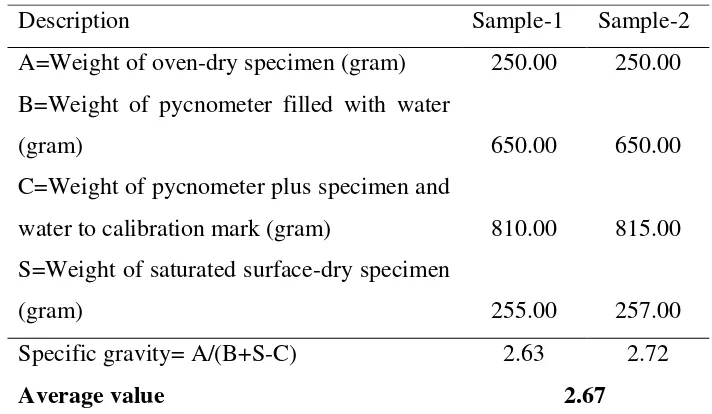
3.3.1 Fly ash test
The chemical composition test for fly ash using XRF test results conducted at PT Sucofindo, Indonesia. The chemical composition are adopted from the research done using this fly ash type.
3.3.2 Coarse and fine aggregates
1) Fine aggregates
a) Sieve Analysis (according to ASTM C 136-96a / AASHTO T 27-99l/)
Scope/significance
This method covers the determination of the particle size distribution of fine aggregates by sieving
Apparatus
30
Sieves: Meeting the requirements of AASHTO M 92
Mechanical Sieve Shaker: Meeting the requirements of AASHTO T 27
Containers and Utensils: A pan or vessel of a size sufficient to put the sample
Oven: An oven of appropriate size capable of maintaining a uniform temperature of 110 ± 5°C.
Procedure
i. Prepare the test sample and dry it to constant mass at a temperature of 110 ± 5oC and determine the mass of it to the nearest 0.1% of the total original dry sample mass.
ii. Select suitable sieves.
iii. Add test sample over the nested sieve and continue sieving for sufficient period (around 10 minutes).
iv. After finishing sieving, weigh mass retained on each sieve and record. v. Report percent passing or retained and make plot.
Calculation Percent Retained:
IPR =IMPM ∗ 100 or CPR =CMRM ∗ 100 (4) Where:
IPR = Individual Percent Retained CPR = Cumulative Percent Retained M = Total Dry Sample mass
IMR = Individual Mass Retained CMR = Cumulative Mass Retained Percent Passing:
31 Where:
PP = Percent passing
PPP = Previous Percent Passing
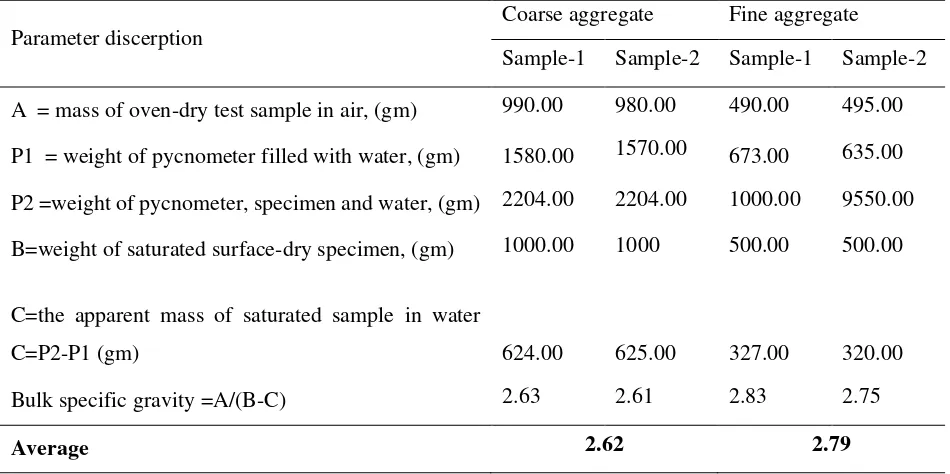
b) Specific gravity and absorption of fine aggregate (according to ASTM C128-88/AASHTO T84-93)
Scope/significance
This method covers the determination of bulk and apparent specific gravity, and absorption of fine aggregate. In this research it is used for calculation of the volume occupied by the aggregate in geopolymer concrete & Portland cement concrete,
Apparatus
Balance: conforming to the requirements of AASHTO M 231, Class G2
Pycnometer: a flask or other suitable container into which the fine aggregate test sample can be readily introduced and in which the volume content can be reproduced with ± 0.1 cm3
Mold: A metal mold is in the form of a frustum of a cone with dimensions according the code
Tamper: A metal tamper according to the code.
Thermometers:
Procedure
i. Prepare test sample
ii. Make and record all weight determinations to 0.1 g iii. Partially fill the pycnometer with water
iv. Immediately introduce 500 ± 10 g of saturated surface-dry fine aggregate prepared into the pycnometer and fill with additional water to approximately 90 percent of capacity Roll, invert, and agitate the pycnometer to eliminate all air bubbles
32
vi. Remove the fine aggregate from the pycnometer, dry to constant weight at a temperature of 110 ± 5°C and weigh.
vii. Determine the weight of the pycnometer filled to its calibration capacity with water at 23 ± 1.7°C
Calculation
Bulk specific gravity calculated as:
𝐵𝑢𝑙𝑘 𝑠𝑝. 𝑔 =(𝐵 + 𝑆 − 𝐶)𝐴 (6)
Where:
A=weight of oven-dry specimen in air, g, B=weight of pycnometer filled with water, g,
C=weight of pycnometer with specimen and water to calibration mark, g, and
S=weight of saturated surface-dry specimen, g. Percentage of absorption calculated as:
𝐴𝑏𝑠𝑜𝑟𝑝𝑡𝑖𝑜𝑛, % =(𝑆 − 𝐴)𝐴 ∗ 100 (7)
c) Bulk Density (“Unit Weight”) and Voids content test (according to ASTM C29/29M_97 (2003)
Scope/significance
This test is conducted to calculate the bulk density (“unit weight”), voids between particles of aggregates. It is used to determine bulk density values that are necessary for use for many methods of selecting proportions for concrete mixtures and mass/volume relationships.
33
Balance: Scale accurate within 0.1 % of the test load at any point within the range of use, graduated to at least 0.05 kg.
Tamping Rod: A round, straight steel rod, 16 mm in diameter and approximately 600 mm in length, having the tamping end.
Measure: A cylindrical metal measure, preferably provided with handles.
Shovel or Scoop: A shovel or scoop of convenient size for filling the measure with aggregate.
Calibration Equipment: A piece of plate glass, preferably at least 6 mm thick and at least 25 mm larger than the diameter of the measure to be calibrated.
Procedure(shoveling procedure)
i. Record the mass of the measure alone.
ii. Fill the measure to overflowing by means of a shovel or scoop, discharging the aggregate from a height not to exceed 50 mm above the top of the measure.
iii. Level the surface of the aggregate with the fingers or a straightedge in such a way that any slight projections of the larger pieces of the coarse aggregate approximately balance the larger voids in the surface below the top of the measure.
iv. Determine the mass of the measure plus its contents’
v. Record the values to the nearest 0.05 kg.
Calculation
Bulk Density:
𝑀 =(𝐺 − 𝑇)𝑉 (8)
Where:
34 T = mass of the measure, kg, V = volume of the measure, m3
Void content:
%𝑣𝑜𝑖𝑑𝑠 =[(𝑆 ∗ 𝑊) − 𝑀)(𝑆 ∗ 𝑊) (9)
Where:
M = bulk density of the aggregate, kg/m3
S = bulk specific gravity (dry basis) as determined in accordance with Test Method C 127,
W = density of water, 998 kg/m3. 2) Coarse aggregates
a) Sieve Analysis(according to ASTM C 136-96a / AASHTO T 27-99l/)
Scope/significance
This method covers the determination of the particle size distribution of fine and coarse aggregates by sieving
Apparatus
Balance: The balance shall have sufficient capacity, be readable to 0.1% of the sample mass, or better
Sieves: Meeting the requirements of AASHTO M 92
Mechanical Sieve Shaker: Meeting the requirements of AASHTO T 27
Containers and Utensils: A pan or vessel of a size sufficient to put the sample
Oven: An oven of appropriate size capable of maintaining a uniform temperature of 110 ± 5°C.
35
i) Prepare the test sample and dry it to constant mass at a temperature of 110 ± 50C and determine the mass of it to the nearest 0.1% of the total original dry sample mass.
ii) Select suitable sieves.
iii) Add test sample over the nested sieve and continue sieving for sufficient period (around 10 minutes).
iv) After finishing sieving, weigh mass retained on each sieve and record.
v) Report percent passing or retained and make plot.
Calculation
IPR = Individual Percent Retained CPR = Cumulative Percent Retained M = Total Dry Sample mass
IMR = Individual Mass Retained CMR = Cumulative Mass Retained Percent Passing:
PP = PPP − IPR or PP = 100 − CPR (11)
Where:
PP = Percent passing
PPP = Previous Percent Passing
b) Specific gravity and absorption test (according to ASTM C127_88 (1993)
36
This test in this research were used for the calculation of the volume occupied by the aggregate in geopolymer concrete
Apparatus
Balance: conforming to the requirement of M 231, class G 5.
Sample container: a wired basket of 3.35mm (No.6) or finer mesh, or bucket with capacity of 4 to 7 L.
Water tank: a watertight tank into which the sample and container are placed for complete immersion while suspended.
Sieves: a 4.75-mm (No. 4) sieve or other sizes
Oven
Procedure
i. A sample of aggregate is immersed in water for approximately 15 hours to essentially fill the pores.
ii. After 15 seconds weighed the sample while submerged in water
iii. Removed the sample from the water, the water dried from the surface of the particles, and weighed.
iv. Finally the sample is oven-dried and weighed a third time.
v. Using the mass and weight measurements thus obtained and formulas in the method, it is possible to calculate three types of specific gravity and absorption.
Calculation
Bulk specific gravity: is calculated as follows;
Bulk sp. gr (saturated − surface − dry), S =(B − c)A (12)
Where:
A = mass of oven-dry test sample in air, g;
37
Absorption: Calculated as follows:
𝐴𝑏𝑠𝑜𝑟𝑝𝑡𝑖𝑜𝑛, % =(B − A)A ∗ 100 (13)
c) Bulk Density (“Unit Weight”) and Voids content test (according to ASTM
C29/C29M_97 (2003)
Scope/significance
This test is conducted to calculate the bulk density (“unit weight”), voids between particles of aggregates. It is used to determine bulk density values that are necessary for use for many methods of selecting proportions for concrete mixtures and mass/volume relationships.
Apparatus
Balance: Scale accurate within 0.1 % of the test load at any point within the range of use, graduated to at least 0.05 kg.
Tamping Rod: A round, straight steel rod, 16 mm in diameter and approximately 600 mm in length, having the tamping end.
Measure: A cylindrical metal measure, preferably provided with handles.
Shovel or Scoop: A shovel or scoop of convenient size for filling the measure with aggregate.
Calibration Equipment: A piece of plate glass, preferably at least 6 mm thick and at least 25 mm larger than the diameter of the measure to be calibrated.
Procedure(shoveling procedure)
vi. Record the mass of the measure alone.
38
viii. Level the surface of the aggregate with the fingers or a straightedge in such a way that any slight projections of the larger pieces of the coarse aggregate approximately balance the larger voids in the surface below the top of the measure.
ix. Determine the mass of the measure plus its contents’ x. Record the values to the nearest 0.05 kg.
Calculation
Bulk Density:
𝑀 =(𝐺 − 𝑇)𝑉 (14)
Where:
M = bulk density of the aggregate, kg/m3, G = mass of the aggregate plus the measure, kg, T = mass of the measure, kg,
V = volume of the measure, m3
Void content:
%𝑣𝑜𝑖𝑑𝑠 =[(𝑆 ∗ 𝑊) − 𝑀)(𝑆 ∗ 𝑊) (15)
Where:
M = bulk density of the aggregate, kg/m3 S = bulk specific gravity (dry basis) W = density of water, 998 kg/m3.
3.3.3 Reinforcement bar
39 a) Tension test
Scope/significance
This test was carried out to obtain the stress-strain diagram, to determine the tensile properties and hence to get valuable information about the mechanical behavior and the engineering performance of the material.
Apparatus
Hydraulic Testing Machine:
Recorder (mounted computer with the tests Machine): plots the variation of load against time
Procedure
i. Put gage markers on test specimen of 16mm deformed and smooth bars and measure the initial gage length and diameter of bar
ii. Select a load scale and conduct the test until fracture
iii. Record maximum load at yielding, onset of neck(at tensile strength point) and fracture zone
Calculation
a. Calculate the strength parameters
Yield stress,
𝜎𝑦 =𝑃𝑦𝐴𝑜 (16)
Tensile strength ;
𝜎𝑢 =𝑃𝑚𝑎𝑥𝐴𝑜 (17)
Fracture Stress; Where:
P
y = yield loadP
max= maximum load
40
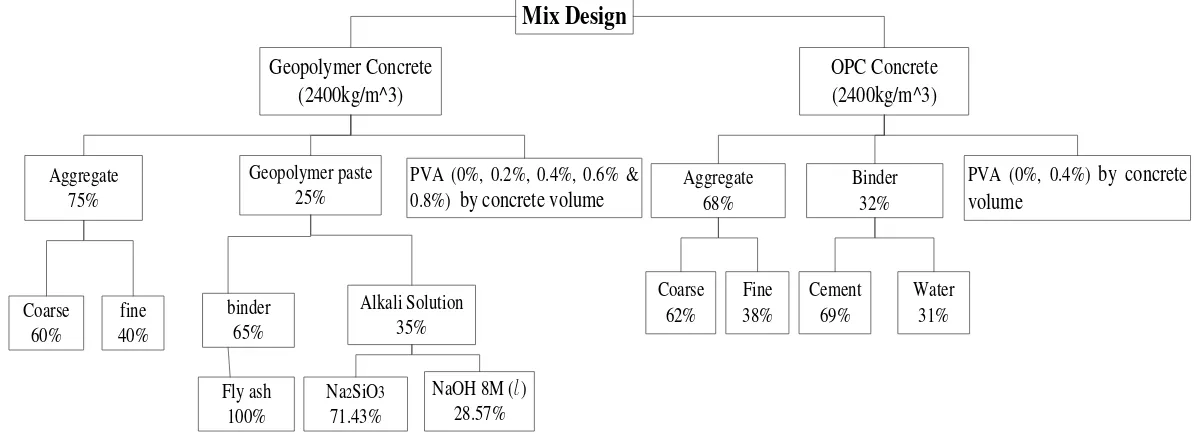
3.4 Mix Design
Mix design is first needed to make suitable specimen sample which can guarantee satisfactory properties of concrete in every detail for the particular job. The mix design that was used in this research is presented in Fig. 3:3.
Mix Design
0.8%) by concrete volumeCoarse
41
3.4.1 Calculation of constituent material for concrete mix:
Mix design calculation and final mass for each constituent material is given in table 3:4 & 3:5.The amount of PVA fiber (0%, 0.2%, 0.4%, 0.6% and 0.8% by total volume was added calculated as follow for 1m3 both forGPC and OPC concrete:
Total Volume (VT) = 1m3 +VPVA (Volume of PVA) For 0.2% addition PVA fiber:
VPVA = 0.2% (1m3 +VPVA) 0.998 VPVA =0.2% *1m3 VPVA =2.004*10-3m3 VPVA =2004cm3 For 0.4% addition PVA fiber:
VPVA = 0.4% (1m3 +VPVA) 0.996 VPVA =0.4% *1m3 VPVA =4.016*10-3m3 VPVA =4016cm3 For 0.6% addition PVA fiber:
42 VPVA =6036cm3 For 0.8% addition PVA fiber:
VPVA = 0.8% (1m3 +VPVA) 0.992 VPVA =0.8% *1m3 VPVA =6.0645*10-3m3 VPVA =6064.5cm3
a) Geopolymer concrete mix design
Mass Calculation for 1m3 is given as follows: density=2400Kg/m3=2.4gr/cm3
MGPC = mass for 1m3
M1= mass for 150x150x150mm cube
V1= 3.375*10-3 m3 (Volume for 150x150x150mm mold) 1cm3 PVA=1.3gram (from density of PVA)
So,
i. VPVA =2004cm3→2.61Kg
ii. VPVA =4016cm3→5.22Kg
iii. VPVA =6036cm3→7.85Kg
43
Table 3:3 General calculation for GPC mix design
Materials Name Calculation MGPC (Kg/m3) M1(Kg)
Aggregate 0.75*2400 1800.00 6.08
Coarse 0.60*1800 1080.00 3.65
Fine 0.40*1800 720.00 2.43
Geopolymer Paste 0.25*2400 600.00 2.03
Binder 0.65*600 390.00 1.32
Alkali solution 0.35*600 210.00 0.71
Fly ash 1*390 390.00 1.32
Table 3:4 Summary of material considering 20 % wastage for GPC
Material Name Mass for single specimen(Kg) Total mass (Kg)
Coarse aggregate 4.37 78.73
44
a) OPC concrete mix design
Mass Calculation for 1m3 is given as follows: density=2400Kg/m3=2.4gr/cm3
MOPC = mass for 1m3
M1= mass for 150x150x150mm cube
V1= 3.375*10-3 m3 (Volume for 150x150x150mm mold) Table 3:5 General Calculation for OPC mix design
Materials Name Calculation MOPC (Kg/m3) M1(Kg)
Aggregate 0.68*2400 1632.00 5.51
Coarse 0.62*1800 1011.84 3.41
Fine 0.38*1800 620.16 2.09
Binder 0.32*600 768.00 2.59
Cement 0.69*768 533.33 1.80
Water 0.31*768 236.90 0.80
0.4% PVA 1.3*10-3*4016 5.22 0.02
Table 3:6 Summary of material considering 20 % wastage for OPC concrete
Material Name Mass for single specimen(Kg) Total mass (Kg)
Coarse aggregate 4.10 73.76
Fine aggregate 2.51 45.21
Cement 2.16 38.88
Water 0.96 17.27
45
3.5 Pullout Test
An experimental series of pull-out tests were performed to investigate the bond behavior resistance in geopolymer and OPC concrete. Pull out tests are used commonly for assessment of bond performance between steel reinforcing bars and concrete. In this sub title experimental set ups, and testing procedure were presented
3.5.1 Test program
a) Machine for testing
Universal Testing machine model I/H-500KNI shown in Fig. 3:4 was used in this research for pullout test. On the top of the bearing surface where test specimen supported, square steel plate of 200x200mm and 20mm thick will be used. This steel plate will has central hole of radius 20mm to accommodate the reinforcing bar.
Figure 3:4 Universal testing machine model -I/H-500KNI
b) Test Specimen
46
rebar for applying the pull out load. To achieve the required bond at the center of the specimen, PVC pipe were used. The PVC pipe was embedded as neither restrains the slip of the bar nor affects the transfer of bar forces to concrete. Figure. 3:5 shows the arrangement for rebar’s and PVC pipe in concrete cube.
Figure 3:5 Concrete cube test specimen
In this research 21 specimens in a set were used (i.e.15 geopolymer and 6 OPC concrete) Specimen designation is given related with two Study parameters as discussed below.
3.5.2 Mould preparation, casting and curing procedure
The Mould used to cast both geopolymer concrete and OPC concrete specimen was prepared from steel cube. The test bars is positioned horizontally in the moulds, lying in the middle of the specimens as shown in Fig. 3:6(a).Concrete were placed in two layers and each layer will be vibrated by means of vibrator, with special consideration in order not to disturb the position of the bar. Compacting and leveling was imposed on the specimen surface to eliminate voids and minimize geometric irregularities.
47
Before casting, the inside part of the Mould was coated with a thin film of oil to make easier the demolding of concrete cube. After casting, the both geopolymer and OPC concrete specimens were kept in the mold for two days. After that all geopolymer concrete specimens were cured in humid environment for 28 days.
a) 3D drawing for Mould
b) Face-A
Re-bar PVC
*B
*B *A
*A
48 c) Face-B
d) Face-C
Figure 3:6 Mould preparation and bar arrangement
3.5.3 Experimental set up for pullout test
The test setup for testing pullout specimens under controlled displacements was conducted according IS: 2770. A steel plate of size 200 x 200 x 13mm with a central opening of diameter 20mm were placed at loaded surface to make smoother surface for test specimen and to allow free failure of concrete due to pullout load.
Welded connector to connect face-C
49
During testing, at unloaded end of the re-bar, one LVDT was placed to monitor the end displacement. Loading have been recorded by using mounted desktop computer from testing machine, which record load and slip at the same time, and strain gauge has connected to the data logger which continuously record the strain readings from center of bond length. The load was applied to the reinforcing bar at a rate not greater than 1.25mm/min. Necessary data’s according the code IS: 2770 will be recorded. Experimental setup is given in Fig. 3:7.
50
b) Actual setup for pull out test Figure 3:7 Experimental pull-out test setup
3.6 Finite Element Analysis
Geopolymer concrete pullout specimen without PVA fiber was used for Finite Element analysis (FEA). The FEA model is created as three dimensional solid element. This analysis was conducted to verify the experimental results for pullout test. In addition, FEA analysis has been mainly used to investigate how stresses distribute within the concrete matrix. Furthermore, this analysis conducted to observe the position
LVDT
Desktop computer
Strain gauge Rebar
Data logger Steel plate
51
of stress concentration, which is the area where maximum stress, in pullout concrete specimen.
For both geopolymer concrete and pullout bar, material properties from actual laboratory test results was used. The overall FAE analysis procedures that has been tracked during pullout test simulation in this study are outlined in Fig.3:8. The detail discussion under each analysis steps are also presented in respective sections.
Create Pullout CAD model
Set loading and boundary conditions
52
53
CHAPTER-4.
RESULTS AND DISCUSSIONS
4.1 Introduction
This Chapter has four sections. In the first section, Experimental test results for the materials discussed in chapter three were summarized. All tests have been conducted in concrete laboratory of civil engineering department except XRD test for fly ash and engineering properties of PVA fiber. Detail discussions for each experimental results were presented under each sub sections.
In the second section, the experimental test results for geopolymer concrete were discussed. In this section, concrete test results such as compressive test, direct tensile and modulus of elasticity results for geopolymer concrete were presented. In addition, compressive test results for the control specimen, i.e. OPC concrete specimen without fiber, was also discussed.
Thirdly, pullout test results for both geopolymer and OPC specimens were presented. As stated in previous chapter, pullout tests were conducted for all PVA fiber variations in geopolymer concrete. In the similar way, pullout test for OPC concrete specimen was analyzed as a control. Furthermore, pullout test for OPC concrete specimen with 0.4% PVA fiber content was conducted to investigate the effect of PVA fiber on bond strength. Finally at the end of this section, comparative study for bond strength between geopolymer and OPC concrete, and bond strength estimation expression was discussed.
54
4.2 Material Test Results and Discussion
4.2.1 Aggregates
It is obligatory to conduct test to determine the engineering properties of aggregate before any concrete mix design preparation. Since the aggregate properties highly affect the performance of concrete, that directly influence the real application of concrete. As presented in the previous chapter, aggregate tests such as sieve analysis, specific gravity, and bulk density were presented. Each tests are conducted according to ASTM test standards. Following the results, short discussions are also presented on the results obtained under each experimental tests.
4.2.1.1 Sieve analysis
Gradation analysis is conducted according toASTM-C136. Results from fine and coarse aggregates are calculated by using sieve sizes commonly used for concrete aggregates. Table 4.1 shows results obtained from this experimental work. The values for percentage retained and percent passing in Table 4.1 are calculated using the expression given in section 3.3.2, chapter three. The results were also checked for acceptance purposes. According to ACI-Education-Bulletin-E1-07, 2007, the cumulative mass of the test sample after sieving should be checked closely with the original mass of sample used in sieve analysis. If there is more than 0.3% deviation, the results will not be accepted. Thus for coarse aggregates the value obtained was 0.1%:
i.e. 2000−1998
1998 ∗ 100% = 0.1%
Where, 2000.00 gm is mass of sample and 1998.00 gram is cumulative retained at sieve 2.36mm as shown in Table 4:1 (a) .