ISSN: 2088-8708 171
Linguistic Application Using Transitivity-Appraisal Analysis
Alexander Setiawan*, Djoni Haryadi Setiabudi, Yanuar Simon
Informatic Engineering Department, Petra Christian University Surabaya, IndonesiaSiwalankerto 121-131 Surabaya, Telp. (031)-2983455, Fax. (031)-8417658
email : [email protected]*, [email protected], [email protected]
Abstract
In conducting research and linguistic analysis, researchers often find a variety of obstacles because of their limitations as human beings. A large number of articles data that must be processed and calculated increase the risk of error in the analysis, either in error in classification or error in the calculation. That’s why an application is made to assist researchers in conducting their research. This research was provided a specific framework to support the needs analysis process. This program is specifically designed to support the entire process of analysis required by using the method of analysis transivity analysis and assessment, which include searching and data processing articles, clauses classification process, and analytical assessment of this clause. The results of this study are to perform data storage process of said search results of an article, save the data analysis process from an article, the classification of phrase in the sentence in the article, and can minimize risk of calculation errors that occur in analysis. Test carried out using aplha reliability coeficient 0,75 (75%).
Keywords: Analyze, Linguistic, Application.
1. Introduction
Systemic Functional Linguistics views language as a resource for making meanings, or as Eggins [1] puts it “a strategic, meaning-making resource” . In the systemic functional view, all languages are organized around two main kinds of meaning, the ‘ideational’ meaning and the ‘interpersonal’ meaning. These meanings are called ‘metafunctions’ in the systemic functional theory, and are the manifestations of two general purposes which underlie all uses of language: to understand the environment (ideational), and to act on the others in it (interpersonal) [1]. There is a third metafunction which is a resource for presenting interpersonal and ideational meanings as information organized into text in context; this is called ‘textual’ metafunction.
As we have shown elsewhere, the ideology of a text is construed not by one linguistic feature alone but by what we might term its density - in otherwords, it is the layering and interaction of the linguistic resources mobilised that combine to create higher order meaning. Interpretation of ideology requires the analyst to look for elements of redundancy and overdetermination in the text. Thus our analysis of the transitivity resources mobilised in the two editorials suggests an interpretation of their ideological positioning but this must be extended and checked by considering the relation of transitivity resources to other features of the text. We turn therefore to consider the contribution of the appraisal resources in the construction of the contrasting viewpoints of the two editorials [2].
Appraisal resources (identifying instances of affect, judgement, and appreciation) are clearly of the utmost significance in analysing ideology. They may involve explicit evaluation : ie attitudinal inscription, which supposes largely fixed and stable terms of evaluation ; or implicit evaluation, attitudinal tokens, formulations where no single item in and of itself assigns value-their function is dependent on their context [8].
A further aspect of appraisal that may be relevant to the study of ideology is that of engagement - the resources of intersubjective stance, resources which vary the terms of the speaker’s engagement with propositions and proposals (eg disclaim ; concur ; entertain, etc.) and which vary what is at stake interpersonally both in individual utterances and as the text unfolds cumulatively [8]. This may be relevant to the study of ideology not only through the mobilisation of engagement resources to persuade the reader of the correctness of the ideas expressed, but through the evocation of a community of like-minded people, thus encouraging the readers, through identification with the speaker, to define themselves as belonging to a community with shared norms, beliefs, values. We have therefore added to the categories of engagement proposed by White that of ‘identification’, to refer to those cases where the speaker identifies the community to which he belongs, and/or assumes the reader to belong
.
2. Research Method 2.1. Transitivity Analysis
Transitivity is usually understood as a sentence structure where a verb is directly connected to object [3]. There are 3 factors that determine the clause is a transitive clause or not. These three factors are referred to as transitivity processes, including:
• The subject or object that is connected with that(above) process, referred to as participants, manifested in the form of a nominal subject or object.
• States or condition associated with the process, called the circumtances, embodied in the form of a statement phrase or prepositional phrase.
Transitivity analysis aims to separate clauses in a sentence to the transitivity factors. To reach this stage, there are several steps that must be done. The steps in this analysis of transitivity program are [4]:
1) Processing the data of the original article so that it become data that is ready to be uses. Examples of the original article as in Figure 1.
Data processing includes :
• Eliminate words that is repeated in every article, such as: BYLINE, SECTION, LENGTH • Separating per line of each sentences.
2) Each line must separated per sentences according to its order, namely:
Adjunct//Circumstances//Participants//Process//Participants//Circumstances//Process Type//Participant Type. The output of the analysis process can be seen in Figure 2.
3)
Figure 1. Example of original article
2.2. Appraisal Analysis
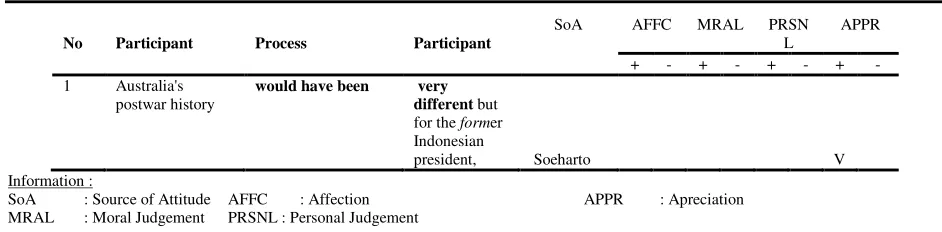
Appraisal analysis is a method used in the study of languages to recognize, learn, and understand how a person gives respon to something [8]. Source from the responses given, in this Appraisal Analysis method is called Source of Attitude. The response contained in the language are divided into 3 types, namely: Affection, Judgement, dan Appreciation [5]. Affection is the kind of responses based on feelings or emotions that is obtained from the response giver to the Source of Attitudes. Judgement is the kind of response based on the assessment given by the response giver to the Source of Attitudes. Appreciation is the kind of response based on how the response giver respond to the Source of Attitudes. This method of analysis using a worksheet in the form of tables, called the framework [7]. Appraisal framework for example in the first clause above can be seen in Table 1.
Table 1. Example of Appraisal Analysis Process
No Participant Process Participant
SoA AFFC MRAL PRSN L
APPR
+ - + - + - + -
1 Australia's postwar history
would have been very different but for the former Indonesian
president, Soeharto V Information :
SoA : Source of Attitude AFFC : Affection APPR : Apreciation MRAL : Moral Judgement PRSNL : Personal Judgement
There are a positive - negative types of assessments that can be filled in each category, and there are sub-categories in it. Forms of sub-categories - sub-categories contained in the assessment process as in Table 2.
Table 2. Assessment criteria table in the appraisal analysis
2.3. Tabulation Transitivity – Appraisal Analysis
Table 3. Example of Transitivity – Appraisal Analysis tabulation
3. Results and Analysis
Steps of research and procedure about whar the researchers do are as follow:
1. Gathering of data in the form of articles from newspaper published by Australia, such as newspaper "Sydney Morning Herald" and newspaper "The Age". Those articles are gathered from Lexis Nexis database.
2. Edit those articles, removing unused repetitive words. This step is first done by researcher with the help of a program called wordpad.
3. Making index of every news per newspaper every year. This step is carried out by researchers with the help of Microsoft Excel.
4. Printing the required newspaper news.
5. Grouping news by which month the news are published.
6. Select articles which became the research data. Articles are selected according to topics desired by the researcher. In this case, the criteria used by researchers is problems that discusses the relationship between Indonesia and Australia both regionally and internationally.
7. Doing the editing process to selected articles, this time to facilitate the research process, by way of dividing each sentence in the article into clauses per line of sentence. This step is carried out by researchers with the help of program called wordpad. Articles selected according to topics desired by the researcher. In this case, the criteria used by researchers is problems that discusses the relationship between Indonesia and Australia both regionally and internationally.
8. Create a worksheet for research in Microsoft Excel by Raw, Transitivity, Appraisal. 9. Analyzing clauses in the selected article by using Transitivity dan Appraisal method.
10. Doing tabulation towards transitivity analysis, which are towards Process, Participant, dan Circumstances. 11. Conducting tabulation towards Appraisal analysis, which are Affection, Judgement ( Moral-base dan
Personal-base ), dan Appreciation. Criteria of tabulation can be “Positive” maupun “Negative”.
12. Making comparison between newspapers, for example between the newspaper “Sydney Morning Herald” and surat kabar “The Age”, based on Transitivity and Appraisal tabulation that has been carried out.
13. Draw conclusions based on comparison between those newspapers.
The design for the system will be divided into 3 (three) parts, the overall system design, search process design and tabulation process design. Overall system design describe the design throughout the system, as in Figure 3. Design of the search process describes the steps taken by the system in searching and finding the desired data. The schematic of search process design can be seen in Figure 4.
NEWS
SOURCE TITLE
AFFECT JUDGEMENT APPRECIATION Apprai
Figure 3. Overall system design scheme
S t a r t
E n d K e y w o r d s a n d A r t i c l e s
K e y w o r d s f o u n d ? A l l A r t i c l e s ’ S e a r c h e d ?
K e y w o r d s m a t c h i n g
A r t i c l e R e f e r e n c e
n o
y e s
n o
S e a r c h R e s u l t y e s
Figure 4. schematic of search process design
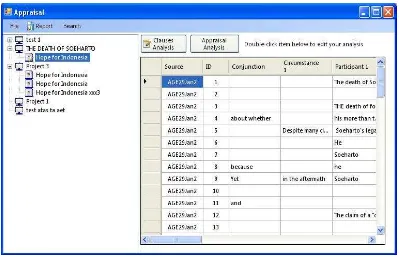
The main form in this application is designed for direct use in the analysis. Almost all the analysis process in the application can be accessed through the main form. Users can start or continue their analysis process in this main form. Main form display can be viewed as in Figure 5.
Figure 5. Main Form Display
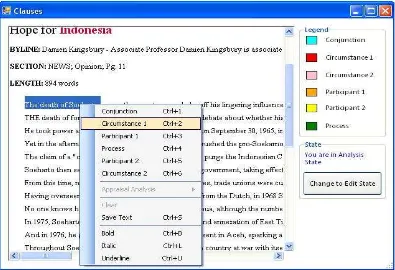
Figure 6. Clause Classification Form Display
There are two model state that can be used in this form, the Edit State and Analysis State. Article data can be processed in the Edit State, while the clause categorization process can be performed in the Analysis State, that is done by doing block and right click on the words wanted, as in Figure 7. below. Words that have been classified in the article will be marked with different color classification results will be automatically saved. Examples of articles that have been classified are as in Figure 8.
Figure 8. Classification results display
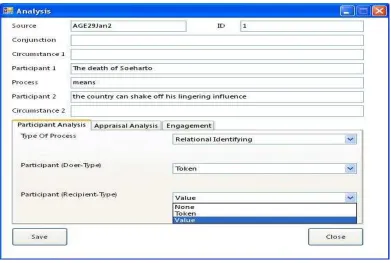
This analysis form display is the place where the entire process of analysis performed by the application user. All three process of analysis is placed in this single application form. The analysis process carried out in this application include Participant Analysis, Appraisal Analysis, and Engagement. This form will be displayed when the "Appraisal Analysis" button is pressed, or when the user double click on the data in the datagrid. Analysis form display can be viewed as in Figure 9.
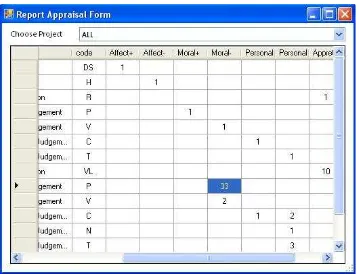
This analysis results form will show whether the overall results of the analysis or the analysis of each project. Analysis results form display can be viewed as in Figure 10.
Figure 10. Analysis Results Form Display
Doing double click on the value numbers on the datagrid will open a detailed form of the analysis results of the numerical data in question. Analysis details form display can be seen in Figure 11. and Figure 12.
Figure 12. Analysis Details Form Display
Validity test is related to the precision measuring instrument to do its work to reach target. Validity test is divided into two groups namely the content validity and construct validity. The validity of measuring the extent to which the content items in the instrument that measured characteristics represent the attributes to be measured. To ensure content validity, researchers conducted a review of research questionnaires to a friend as well as research respondents during the preliminary tests carried out. Construct validity indicates how well the results obtained from the use of a measure in accordance with the theories used to define a construct [9]. Construct validity was assessed through convergent validity and discriminant validity. Convergent validity is judged by the correlation between score items/indicators with it’s construct score. individual indicators considered valid if the correlation value above 0.75. Following table 4 convergent validity test results from the data obtained.
Table 4. Validity Test of Clause Classification Process
As measured by using a construction validity convergent validity test has also been measured discriminant validity. Discriminant validity can be measured by comparing the crossloading between indicator with it’s construct [9]. The following Table 5 and the correlation between the construction of indicators.
Table 5. Validity Discriminant Test
Conjuction Circumstance 1 Circumstance 2 Participant 1 Participant 2 Process
Conjuction 0.913249 0.231279 0.428821 0.492591 0.875201 0.744029
Circumstance 1 0.442791 0.872565 0.214409 0.412159 0.399257 0.512430
Circumstance 2 0.427301 0.296776 0.789678 0.623779 0.592070 0.262163
Participant 1 0.389731 0.217183 0.531221 0.879278 0.775014 0.266201
Participant 2 0.400251 0.442007 0.400525 0.489107 0.564368 0.665019
Process 0.251470 0.305424 0.270269 0.201794 0.701021 0.882758
Source : Data Processed
Reliability is the level of how much a gauge to measure the stable and consistent [9]. Research instrument is said to have high reliability value if the results of the implementation of various measures on the same subject obtained relatively similar results, for aspects that are measured in the subject have not changed.
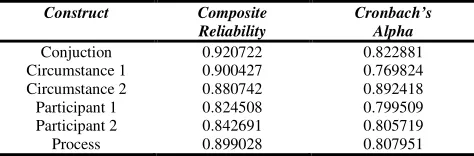
Reliability of measurement can be done by looking at the value of composite reliability and cronbach's alpha [9]. A construct is considered reliable if it’s reliability composite score above 0.75 and values cronbach's alpha above 0.75, but the scale of development research is acceptable loading 0.5-0.6 [9]. The following Table 6 Cronbach's alpha values and the composite reliability of each building.
Table 6. Reliability Test Circumstance 1 0.900427 0.769824 Circumstance 2 0.880742 0.892418 Participant 1 0.824508 0.799509 Participant 2 0.842691 0.805719
Process 0.899028 0.807951
Source : Data Processed
There are two types of tests in this research is to use a test average of different tests and test research models. Average difference test in this research using SPSS 12 (Statistical Program for Social Science). While to test the relationships between research variables used PLS 2.0 (Partial Least Square). In this research used PLS analysis methods because the research model used in this research complex. PLS analysis methods are also deemed to have included multiple regression analysis, path analysis, and canonical correlation. In this research, testing the average difference is used to examine differences in faculty and student perceptions of the factors that influence one's intention to share knowledge at Table 7.
Table 7. Independent Sample Test for Clause Classification Process Variable t-test significance conclusions can be drawn through the test, namely the application program has been able to provide adequate work space and include all factors needed by researchers in conducting their research, including searching and data processing of articles, classification of clauses, and the assessment and calculation analysis. Use of this application program drastically reduce the error rate due to human error in the research process, particularly in the calculation of evaluation analysis. Use of this application program accelerate the entire research process.
References
[2] Eggins, S. (2004). An introduction to systemic functional linguistics. London and New York: Continuum. [3] Halliday, M. A. K. (2007). Introduction to functional grammar. Arnold. London – England.
[4] Hunston, S., & Thomson, G. (2000). Evaluation in Text: Authorial stance and the construction of discourse. Oxford: OUP. [5] Martin, J. R. (2000). Beyond negotiation: Appraisal in English. Oxford: OUP.
[6] Martin, J., & Rose, D. (2003). Working with discourse: Meaning beyond the clause. London: Continuum.
[7] Martin, J., & Rose, D. (2007). Working with discourse: Meaning beyond the clause (2nd edition). London: Continuum. [8] Martin, J., & White, P.R.R. (2005). The language of evaluation: Appraisal in English. Basingstoke: Palgrave Macmillan. [9] Supranto, J. (2009). Statistical Theory and Application 7th Edition. Jakarta : Erlangga Publisher.
[10] Te’eni, D. (2007). Human Computer Interaction : Developing effective organizational information systems. USA : Wiley Publishing, Inc.
Bibliography of authors
Alexander Setiawan obtained his B.Com. degree in informatics engineering from Petra Christian University, Surabaya, Indonesia in 2003. He received his master, in Information Technology from Gadjah Mada University, Yogyakarta, Indonesia, in 2008. Now, he is a lecturer in the Department of Informatics Engineering at Petra Christian University, Surabaya, Indonesia. His primary research interest are in software engineering, business intelligent, management information system, and human computer interaction.
Djoni Haryadi Setiabudi is an Associate Professor at Petra Christian University, Surabaya, Indonesia. He graduated from Asian Institute of Technology, Bangkok, Thailand in Computer Science. He become a member of IACSIT. His interest is in Computer Graphics, Computer Architecture and Information Systems.