Business Process Management Journal
Business process redesign proj ect success: t he role of socio-t echnical t heory Junlian Xiang Norm Archer Brian Detlor
Article information:
To cite this document:Junlian Xiang Norm Archer Brian Detlor , (2014)," Business process redesign project success: the role of socio-technical theory ", Business Process Management Journal, Vol. 20 Iss 5 pp. 773 - 792
Permanent link t o t his document :
http://dx.doi.org/10.1108/BPMJ-10-2012-0112
Downloaded on: 19 March 2017, At : 20: 27 (PT)
Ref erences: t his document cont ains ref erences t o 55 ot her document s. To copy t his document : permissions@emeraldinsight . com
The f ullt ext of t his document has been downloaded 1080 t imes since 2014*
Users who downloaded this article also downloaded:
(2014),"A process model of managing organizational change during business process redesign", Business Process Management Journal, Vol. 20 Iss 6 pp. 971-998 http://dx.doi.org/10.1108/BPMJ-02-2013-0020 (2014),"Ten principles of good business process management", Business Process Management Journal, Vol. 20 Iss 4 pp. 530-548 http://dx.doi.org/10.1108/BPMJ-06-2013-0074
Access t o t his document was grant ed t hrough an Emerald subscript ion provided by emerald-srm: 602779 [ ]
For Authors
If you would like t o writ e f or t his, or any ot her Emerald publicat ion, t hen please use our Emerald f or Aut hors service inf ormat ion about how t o choose which publicat ion t o writ e f or and submission guidelines are available f or all. Please visit www. emeraldinsight . com/ aut hors f or more inf ormat ion.
About Emerald www.emeraldinsight.com
Emerald is a global publisher linking research and pract ice t o t he benef it of societ y. The company manages a port f olio of more t han 290 j ournals and over 2, 350 books and book series volumes, as well as providing an ext ensive range of online product s and addit ional cust omer resources and services.
Emerald is both COUNTER 4 and TRANSFER compliant. The organization is a partner of the Committee on Publication Ethics (COPE) and also works with Portico and the LOCKSS initiative for digital archive preservation.
*Relat ed cont ent and download inf ormat ion correct at t ime of download.
Business process redesign
project success: the role of
socio-technical theory
Junlian Xiang
Ted Rogers School of Management, Ryerson University, Toronto, Canada, and
Norm Archer and Brian Detlor
DeGroote School of Business, McMaster University, Hamilton, Canada
Abstract
Purpose– The purpose of this paper is to seek to advance business process redesign (BPR) project research through the generation and testing of a new research model that utilizes formative constructs to model complex BPR project implementation issues. Instead of looking at management principles, the paper examines the activities of improving business processes from the project perspective. Design/methodology/approach– A survey of 145 managers and executives from medium and large-sized USA and Canadian companies was used to validate the model.
Findings– The model, based on socio-technical theory, includes three implementation components (change management, process redesign, and information and communication technology infrastructure improvement), and links the effects of these components to BPR project outcomes. The empirical findings indicated that all three implementation components had a significant impact on BPR project success, with change management having the greatest effect. Interestingly, the results also showed that productivity improvement was no longer the main focus of companies carrying out BPR projects; instead, improvement in operational and organizational quality was more important. Research limitations/implications– The main limitation of this study is its generalizability with respect to company size and organizational culture. The sample in this study was drawn from medium- and large-sized companies in Canada and the USA, but small-sized organizations were excluded from this study due to their distinct features (e.g. superior flexibility or ability to reorient themselves quickly). Also, this study controlled the variable of organizational culture by limiting respondents to Canada and US companies. It would be very interesting to investigate BPR project implementations in other countries where the organizational working culture may be different. Practical implications– Based on the findings of this study, BPR practitioners can refer to the three BPR project implementation components and then prioritize and sequence the tasks in a BPR project to achieve their preset BPR goals.
Originality/value – This is the first study which utilizes formative constructs to validate the important BPR project components.
Keywords Change management, Business process management, Business process redesign, Information and communication technology infrastructure, Socio-technical theory
Paper type Research paper
1. Introduction
Business processes have drawn a great deal of attention from industrial practitioners and academic researchers since the 1990s because of their great potential for improving the efficiency and effectiveness of organizations. The roots of business process focussed research can be traced back to business process reengineering, promoted by Hammer and Davenport et al. (Hammer and Champy, 1993; Davenport, 1993), that described it
The current issue and full text archive of this journal is available at
www.emeraldinsight.com/1463-7154.htm
Received 26 October 2012 Revised 22 January 2013 5 April 2013 28 July 2013 19 September 2013 Accepted 21 September 2013
Business Process Management Journal Vol. 20 No. 5, 2014 pp. 773-792
rEmerald Group Publishing Limited 1463-7154 DOI 10.1108/BPMJ-10-2012-0112 This research was supported by a grant from the Social Sciences and Humanities Research
Council of Canada.
773
Business process
redesign project
success
as a radical redesign of business processes resulting in a singular transformation. However, researchers soon realized that better results were obtained when organizations started with a revolutionary design phase, followed by actually implementing changes in an evolutionary manner ( Jarvenpaa and Stoddard, 1998). Later on, a more general term business process management (BPM) was widely adopted by many researchers in the business process focussed research context. BPM is defined as an integrated management philosophy and set of practices that includes incremental change and radical change in business processes, and emphasizes continuous improvement, customer satisfaction, and employee involvement (Hung, 2006; Houyet al., 2010). BPM covers concepts such as total quality management, business process reengineering, business process redesign (BPR), business process improvement, etc.
Usually BPM emphasizes different phases along its life cycle. A complete review of various BPM life cycles has been provided by Houyet al.(2010). The current study examines a specific group of business process focussed projects, i.e. BPR. Instead of looking at management principles, we examine the activities involved in improving business processes from the project implementation perspective. Therefore, the term BPR is used in this study. It is defined as a deliberate (planned) change, typically enabled by information technologies (IT) in an attempt to redesign and implement business processes to achieve performance breakthroughs in quality, speed, customer service, cost, etc. (Grover and Jeong, 1995).
Although extensive research has been carried out in the BPR area, a recent article has shown a continuing increase in interest in this field (Houyet al., 2010). One of the reasons for this interest is probably that the failure rate of BPR projects still remains high (Zˇabjek and Sˇtemberger, 2009). Furthermore, the increased interest in this field implies that there are limitations in existing research results. For example, studies that do exist tend to be case study reports, making it difficult to generalize findings that yield consistent results (Bradley, 2008). Many previous studies have carefully examined the readiness of an organization to embark on a BPR project (Fenelon, 2002; Abdolvand et al., 2008; Aghdasi et al., 2010). Some have surveyed the best practices of BPR project implementation (Mansar and Reijers, 2007). A few others have started to measure outcomes related to BPR and IT portfolios (Ramirezet al., 2010; Ozcelik, 2010). However, as indicated by a recent literature review, “[y]
most approaches concentrate on what needs to be done before and after the improvement act, but the act of improving itself still seems to be a black box” (Zellner, 2011, p. 1). Our observations are similar to the results of Zellner’s study; i.e. few studies have focussed on measuring and modeling what organizations should do during project implementation. Therefore, there is a need for more rigorous research in this area, specifically with regard to BPR project implementation, to determine and better understand how BPR project success rates can be improved. Lastly, few published studies have been able to address the complexities of the BPR problem in one research model. One reason is that it is almost impossible to use traditional reflective constructs to model such a complex problem. The appropriate technique to use in these situations is the application of formative constructs, but this has been neglected in the past ( Jarviset al., 2003; Diamantopoulos et al., 2008; Petter et al., 2007).
The goal of this investigation is to model important BPR project implementation components, as well as to test the impact of these components on BPR project success. Various facets of BPR project outcomes were used in order to examine how BPR project implementation components would bring performance improvements.
774
BPMJ
20,5
To achieve this goal, the researchers began with a review of the BPR literature on project success factors, and then identified one important BPR enabler and three implementation components, using socio-technical theory (STT) as a guide. These formed the basis of the study’s research model. The paper continues with the development of the theoretical model and hypotheses. After carefully examining the causal relationships between the BPR project implementation components and their measures, formative constructs were judged to be the appropriate way to model those components. The research method involved validating the model, through a survey administered to 145 managers and executives from medium and large US and Canadian companies; responses are analyzed using structural equation modeling techniques, involving partial least squares (PLS). Next, the research results are presented and analyzed. Lastly, the implications of the research are discussed.
2. Theoretical model and hypotheses
2.1 STT and BPR project implementation components
From the early 1990s to the mid 2000s, few theories were used to inform or guide BPR project research. Rather, most of the literature reported during this period merely listed BPR project success factors identified through case study research (Groveret al., 1998). However, since the mid 2000s, BPR researchers have started to borrow theories from other areas of research and apply these to the BPR context (Newellet al., 2000; Sarker and Lee, 2002; Sarkeret al., 2006). As a result, initial frameworks (Grover and Jeong, 1995), models (Ifinedo and Nahar, 2009; Law and Ngai, 2007), and constructs (Guha and Grover, 1997) have been developed. Of these, STT appears to be promising.
STT views the organization as a work system with two interrelated subsystems: the technical system and the social system (Bostrom and Heinen, 1977). The technical system is concerned with the processes, tasks, and technology needed to transform inputs such as raw materials to outputs such as products; the social system is concerned with the relationships among people and their attitudes, skills, and values. The outputs of a work system are a result of the joint interaction between these two subsystems.
A critical important enabler for BPR project success, regarding the social aspect of STT, is top management support (TMS). Top management plays an important role in BPR projects as suggested by STT (Markus, 1983). “This type (supportive) of leadership offers a vision of what could be and gives a sense of purpose and meaning to those who would share that vision. It builds commitment, enthusiasm, and excitement. It creates a hope in the future and a belief that the world is knowable, understandable, and manageable. The collective energy that transforming leadership generates, empowers those who participate in the process [y]” (Roberts, 1984, as cited in
Lashway, 2006, p. 91). As claimed in project management research, “top management support is the most important critical success factor for project success and is not simply one of many factors” (Young and Jordan, 2008, p. 1). Numerous surveys and case studies have shown that TMS is one of the most highly ranked success factors in BPR project practice (Fui-Hoon Nahet al., 2003; Grover and Jeong, 1995; Herzoget al., 2009). Grover and Jeong (1995) identified the lack of TMS as a serious problem impeding the success of business process reengineering implementations. Strong support from top management is also necessary to resolve any conflicts of interest among the various parties involved (Ahadi, 2004). Therefore, this study hypothesizes that TMS would positively impact BPR project success. However, this study takes a further step to explore what are the important components in the BPR project
775
Business process
redesign project
success
implementation and to evaluate how TMS affects BPR project success through the project implementation components. This brings us to our first hypothesis:
H1. Stronger TMS will result in a better BPR project implementation procedure.
When exploring BPR project implementation components, this study considers both the technical and the social dimensions, and their interactions. As Grover and Jeong (1995) point out, STT emphasizes the impact of the changes to technical and human resources on altered tasks or processes. As such, technical resources, human resources, and altered tasks/processes are reflected in this study as three implementation components: information and communication technology infrastructure (ICTI) improvement, change management, and process redesign.
ICTI is the technology foundation dealing with the IT capabilities on which processes and humans rely, such as networks, databases, data inter-exchange, etc. for transforming inputs to outputs (Law and Ngai, 2007). The capabilities of ICTI consist of a wide spectrum of components, including ICTI platforms, standards, policies, and different types of service arrangements.
Change management includes the methods through which attitudes, skills, and values of the people in the system are managed and transformed (Huq et al., 2006). Change management is the soft part of the change process since it addresses human resource problems within organizations, such as employee resistance and structural adjustments. It requires effectively balancing forces in favor of change over forces of resistance from organizations, groups, and individuals (Guha and Grover, 1997; Markus, 1983).
Process redesign can be thought of as the interaction of the social and technical aspects of STT. For example, people (such as employees, customers, etc.) work to get expected outputs by following company procedures that implement specific business processes, supported mainly by IT.
When applying STT to BPR project implementations, it is important to understand that, whether companies have fixed process goals (e.g. BPR projects that follow external rules enforced for ERP systems implementations) or they design processes that fit their own requirements, new processes cannot work well unless people issues are resolved and IT support is suitable. In this way, the effects of ICTI improvement and change management are reflected through the redesigned processes. Business processes can never work without both operators (people) and carriers (technical implementation) (Davenport, 1993).
Given the above discussion, our first hypothesis can be decomposed into three sub-hypotheses. That is, TMS is hypothesized to positively affect the three implementation components. Hence:
H1 (a, b, c). Stronger TMS will result in better levels of change management, BPR, and ICTI improvement, respectively.
2.2 BPR Project outcomes and success
BPR project success is defined as the advantageous outcomes that a BPR project achieves for an organization. It is improper to use a single financial criterion (e.g. cost reduction itself) to evaluate BPR project outcomes. Grover used two different perspectives: perceived level of success and goal fulfillment, to evaluate BPR success (Grover and Jeong, 1995). The perceived level of success seeks to assess the degree of
776
BPMJ
20,5
attainment in relation to the targets, and the goal fulfillment perspective determines success by attainment of a normative state (Hamilton and Chervany, 1981).
The second perspective, goal fulfillment, is based on the commonly emphasized goals of BPR projects. Four categories of outcomes were adopted in our study (Raymondet al., 1998): first, operational quality improvement, or improved quality in goods and services (e.g. customer service and satisfaction); second, organizational quality improvement, or improved quality of organizational coordination and communication (e.g. lessened managerial hierarchy, improved task enrichment, and reduced bureaucracy); third, cost savings, involving administrative and production cost savings (in terms of return on investment, personnel costs, operational costs, and profits); and fourth, productivity improvements that result from increased productivity of workers and managers (more units produced, fewer delays).
In order to examine the effect of the three implementation components, their impact was tested on each of the four categories of outcomes, hypothesized as follows:
H2 (a, b, c, d). A higher level of change management will result in a higher level of operational quality improvement, organizational quality improvement, cost savings, and productivity, respectively.
H3 (a, b, c, d). A higher level of BPR will result in a higher level of operational quality improvement, organizational quality improvement, cost savings, and productivity, respectively.
H4 (a, b, c, d). A higher level of ICTI improvement will result in a higher level of operational quality, organizational quality, cost savings, and productivity, respectively.
The researchers were also interested in how these categories of outcomes would contribute to the perceived level of project success. Different BPR projects may target different fulfillment goals. It is important to understand what company goals are focussed on through BPR projects because different goals may trigger different emphases in their BPR project implementation components. Thus:
H5 (a, b, c, d). A higher level of operational quality improvement (organizational quality improvement, cost savings, or productivity, respectively) from a BPR project will result in a higher level of perceived BPR project success.
The research model built from this study is summarized in the path model in Figure 1. The model examines how TMS affects BPR project implementation components, which in this study includes change management, process redesign, and ICT infrastructure improvement; the model further examines how these BPR project implementation components would affect BPR project outcomes (operational quality improvement,
H2 H3
H4 H5
H1
BPR Project Outcomes - Operational quality improvement - Organizational quality improvement - Cost savings
- Productivity BPR Project Implementation
Components
- Change management - Process redesign - ICTI improvement Top
Management Support
BPR Project
Success Figure 1.
Research model
777
Business process
redesign project
success
organizational quality improvement, cost savings, and productivity) and ultimately BPR project success.
3. Research methods and data analysis
3.1 Construct operationalization
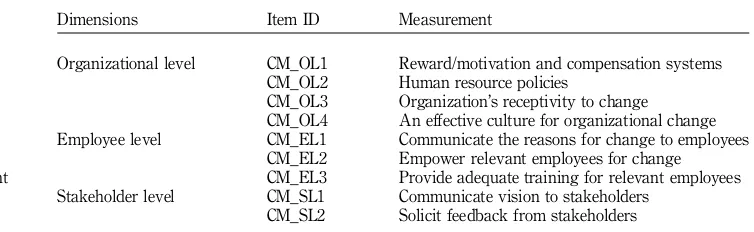
Three constructs for modeling BPR project implementation were created: change management, process redesign, and ICTI improvement. Each was modeled as a second-order construct and each of their first-order dimensions was operationalized as a latent variable. Researchers (e.g. Jarviset al., 2003; Diamantopouloset al., 2008; Petter et al., 2007) advocate examining constructs carefully before classifying them into reflective or formative categories. Jarviset al.(2003) and Petteret al. (2007) proposed criteria and decision rules on how to determine if a construct should be modeled as formative or reflective. All three of these constructs were identified as formative second-order and reflective first order constructs, based on their recommended approach. The construct of change management aims to assess the extent to which a BPR project utilizes change management practices. Three measures, as suggested in the literature, were developed to assess this construct: first, change management at the organizational level, to assess the impact of change management on organizational culture change and human resources system change (Al-Mashari and Zairi, 1999); second, change management at the employee level, to assess the impact of change management such as empowerment, communication and training on employee resistance (Grover and Jeong, 1995; Al-Mashari and Zairi, 1999); and third, change management at the stakeholder level, to assess the impact of change management on stakeholder resistance and commitment (Oakland and Tanner, 2007; Paper and Chang, 2005). The items for measuring the three dimensions were adapted from previous studies (Ramirez et al., 2010; Al-Mashari and Zairi, 1999; Grover and Jeong, 1995; Oakland and Tanner, 2007; Paper and Chang, 2005), and their dimensions were used as indicators to create the super-ordinate construct. The change management scale is shown in Table I.
The process redesign construct assesses the extent to which process redesign practices were used in a BPR project. This study adopted the two dimensions of process redesign (Attaran, 2003): technical redesign and social redesign. Technical redesign (PR_T) is used to redesign the allocation of the process workload; social redesign (PR_S) is used to redesign the allocation of personnel workloads. The items for measuring the two dimensions were adapted from Mansar and Reijers’ studies (Mansar and Reijers, 2005). The process redesign scale is shown in Table II.
Dimensions Item ID Measurement
Organizational level CM_OL1 Reward/motivation and compensation systems CM_OL2 Human resource policies
CM_OL3 Organization’s receptivity to change
CM_OL4 An effective culture for organizational change Employee level CM_EL1 Communicate the reasons for change to employees
CM_EL2 Empower relevant employees for change CM_EL3 Provide adequate training for relevant employees Stakeholder level CM_SL1 Communicate vision to stakeholders
CM_SL2 Solicit feedback from stakeholders Table I.
Change management construct and measurements
778
BPMJ
20,5
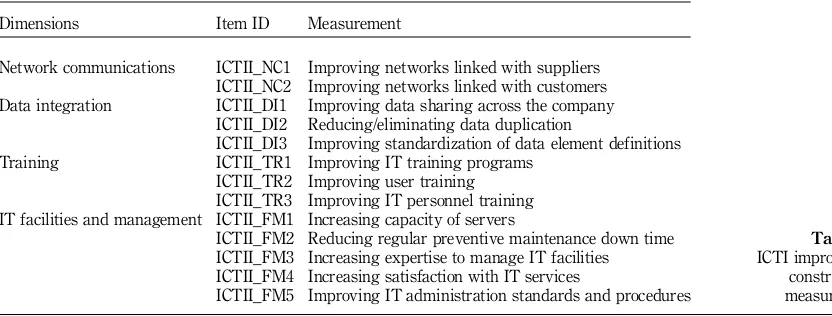
In this study, ICTI improvement assessed the extent to which a company’s ICTI capabilities have been improved through a BPR project. The four dimensions of ICTI improvement (network communications, data integration, training, and, facilities and management) and their corresponding items as proposed by Law and Ngai (2007) were adopted to create the super-ordinate construct. The ICTI improvement scale is shown in Table III.
TMS, a well developed construct in the IS literature, was operationalized as the extent to which top management provided support and commitment to a BPR project. Five items were chosen and minor modifications were made to fit the context of BPR projects (see Appendix 1), including top management’s understanding and support of the BPR project, as well as top management’s funding and communication support (Grover and Jeong, 1995).
BPR project success was measured from two perspectives. The first perspective was an overall perception of success (Grover and Jeong, 1995). A two-item scale was used to assess this perspective of success regarding to the achievements from a BPR project (see Appendix 1). The second was a goal-specific perception (Altinkemer, 2011; Raymond et al., 1998). The four facets of BPR project outcomes adopted from (Raymond et al., 1998) were used to measure goal-specific success in this study because it is relevant to this study. These included operational quality improvement (OpQI), organizational quality improvement (OrQI), cost savings (CS), and productivity (PROD).
Dimensions Item ID Measurement
Technical redesign PR_T1 Eliminating unnecessary tasks PR_T2 Combining or dividing tasks PR_T3 Re-sequencing tasks in processes PR_T4 Paralleling tasks
PR_T5 Integrating business processes
Social redesign PR_S1 Empowering workers with more decision-making authority PR_S2 Assigning workers to perform as many steps as possible for
single orders
PR_S3 Making human resources more specialized or more generalized PR_S4 Minimizing the number of departments, groups, and persons
Table II. Process redesign construct and measurements
Dimensions Item ID Measurement
Network communications ICTII_NC1 Improving networks linked with suppliers ICTII_NC2 Improving networks linked with customers Data integration ICTII_DI1 Improving data sharing across the company
ICTII_DI2 Reducing/eliminating data duplication
ICTII_DI3 Improving standardization of data element definitions Training ICTII_TR1 Improving IT training programs
ICTII_TR2 Improving user training ICTII_TR3 Improving IT personnel training IT facilities and management ICTII_FM1 Increasing capacity of servers
ICTII_FM2 Reducing regular preventive maintenance down time ICTII_FM3 Increasing expertise to manage IT facilities ICTII_FM4 Increasing satisfaction with IT services
ICTII_FM5 Improving IT administration standards and procedures
Table III. ICTI improvement construct and measurements
779
Business process
redesign project
success
The measurements for TMS and BPR project success, as well as for the three BPR project implementation components, are listed in the questionnaire that was used (see Appendix 1).
3.2 Content validity test before data collection
Before data collection, two steps were taken to ensure content validity. The first step was aQ-Sorting test on the three formative constructs. The goal ofQ-sorting was to verify the dimensions or categories of the items that were drawn from the literature. Hence, a one-roundQ-Sort was sufficient for this purpose. Five participants knowledgeable in the IS area, but with no prior knowledge of this study, were asked to examine a series of descriptive items that would be used for each of the constructs and to place each of them into one of several categories composed of the formative constructs. The measures and constructs theoretically identified by the researchers fully matched the results of theQ-sort, after clarifying a misunderstanding of the only unmatched category (social-based process redesign).
The second step used an expert panel. The instrument was examined by one academic researcher and two industrial experts for its content validity and was improved according to their opinions.
3.3 Data collection methods
The data collection process was approved by the Research Ethics Board of a major university. Considering that small-sized companies may not have well-defined business processes or their business processes may not heavily rely on IT or ICTI solutions, data collection was limited to medium and large companies (each with 100 or more employees) in the USA and Canada that had undertaken a BPR project in the past three years. All respondents had participated in at least one such BPR project.
The researchers used an internet panel of potential respondents, chosen from the existing database of a commercial survey agency. In total, 21 percent of the targeted business professionals (294 out of 1,481) qualified under the requirements indicated above. Among the 294 qualified business professionals, 155 completed the survey, yielding an overall response rate of 52 percent. Ten of the 155 cases were dropped because participants failed to complete a number of the scales. For missing data in the remaining 145 cases, Little’s MCAR test (Little and Rubin, 2002) showed that these values were missing completely at random (Little’s MCAR test: w2¼7.358, Sig.¼
0.393). The missing data were replaced by mean values.
Table IV provides demographics of industry distributions and respondent department distributions.
3.4 Analysis method
SmartPLS 2.0 (Ringleet al., 2005) was used to analyze the data, as it allows latent constructs to be modeled either as formative or reflective indicators as was the case with this study’s data, and it is appropriate for exploratory studies (Chin, 1998). Because the model contains three second-order variables, the researchers created super-ordinate second-order constructs using factor scores for the first-order construct (Chinet al., 2003).
PLS works well with smaller sample sizes. The most frequently used rule for minimum sample size in PLS was proposed by Chin (1998, p. 311): “one simply has to look at the arrow scheme and find the largest of two possibilities: (a) the block with the largest number of formative indicators (i.e. largest measurement equation); or (b) the
780
BPMJ
20,5
dependent LV with the largest number of independent LVs impacting it (i.e. largest structural equation) [y] the sample size requirement would be 10 times either (a) or
(b), whichever is the greater.”
The research model in this study involves three formative constructs: change management, process redesign, and ICTI improvement, which have 3, 2, and 4 formative indicators, respectively. As for the structural equation, the dependent LV with the largest number of independent LVs impacting it is overall success, which has four paths leading into it. Therefore, the minimum sample size requirement for this study is 104, or 40.
Another rule that should be considered for sample size is that there is a need for doing a principal components factor analysis on the indicators for all the constructs for an exploratory study such as this. Everitt (1975) recommended that the proper case-to-indicator ratio range for PCA should be at least 10. The largest construct considered, i.e. ICTI improvement, has 13 indicators, although they are divided into four dimensions. Therefore, according to this rule, the minimum sample size requirement is 1310, or 130. The number of valid cases collected was145, meeting this criterion.
4. Analysis and results
4.1 Validity and reliability tests
For reflective constructs, their convergent validity, discriminant validity, and reliability were examined through the measurement model.
Convergent validity for reflective constructs is assumed when the loadings of their items are above 0.7 and are significant at the 0.05 level (Gefen and Straub, 2005). The results showed that all the item loadings were above 0.7, except for two items: OpQI1 from the operational quality improvement construct (0.668) and CS4 from the cost savings construct (0.655). These two items were removed from further analysis and PLS was rerun. Once done, the item loadings were all above 0.7 and significant at the 0.001 level. It can be concluded that convergent validity for the reflective constructs was shown.
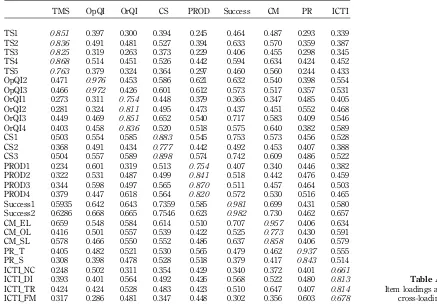
To test discriminant validity, we examined the table of item loadings and cross loadings (see Appendix 2) and the table of correlations among constructs (see Table V). The results showed that all item loadings for the constructs they were intended to
n % n %
Industry Department
Financial 23 15.8 Human resources 7 4.8
Healthcare and Pharmaceutical 17 11.7 Information Technology/systems 42 29.0
Manufacturing 16 11.0 Sales and/or marketing 24 16.6
Government 15 10.3 Production and/or manufacturing 19 13.1 Entertainment and others 12 8.3 Customer services 20 13.8
IT 10 6.9 Finance 14 9.7
Telecommunication 10 6.9 Management 9 6.2
Retail and Wholesale 7 4.8 Other 10 6.9
Education 6 4.1
Transportation 6 4.1
Food 5 3.4
Other 18 12.6
Total 145 100 Total 145 100
Table IV. Industry distribution and respondents’ department
781
Business process
redesign project
success
measure were above 0.7, and that they loaded less on the other constructs. The square roots of the average variance extracted (AVE) are shown as shaded results on the diagonal of Table V for all the reflective constructs. These results were all above 0.7 (note that AVE is not applicable for the formative constructs), and exceeded that construct’s correlations with other constructs. Hence, the constructs were shown to have adequate discriminant validity.
Composite reliability coefficients for all the reflective constructs in the PLS model were above 0.7 (see the reliability column in Table V). Hence, they passed the reliability test (Gefen and Straub, 2005).
For the three formative constructs, the researchers first tested their validity by examining their item weightings. As shown in Table VI, all the item weights, except for ICTII_FM, were significant. A decision to remove this dimension (i.e. IT facilities and management) from the ICTI improvement construct was made because its original literature source (Law and Ngai, 2007) was not very clear about this dimension in any case. After removing this dimension, PLS was rerun.
Second, multicollinearity was checked in the measures of the formative constructs, and the variance inflation factors (VIF) values for all the formative indicators ranged from 1.408 to 3.119, below the strict cut-off threshold of 3.3 (Petteret al., 2007). Correlations among the formative indicators were then examined for reliability. Correlations between the formative indicators of ICTI improvement were 0.314, 0.325, 0.480 (po0.01 in each case); those for change management were 0.548, 0.712, 0.674
(po0.01 in each case); and for process redesign it was 0.587 (po0.01). The results
Reliability (1) (2) (3) (4) (5) (6)
(1) Top management support 0.916 0.829
(2) Operational quality improvement 0.97 0.484***0.974
(3) Organizational quality improvement 0.886 0.449*** 0.452 0.814
(4) Cost savings 0.890 0.546*** 0.600 0.636 0.854
(5) Productivity 0.893 0.399*** 0.634 0.596 0.615 0.822
(6) BPR project success 0.981 0.626*** 0.620** 0.667*** 0.791*** 0.616 0.981
Notes:The italic numbers in the diagonal row are square roots of the average variance extracted. *po0.05; **po0.01; ***po0.001
Table V.
Correlations among constructs
Construct Items Weights t-value p-value
Change management CM_EL 0.592 4.548 ***
CM_OL 0.236 2.235 *
CM_SL 0.329 2.863 **
Process redesign PR_T 0.673 5.754 ***
PR_S 0.439 3.420 ***
ICTI improvement ICTII_NC 0.361 3.125 **
ICTII_DI 0.466 4.340 ***
ICTII_TR 0.473 5.143 ***
ICTII_FM 0.005 0.0397 ns
Notes:ns, not significant. *po0.05; **po0.01; ***po0.001
Table VI.
Weights of the indicator variables for formative constructs
782
BPMJ
20,5
indicate that the formative indicators belonged to their own sets respectively, even if they do not need to be correlated with one another (Pavlou and Sawy, 2006).
4.2 Structural model assessment
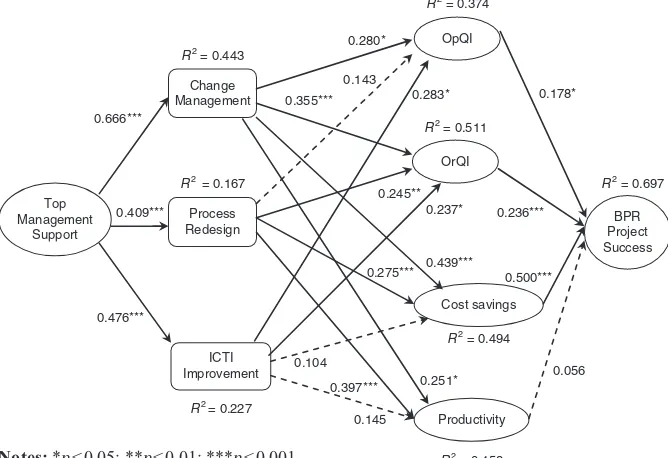
At the same time as PLS analysis estimates the measurement model, it also provides estimates of the structural model, i.e. the relationships between constructs or path coefficients. In order to interpret their significance, bootstrapping was run with 500 re-samples. The estimates of the resulting structural model are shown in Figure 2. The results show that most of the paths hypothesized (15 out of 19) were statistically validated. Only four of them were not supported (as denoted in the dashed lines in Figure 2).
It is evident from Figure 2 that the model demonstrated moderate to high explanatory power. TheR2value for the BPR project success construct was 0.697 (i.e. it explained 69.7 percent of the variance in BPR project success). This is a relatively good result for an exploratory study such as this. The R2 values for the other endogenous constructs ranged from 0.167 to 0.511.
5. Discussion
5.1 Impact
As mentioned earlier, BPR project implementation itself has previously seemed to be regarded as a black box and few studies have focussed on measuring and modeling what organizations should do during project implementation (Zellner, 2011, p. 1). This study tries to open this black box and to explore inside the BPR project implementation process. By identifying three important BPR project implementation components based on the STT, this study has created a multivariate research model
0.237* R2 = 0.511
R2 = 0.697
R2 = 0.458 Notes: *p< 0.05; **p< 0.01; ***p< 0.001
R2 = 0.167
R2 = 0.227
R2 = 0.494 R2 = 0.443
0.056 0.397***
0.236*** 0.178* 0.283*
0.275***
0.145 0.104
0.500***
0.476*** 0.666***
0.409***
0.251* 0.355***
0.280*
0.439***
Productivity
BPR Project Success
Cost savings OrQI
Top Management
Support
Change Management
Process Redesign
ICTI Improvement
0.245** 0.143
OpQI R2 = 0.374
Figure 2. Path model with PLS analysis results
783
Business process
redesign project
success
using formative construct techniques, and successfully tested the three components. The analysis results are discussed in the following.
This study provides conclusive evidence that change management significantly affects all four facets of BPR project outcomes (operational quality improvement, organizational quality improvement, cost savings, and productivity). This means that no matter which of these project outcomes are goals set by managers, change management is a significant determinant in achieving these goals. This finding is especially useful for companies who undertake BPR projects, for example, during the implementation of ERP systems. Many ERP implementers find themselves having to re-engineer their existing processes to fit the software they are implementing. At the same time, because of the major impact of change management on BPR project success, they should avoid overlooking change management issues while implementing specific systems, if they wish to achieve truly successful change (Huq et al., 2006).
The empirical results from this study also indicate that process redesign has a significant impact on organizational quality improvement, cost savings, and productivity, but not on operational quality improvement. The reason for this may be that operational quality emphasizes product quality and/or customer service quality, while process redesign practices aim to improve business processes through task elimination or combination, or downsizing by removing unnecessary people, groups, or departments from business processes.
Of interest, this study showed that ICTI improvement was significantly associated with operational and organizational quality improvements. This is probably because ICTI improvement builds a convenient and fast communication bridge among employees, and between companies and customers, yielding improved customer satisfaction and better cooperation among employees (Bhatt, 2000; Law and Ngai, 2007).
The non-significant influence of ICTI improvement on productivity and cost savings is perhaps not surprising. One study conducted by Terziovskiet al.(2003) also found that there was no significant relationship between the increased use of information technology and process cycle time reduction. One implication from this result is that managers must reengineer their core processes from a customer perspective (Terziovski et al., 2003). Three more implications concerning productivity and cost savings can be suggested as a result of this study. First, emphasizing productivity and cost savings through IT does not appear to be the focus of recent BPR projects; instead, IT development seems more focussed on improving organizational quality and operational quality within organizations and with customers. Second, it may be that companies are willing to spend money on ICTI for improving the quality of customer service and the quality of employee working life, but not necessarily for improving productivity or reducing costs. Third, there may be a time lag before the effects of BPR projects could be felt or seen. The reason of this point can be understood from the results of a recent study which show that some of the firm performance measures (e.g. labor productivity, financial ratios, and operational performance) improve in a decreasing manner after change implementation, and peak within two to ten years in general (Altinkemer, 2011). The results obtained from this study can provide useful recommendations for BPR practitioners. First, TMS plays an important role in realizing all three BPR project implementation components (i.e. change management, process redesign, and ICTI improvement).
Second, change management must be seriously planned and comprehensively carried out in order to achieve BPR project success. Change management involves
784
BPMJ
20,5
three dimensions: organizational level, employee level, and stakeholder level. At the organizational level of change management, human resource policies, reward and compensation systems should be properly reviewed and revised. An effective culture for organizational change should be created to increase the likelihood of success. With respect to the employee level of change management, it is essential to deal effectively with employee resistance, through improved communication, employee empowerment, or effective training. The stakeholder level of change management requires adequate communication with stakeholders to solicit their opinions on BPR projects.
Third, managers need to carefully define BPR project goals: does this project aim at cost savings, productivity, or other goals? Starting from the defined project goal, the implementation components can then be assigned appropriate priorities. This is especially important in planning a project with limited project resources.
5.2 Limitations and future research
The main limitation of this study is its generalizability with respect to company size and organizational culture. The sample in this study was drawn from medium- and large-sized companies in Canada and the USA. Small organizations have their own distinct features such as superior flexibility, ability to reorient themselves quickly, capacity for rapid decision making, and proximity to their markets (Raymondet al., 1998). Company size needs to be considered in the explanation of such a study. As for organizational culture, this study controlled this variable by limiting respondents to Canada and US companies. A recent literature review of BPM shows that culture is still a widely under-researched topic in BPM ( Jan vom and Theresa, 2011). Therefore, it would be very interesting to investigate BPR project implementations in other countries where the organizational working culture may be different (Martinsonset al., 2009).
This study is the first BPR project implementation study to use formative constructs to measure relevant factors. A diligent literature search screened feasible methods to build and validate the three formative constructs. However, more studies are needed in order to improve our understanding of these constructs. For example, the ICTI construct needs to be improved. Law’s study (Law and Ngai, 2007) added dimensions of facilities and management (as defined in Section 3.1) to ICTI improvement, but this study showed this dimension was not an important contributor to ICTI improvement. Hence, this dimension of ICTI should be retested in future studies, so that the domain specification for ICTI improvement can be refined. Relevant studies in defining and validating dimensions of ICTI have been published recently (Fink and Neumann, 2009; Sobol and Klein, 2009), providing a better foundation for refining this multidimensional construct. Another limitation of this study concerns the sample size. Although the sample collected in this study was sufficient for PLS analysis, a larger sample set would likely generate more solid results.
6. Conclusions
The conclusions from our study are first, that STT has been validated in the BPR project implementation research context. The establishment of the BPR project implementation model was based on the well-known aspects of STT, and included the development of three BPR project implementation components (i.e. change management, process redesign, and ICTI improvement). The results from analyzing the research model showed that the great majority of the variance in BPR project measures of success (69.7 percent) was explained through factors based on STT. This provides a foundation for utilizing STT in future BPR project research.
785
Business process
redesign project
success
Second, to the best of the researchers’ knowledge, this is the first study to model certain activities related to BPR project implementation as formative constructs, rather than with traditional reflective constructs. As such, this study significantly advances BPR project research. Formative indicators are often neglected despite their appropriateness in many instances, and a high percentage of latent constructs have therefore been found to be incorrectly modeled in many research areas (e.g. marketing, management information systems, organizational behavior, etc.) ( Jarvis et al., 2003; Petteret al., 2007; Diamantopouloset al., 2008). This exploratory study successfully built and validated three formative constructs for BPR project implementation components (i.e. change management, process redesign, and ICTI improvement), following existing guidelines for formative construct development ( Jarviset al., 2003; Petteret al., 2007; Diamantopouloset al., 2008).
Finally, a major achievement from this study is its contribution to modeling BPR project implementation components, based on various dimensions that have been identified from the existing literature, and the development and validation of sound constructs that could be used in structural equation modeling (SEM) methodologies. By achieving this, progress in BPR project research has advanced significantly in the utilization of quantitative methodologies to validate appropriate research models in this field, and to offer better generalizability of results than that found in the existing literature.
References
Abdolvand, N., Albadvi, A. and Ferdowsi, Z. (2008), “Assessing readiness for business process reengineering”,Business Process Management Journal, Vol. 14 No. 4, pp. 497-511. Aghdasi, M., Albadvi, A. and Ostadi, B. (2010), “Desired organisational capabilities (DOCs): mapping
in BPR context”,International Journal of Production Research, Vol. 48 No. 7, pp. 2029-2053. Ahadi, H.R. (2004), “An examination of the role of organizational enablers in business
reengineering and the impact of information technology”, Information Resources Management Journal, Vol. 17 No. 4, pp. 1-19.
Al-Mashari, M. and Zairi, M. (1999), “BPR implementation process: an analysis of key success and failure factors”,Business Process Management Journal, Vol. 5 No. 1, pp. 87-112. Altinkemer, K.Y.Z.D. (2011), “Productivity and performance effects of business process reengineering:
a firm-level analysis”,Journal of Management Information Systems, Vol. 27 No. 4, pp. 129-162. Attaran, M. (2003), “Information technology and business-process redesign”,Business Process
Management Journal, Vol. 9 No. 4, pp. 440-458.
Bhatt, G.D. (2000), “Exploring the relationship between information technology, infrastructure and business process re-engineering”,Business Process Management Journal, Vol. 6 No. 2, pp. 139-163.
Bostrom, R.P. and Heinen, J.S. (1977), “MIS Problems and failures: a socio-technical perspective. Part I: the causes”,MIS Quarterly, Vol. 1 No. 3, pp. 17-32.
Bradley, J. (2008), “Management based critical success factors in the implementation of enterprise resource planning systems”, International Journal of Accounting Information Systems, Vol. 9 No. 3, pp. 175-200.
Chin, W.W. (1998), “The partial least squares approach to structural equation modeling”, in Marcoulides, G.A. (Ed.), Modern Methods for Business Research, Lawrence Erlbaum, Mahwah, NJ, pp. 295-336.
Chin, W.W., Marcolin, B.L. and Newsted, P.R. (2003), “A partial least squares latent variable modeling approach for measuring interaction effects: results from a monte carlo simulation study and an electronic-mail emotion/adoption study”,Information Systems Research, Vol. 14 No. 2, pp. 189-217.
786
BPMJ
20,5
Davenport, T.H. (1993), Process Innovation: Reengineering Work Through Information Technology, Harvard Business School Press, Boston, MA.
Diamantopoulos, A., Riefler, P. and Roth, K.P. (2008), “Advancing formative measurement models”,Journal of Business Research, Vol. 61 No. 12, pp. 1203-1218.
Everitt, B.S. (1975), “Multivariate analysis: the need for data and other Problems“,The British Journal of Psychiatry, Vol. 126 No. 3, pp. 237-240.
Fenelon, M.J. III. (2002), “Success factors for reengineering projects at medium-sized firms”, PhD thesis, University of New Haven, West Haven, Connecticut.
Fink, L. and Neumann, S. (2009), “Exploring the perceived business value of the flexibility enabled by information technology infrastructure”,Information & Management, Vol. 46 No. 2, pp. 90-99. Fui-Hoon Nah, F., Zuckweiler, K.M. and Lee-Shang Lau, J. (2003), “ERP Implementation: chief information officers’ perceptions of critical success factors”, International Journal of Human-Computer Interaction, Vol. 16 No. 1, pp. 5-22.
Gefen, D. and Straub, D. (2005), “A practical guide to factorial validity using PLS-Graph: tutorial and annoated example”,Communications of AIS, Vol. 16 No. 1, pp. 91-109.
Grover, V. and Jeong, S.R. (1995), “The implementation of business process reengineering”, Journal of Management Information Systems, Vol. 12 No. 1, pp. 109-144.
Grover, V., Teng, J., Segars, A.H. and Fiedler, K. (1998), “The influence of information technology diffusion and business process change on perceived productivity: the IS executive’s perspective”,Information & Management, Vol. 34 No. 3, pp. 141-159.
Guha, S. and Grover, V. (1997), “Business process change and organizational performance: exploring an antecedent model”,Journal of Management Information Systems, Vol. 14 No. 1, pp. 119-154.
Hamilton, S. and Chervany, N.L. (1981), “Evaluating information system effectiveness – part I: comparing evaluation approaches”,MIS Quarterly, Vol. 5 No. 3, pp. 55-69.
Hammer, M. and Champy, J. (1993),Reengineering the Corporation: A Manifesto for Business Revolution, Harper Business Editions, New York, NY.
Herzog, N.V., Tonchia, S. and Polajnar, A. (2009), “Linkages between manufacturing strategy, benchmarking, performance measurement and business process reengineering”, Computers & Industrial Engineering, Vol. 57 No. 3, pp. 963-975.
Houy, C., Fettke, P. and Loos, P. (2010), “Empirical research in business process management – analysis of an emerging field of research”,Business Process Management Journal, Vol. 16 No. 4, pp. 619-661.
Hung, R.Y.-Y. (2006), “Business process management as competitive advantage: a review and empirical study”,Total Quality Management and Business Excellence, Vol. 17 No. 1, pp. 21-40. Huq, Z., Huq, F. and Cutright, K. (2006), “BPR through ERP: Avoiding change management
pitfalls”,Journal of Change Management, Vol. 6 No. 1, pp. 67-85.
Ifinedo, P. and Nahar, N. (2009), “Interactions between contingency, organizational IT factors, and ERP success”,Industrial Management & Data Systems, Vol. 109 No. 1, pp. 118-137. Jan Vom, B. and Theresa, S. (2011), “Culture in business process management: a literature
review”,Business Process Management Journal, Vol. 17 No. 2, pp. 357-378.
Jarvenpaa, S.L. and Stoddard, D.B. (1998), “Business process redesign: radical and evolutionary change”,Journal of Business Research, Vol. 41 No. 1, pp. 15-27.
Jarvis, C.B., Mackenzie, S.B., Podsakoff, P.M., Mick, D.G. and Bearden, W.O. (2003), “A critical review of construct indicators and measurement model misspecification in marketing and consumer research”,Journal of Consumer Research, Vol. 30 No. 2, pp. 199-218.
Lashway, L. (2006), “Leadership styles and strategies”, in Smith, S.C., Piele, P.K. and Murphy, J. (Eds), School Leadership: Handbook for Excellence in Student Learning, Corwin Press, Thousand Oaks, California, pp. 77-103.
787
Business process
redesign project
success
Law, C.C.H. and Ngai, E.W.T. (2007), “IT Infrastructure capabilities and business process improvements: association with IT governance characteristics”, Information Resources Management Journal, Vol. 20 No. 4, pp. 25-47.
Little, R.J.A. and Rubin, D.B. (2002),Statistical Analysis With Missing Data, Wiley, Hoboken, NJ. Mansar, S.L. and Reijers, H.A. (2005), “Best practices in business process redesign: validation
of a redesign framework”,Computers in Industry, Vol. 56 No. 5, pp. 457-471.
Mansar, S.L. and Reijers, H.A. (2007), “Best practices in business process redesign: use and impact”,Business Process Management Journal, Vol. 13, pp. 193-213.
Markus, M.L. (1983), “Power, Politics, and MIS Implementation”,Communications of the ACM, Vol. 26 No. 6, pp. 430-444.
Martinsons, M.G., Davison, R. and Martinsons, V. (2009), “How culture influences IT-enabled organizational change and information systems”,Communications of the ACM, Vol. 52 No. 4, pp. 118-123.
Newell, S., Swan, J.A. and Galliers, R.D. (2000), “A knowledge-focused perspective on the diffusion and adoption of complex information technologies: the BPR example”, Information Systems Journal, Vol. 10 No. 3, pp. 239-259.
Oakland, J.S. and Tanner, S.J. (2007), “Successful change management”, Total Quality Management and Business Excellence, Vol. 18 Nos 1/2, pp. 1-19.
Ozcelik, Y. (2010), “Do business process reengineering projects payoff? Evidence from the United States”,International Journal of Project Management, Vol. 28 No. 1, pp. 7-13.
Paper, D. and Chang, R.-D. (2005), “The state of business process reengineering: a search for success factors”,Total Quality Management, Vol. 16 No. 1, pp. 121-133.
Pavlou, P.A. and Sawy, O.A.E. (2006), “From IT Leveraging competence to competitive advantage in turbulent environments: the case of new product development”,Information Systems Research, Vol. 17 No. 3, pp. 198-227.
Petter, S., Straub, D. and Rai, A. (2007), “Specifying formative constructs in information systems research”,MIS Quarterly, Vol. 31 No. 4, pp. 623-656.
Ramirez, R., Melville, N. and Lawler, E. (2010), “Information technology infrastructure, organizational process redesign, and business value: an empirical analysis”, Decision Support Systems, Vol. 49 No. 4, pp. 417-429.
Raymond, L., Bergeron, F. and Rivard, S. (1998), “Determinants of business process reengineering success in small and large enterprises: An”, Journal of Small Business Management, Vol. 36 No. 1, pp. 72-85.
Ringle, C.M., Wende, S. and Will, S. (2005), “SmartPLS 2.0 (M3) beta”, Hamburg, available at: www.smartpls.de
Roberts, N. (1984), “Transforming leadership: sources, process, consequences”, Academy of Management Conference, Boston, MA.
Sarker, S. and Lee, A.S. (2002), “Using a positivist case research methodology to test three competing theories-in-use of business process redesign”, Journal of the Association for Information Systems, Vol. 2 No. 1, Article 7.
Sarker, S., Sarker, S. and Sidorova, A. (2006), “Understanding business process change failure: an actor-network perspective”,Journal of Management Information Systems, Vol. 23 No. 1, pp. 51-86.
Sobol, M.G. and Klein, G. (2009), “Relation of CIO background, IT infrastructure, and economic performance”,Information & Management, Vol. 46 No. 5, pp. 271-278.
Terziovski, M., Fitzpatrick, P. and O’Neill, P. (2003), “Successful predictors of business process reengineering (BPR) in financial services”,International Journal of Production Economics, Vol. 84 No. 1, pp. 35-50.
788
BPMJ
20,5
Young, R. and Jordan, E. (2008), “Top management support: Mantra or necessity?”,International Journal of Project Management, Vol. 26 No. 7, pp. 713-725.
Zˇabjek, D. and Sˇtemberger, M.I. (2009), “The influence of business process management and some other CSFs on successful ERP implementation”,Business Process Management Journal, Vol. 15 No. 4, pp. 588-608.
Zellner, G. (2011), “A structured evaluation of business process improvement approaches”, Business Process Management Journal, Vol. 17 No. 2, pp. 203-237.
Appendix 1. Questionnaire for BPR Study
Have you participated in any BPR projects within the past 3 years? (1) Yes-continue the survey.
(2) No-show the message: “For this survey we are seeking the opinions of people in a
different target group than your own.” and exit. How many people does the company employ worldwide?
(1) 500 or more employees-continue the survey. (2) 100-499 employees-continue the survey.
(3) Fewer than 100 employees-show the message: “For this survey we are seeking the
opinions of people in a different target group than your own.” and exit.
Please recall ONE of the BPR projects in your company that you have participated in, and answer all of the following questions based on your perceptions of this BPR project. There is no right or wrong answer to any of these questions.
The main location in which the BPR project was undertaken was in: (1) United States
(2) Canada
Which department were you in at the time the BPR project was undertaken? (1) Human Resources
(2) Information Technology/Information Systems (3) Sales and/or Marketing
(4) Production and/or Manufacturing (5) Customer Services
(6) Finance (7) Management
(8) Other (Please specify):
Industry: ______
(A 7-item Likert-type scale ranging from strongly disagree to strongly agree was used for all of the following statements.)
How would you evaluate top management support for the BPR project? a) Top management was favorable in the implementation of the BPR project. b) Top management was able to understand the concepts of the BPR project. c) Top management considered the BPR project to be important to the company. d) Top management effectively communicated its support for the BPR project. e) Top management provided adequate funding for the project.
How would you evaluate the following change management items regarding your BPR project? a) The BPR project properly reviewed and revised reward/motivation and compensation systems. b) The BPR project management made necessary changes in human resource policies as a
result of the BPR implementation.
c) The BPR project stimulated the organization’s receptivity to change. d) The BPR project created an effective culture for organizational change.
789
Business process
redesign project
success
e) The BPR project management effectively communicated the reasons for change to management and employees.
f) The BPR project management properly empowered relevant employees.
g) The BPR project management provided adequate training for personnel affected by the redesigned processes.
h) The vision of the BPR project was communicated well to all the stakeholders. i) All the stakeholders were solicited for feedback on the project.
j) BPR Strategic Initiatives.
Were the following process redesigns involved in your BPR project?
a) The BPR project involved eliminating unnecessary tasks from business processes. b) The BPR project involved combining small tasks into composite tasks or dividing large
tasks into workable smaller tasks.
c) The BPR project involved moving and resequencing tasks to more appropriate places in the processes.
d) The BPR project involved arranging tasks to be executed in parallel.
e) The BPR project involved integration of business processes with those of customers or suppliers.
f) The BPR project involved empowering workers with more decision-making authority. g) The BPR project involved assigning workers to perform as many steps as possible for
single orders.
h) The BPR project involved making human resources more specialized or more generalized. i) The BPR project involved minimizing the number of departments, groups, and persons
involved in business processes.
How would you evaluate the improvement of the ICT (Information and Communication Technology) infrastructure capabilities in your company as a result of the BPR project?
a) Networks which link the company and its main suppliers were improved as a result of the BPR project.
b) Networks which link the company and its main customers were improved as a result of the BPR project.
c) Information and data sharing across the company was improved as a result of the BPR project.
d) Duplication of data was reduced or eliminated as a result of the BPR project.
e) The standardization of data element definitions across the company was improved as a result of the BPR project.
f) The company improved its IT training programs through the BPR project. g) Training of users was adequate through the BPR project.
h) Training of IT personnel was adequate through the BPR project.
i) Company servers were increased in capacity as a result of the BPR project.
j) Regular preventive maintenance down time was reduced as a result of the BPR project. k) The company had increased expertise to manage its IT facilities after the BPR project. l) Users were more satisfied with IT services as a result of the BPR project.
m) IT administration standards and procedures were improved as a result of the BPR project.
How would you evaluate the extent of achieved outcomes of the BPR project for your company? OpQI
a) The BPR project achieved product quality improvement. b) The BPR project achieved customer services improvement. c) The BPR project achieved customer satisfaction improvement. OrQI
a) The BPR project resulted in less managerial hierarchy.
790
BPMJ
20,5
b) The BPR project reduced bureaucracy.
c) The BPR project improved internal users’ satisfaction.
d) The BPR project improved communication within the company. Cost Savings
a) The BPR project achieved a good return on investment. b) The BPR project improved company profits.
c) The BPR project saved on operational costs. d) The BPR project saved on personnel costs. Productivity
a) The BPR project achieved more units produced or more customers served per unit time. b) The BPR project achieved fewer delays in production and/or services.
c) The BPR project achieved shortened cycle time in production and/or customer services. d) The BPR project achieved lower error rates in production and/or customer services. Overall Success
a) Overall, this BPR project was successful.
b) Overall, this BPR project achieved favorable outcomes.
Thank you for your participation in our survey.
Appendix 2
TMS OpQI OrQI CS PROD Success CM PR ICTI
TS1 0.851 0.397 0.300 0.394 0.245 0.464 0.487 0.293 0.339 TS2 0.836 0.491 0.481 0.527 0.394 0.633 0.570 0.359 0.387 TS3 0.825 0.319 0.263 0.373 0.229 0.406 0.455 0.298 0.345 TS4 0.868 0.514 0.451 0.526 0.442 0.594 0.634 0.424 0.452 TS5 0.763 0.379 0.324 0.364 0.297 0.460 0.560 0.244 0.433 OpQI2 0.471 0.976 0.453 0.586 0.621 0.632 0.540 0.398 0.554 OpQI3 0.466 0.972 0.426 0.601 0.612 0.573 0.517 0.357 0.531 OrQI1 0.273 0.311 0.754 0.448 0.379 0.365 0.347 0.485 0.405 OrQI2 0.281 0.324 0.811 0.495 0.473 0.437 0.451 0.552 0.468 OrQI3 0.449 0.469 0.851 0.652 0.540 0.717 0.583 0.409 0.546 OrQI4 0.403 0.458 0.836 0.520 0.518 0.575 0.640 0.382 0.589 CS1 0.503 0.554 0.585 0.883 0.545 0.753 0.573 0.456 0.528 CS2 0.368 0.491 0.434 0.777 0.442 0.492 0.453 0.407 0.388 CS3 0.504 0.557 0.589 0.898 0.574 0.742 0.609 0.486 0.522 PROD1 0.234 0.601 0.319 0.513 0.754 0.407 0.340 0.446 0.382 PROD2 0.322 0.531 0.487 0.499 0.841 0.518 0.442 0.476 0.459 PROD3 0.344 0.598 0.497 0.565 0.870 0.511 0.457 0.464 0.503 PROD4 0.379 0.447 0.618 0.564 0.820 0.572 0.530 0.516 0.465 Success1 0.5935 0.642 0.643 0.7359 0.585 0.981 0.699 0.431 0.580 Success2 0.6286 0.668 0.665 0.7546 0.623 0.982 0.730 0.462 0.657 CM_EL 0.659 0.548 0.584 0.614 0.510 0.707 0.957 0.406 0.634 CM_OL 0.416 0.501 0.557 0.539 0.422 0.525 0.773 0.430 0.591 CM_SL 0.578 0.466 0.550 0.552 0.486 0.637 0.858 0.406 0.579 PR_T 0.405 0.482 0.521 0.530 0.565 0.479 0.462 0.937 0.555 PR_S 0.308 0.398 0.478 0.528 0.518 0.379 0.417 0.843 0.514 ICTI_NC 0.248 0.502 0.311 0.354 0.429 0.340 0.372 0.401 0.661
ICTI_DI 0.393 0.401 0.564 0.492 0.426 0.568 0.522 0.480 0.813
ICTI_TR 0.424 0.424 0.528 0.483 0.423 0.510 0.647 0.407 0.814
ICTI_FM 0.317 0.286 0.481 0.347 0.448 0.302 0.356 0.603 0.678
Table AI. Item loadings and cross-loadings
791
Business process
redesign project
success
About the authors
Dr Junlian Xiang is currently an Assistant Professor at the Ted Rogers School of Business, Ryerson University. She obtained her PhD in Information systems from the DeGroote School of Business, McMaster University. Her research interests lie in business process redesign, change management and ICT infrastructure. Dr Junlian Xiang is the corresponding author and can be contacted at: [email protected]
Dr Norm Archer is a Professor Emeritus in the DeGroote School of Business at McMaster University. In his research he is active, in collaboration with his graduate students and colleagues, in the study of organizational problems relating to the implementation of eBusiness approaches in health, business, and government organizations, and the resulting impacts on processes, employees, customers, and suppliers. He has published over 100 refereed journal and conference papers.
Dr Brian Detlor is an Associate Professor of Information Systems at the DeGroote School of Business, McMaster University in Hamilton, Ontario, Canada, and the Chair of the McMaster Research Ethics Board. He specializes and conducts research on digital literacy, electronic government, web information seeking, and web site adoption and use.
To purchase reprints of this article please e-mail:[email protected]
Or visit our web site for further details:www.emeraldinsight.com/reprints
792
BPMJ
20,5
This article has been cited by:
1. Viktorija Skvarciany, Juris Iljins. 2015. The role of change management in trust formation in commercial banks. Verslas: Teorija ir Praktika 16:4, 373-378. [CrossRef]