Jejak Vol 9 (2) (2016): 200-221. DOI: http://dx.doi.org/10.15294/jejak.v9i2.8234
JEJAK
Journal of Economics and Policy http://journal.unnes.ac.id/nju/index.php/jejak
Market Structure and Price Transmission of Eggs Commodity
Abdul Aziz Ahmad1 ,Agus Arifin2, Boon Cheong Chew3
1,2Jenderal Soedirman University, Indonesia 3Universiti Teknikal Malaysia Melaka, Malaysia
Permalink/DOI: http://dx.doi.org/10.15294/jejak.v9i2.8234
Received: March 2016; Accepted: June 2016; Published: September 2016
Abstract
Purposes of this research are to determine some characteristics of distribution channel, market structure, and price maker transmission in purebred chicken egg commodity in Banyumas District, Central Java Province. Primary data applied on this research is from all channel distribution levels; from producers to final consumers. Meanwhile secondary data is collected from government official sources, such as BPS-Statistic of Banyumas Disrict, Banyumas Department of Industry, Trading and Cooperation, and previous researches which has been made by researcher team. Sample determining is directed by proportional random sampling methods. Some measurements are applied to this research, including to; Herfindahl Index (HI), Concentration Ratio (CF), and Minimum Efficiency Scale (MES) to investigate market structure; and Asymmetric Price Transmission (APT) to determine price transmission mechanism model. This research finds that (1) the distribution channel of egg commodity is spitted to different channel, the first channel: egg producer – retail traders – final consumers, and second channel: egg producers – whole seller – retail traders – final consumers; (2) market structure which is created to this farming specific commodity is perfect market; (3) price transmission mechanism analysis statistically shows that there is almost no existence of dominant power in price formation.
Key words : purebred chicken egg, distribution channel, market structure, perfect competition, asymmetric price transmission.
How to Cite: Ahmad, A., Arifin, A., & Chew, B. (2016). Market Structure and Price Transmission of Eggs Commodity. JEJAK: Jurnal Ekonomi Dan Kebijakan, 9(2), 200-221. doi:http://dx.doi.org/10.15294/jejak.v9i2.8234
© 2016 Semarang State University. All rights reserved
Corresponding author :
Address: Jl. Prof. H.R. Boenyamin No. 708, Purwokerto, Central Java 53122, Indonesia
E-mail: [email protected]
INTRODUCTION
In the developed countries, the production of chicken eggs has made important contributions to the economy. For example, Otto, Ibarburu and Schultz (2013) industry. Then, the multiplier effects encourage the employments as many as 7,960 jobs, providing the additional labor income of $424 millions to the labors and stimulating the economy up to $567 millions. While in the developing countries, the contribution of purebred chicken eggs also occupies a strategic position. In Pakistan, for
example, this sector provides the
employment impact both directly and indirectly in approximately 1.5 million people. Pakistan is able to produce 10,000 million slices of chicken eggs including 1,196 metric tons to feed the laying hens (Memon, et al, 2015).
Globally, the egg production in 2012 was estimated to increase by 350.2% from that in 1962 (Windhorst, 2014). The main contributor in the egg production is China (with a global market share of 36.6%). In the report, Indonesia has a market share of 3.1% in 2012, which is lower than USA (6.0%), India (4.6%), and Brazil (4.4%). The egg production in Indonesia experienced a highly increase of global market share that is 0.8% in 1962 to 2.3% in 1987. The achievement of that egg production that occupies the fifth rank globally indicates that the Indonesian egg industry has good attention and implicitly shows improvement in food
consumption patterns of Indonesian
community.
Particularly, in the specific area, Banyumas Regency, the purebread chicken egg production is able to fulfill the community demand. The production of eggs in Banyumas is noted more than 7,000 tons in 2013 (BPS, 2013). Kembaran District is the biggest egg producer with the production of more than 2,773 tons (39.5%). The second largest producer of eggs is Sumbang District with the production of more than 2,146 tones (30.5 %), followed by Cilongok District with the production of more than 810 tons (11.5%), followed by the Pakuncen District with the traders/retailers then to the final consumers. This distribution channel can be found in the traditional markets in general, such as Manis Market and Wage Market. Second, the eggs are sold to the wholesalers previously then to the small traders and then to the final consumers. This distribution channel can be found in the market area of Ajibarang and its surrounding.
Most breeders sell their eggs to the wholesalers. However, some sell the eggs by 40% of distribution to the wholesalers and by 60% of distribution to the retailers. Some also sell them by 10% of distribution to the wholesalers and by 90% of distribution to the retailers. Some breeders do not sell the eggs to the wholesalers but to the retailers by 98% of distribution and directly to the final consumers by 2% of distribution.
producers (breeders), distributors, and traders themselves those are the physical condition of the eggs that is not durable (an egg can be in maximum good condition for one to two weeks after hatching). Besides, the transportation cost is relatively unstable, so sometimes it causes a little obstacle in the distribution around Purwokerto and the surrounding areas. The changing weather problems also cause the delaying in the process of egg distributions to the traders in various locations such as the modern and traditional markets, shops, and stalls.
The length of the chain of distribution channels that must be passed by a commodity also impacts the price reflected on the consumer side. The commodity price is expected to be more expensive with the longer chain length distribution channels of this commodity. The behavior of the distribution channels is influenced by the structure of the markets in which the
company is operated. Besides, the
distribution channels can also be performed by the agent. In the pattern of the agency, services to the small business that is able to implement the cooperation (Rudiyanto, 2014).
The producer behavior may depend on the structural condition of the market whether it is the perfect, oligopoly, or monopoly competition (Samuelson and Nordhaus, 2005). Producers in a perfect competitive market will tend to adjust to the condition of the market price (equilibrium) while the monopolist producer will tend to be free to determine the price of commodities in the absence of the
competitive producer. The less competition in a market is, the greater the profits the producer will gain. Monopoly market with one seller/producer will gain greater profits compared to the market with greater competition, as in perfect competition.
Porter (1990) argued that the market structure itself is influenced by various factors such as the level of technological mastery, the elasticity of demand for a product, location, entry barriers to the market, and the level of efficiency. He said that in relation to the structure of the market and the commodity price formation process in the chain of distribution channels, there is the different price formation behaviors among the producers that become the market leader in a market compared to the other producer that only becomes the market follower (Porter, 1990).
Related to the importance of
understanding the distribution channels, the
market structure, the chicken egg
commodity and transmission, the
Africa, the weakest distribution actors are farmers as producers of commodities. Due to the lack of access to the agricultural markets, the farmers are highly dependent on the presence of other market players in the next distribution channels (traders, consumers, and brokers) (Magesa et al., 2014).
In contrast to the price mechanism in the African region, some developed countries of Europe and Australia show a relatively balanced profit chain in every distribution channel. The research conducted in eight European countries (Naspetia, et al, 2011) shows the joint planning and supply chain relationships are able to drive the increase in the quality and durability of the distribution chain. Likewise, the research result of Wiedemann and McGahan (2011) that detected the chain of egg production in Australia finds that the adoption of
management practices based on
environment may develop the egg industry in Australia, which has the characteristics of intensive, modern, and highly efficient in the production system. Besides, this industry is able to encourage the egg production rapidly up to 345 million dozen of eggs per year.
Based on those explanations, the issues built in this research are how the behaviors of the egg commodity prices formation in the chain of distribution channels from the egg channel in Banyumas Regency. This research provides the important benefits especially in making the policy of food price stabilization, particularly the egg commodity.
RESEARCH METHODS
This research is developed in the fields of industrial economy related to the market structure and the formation of commodity prices. The research is conducted on the
producers of purebred chicken egg
commodity in Banyumas. The producers form a chain of sub-producers in the distribution channel that shows the movement process of the egg commodity from the breeder as the first sub-producer to the retailer as the last sub-producer who sells the eggs to the consumers.
This research uses the primary and secondary data. The primary data is obtained from the questionnaires and interviews with
the sub-producers. Meanwhile, the
secondary data is collected from the relevant government institutions, such as the Central Bureau of Statistics (BPS); the Department of Industry, Trade, and Cooperatives; etc. and also the surveys that have been conducted before (Ahmad, Arifin, and Priyono, 2011).
The sample for primary data is determined by the proportional random sampling. It means that the respondents are selected randomly using several stages of sampling and it still pays attention to the contribution of each sub-producer of the purebred chicken egg commodity in each region.
The first stage, the respondent samples are determined from the egg retailers randomly in six traditional markets in Banyumas Regency. The second stage, all information from the first stage can be used to determine the suppliers of the eggs that are sold to the retailers, and the location where the eggs are from. The respondents required in this stage are the wholesalers with the information from the retailers.
number of samples is proportionally determined by ten retailers, five wholesalers, ten breeders, and five final consumers.
Distribution Channels Analysis
Researches on the distribution
channels of food commodities have already been conducted. The detection of businesses throughout the distribution channel aims to
understand how the patterns of
communication and information are until the formation of prices at the consumer level for each agent integrated in the distribution channel such as producers, manufacturers, distributors, and end final consumers (Fuentes-Pila et al, 2007).
The first objective of this research is to analyze the transmission process of price
formation, including the distribution
channels, the production costs, and the resale values, and the barriers to the
distribution of the egg commodity.
Therefore, the research is conducted through the direct surveys on the producers. The survey results are useful to know the behavior of producers, distributors, and retailers in the transmission mechanism of price formation of the egg commodity in Banyumas Regency.
Some general considerations in this survey are (1) whether the identification of the distribution channels follows a simple
pattern such as: producers wholesalers
retailers final consumers, or there are any other patterns of distribution channels; (2) the costs of distribution depend on several factors, especially the delivery location (mileage), the commodity characteristics, the increase in fuel prices that directly affects the costs of distribution; (3) the constraints of distribution may be the availability of inadequate infrastructure, disruption of
nature/weather, and the limited
transportation; (4) it is associated with the behavior of producers, distributors, and retailers in the formation of the goods prices, which will seek the information on the basis of pricing in each of the distribution chain, whether based on the costs of production plus the profit margin, or the market prices, or the price determined by the competitor, or the price in buyer level.
Market Structure Analysis
The market structure is some
characteristics of a market organization which strategy affects the nature of competition and price formation in the market (Pritchard, 1969). In this research, the detection of market structure is developed by analyzing the concentration and barriers to entry. This is in accordance with Martin (1994) and Scherer (1996) who stated that the market structure can be detected by the concentration and barriers to entry.
Concentration is performed to measure the size distribution of firms in the industry. It is measured by two tools of analysis, namely the Herfindahl Index (HI) and the Concentration Ratio (CR). HI is one tool to measure market power (Samuelson and Nordhaus, 2005). HI is the sum of squares of the market share of every firm in the industry (N) (Martin, 1994: 115), noted as:
H = s12 + s22 + s32+ … + sN2 ...(1)
In which H is Herfindahl Index (HI) and sis
the market share of every firms in the
industry.
value to 0 is, the smaller the concentration in the industry will be, and therefore the closer it is to the perfect competition behavior will be. Based on the US Department of Justice and the Federal Trade Commission, the range of HI is divided into four criteria:
highly competitive index (HI<0.01),
unconcentrated index (HI<0.1), moderate concentration index (HI=0.1 to 0.18), and high concentration index (HI>0.18).
Concentration Ratio (CR) is used to measure the concentration of the industry by ordering companies that have the largest
the greater the concentration of this industry will be. CR used in this study is the four share of no more than 40%, it is categorized as the loose oligopoly (Stepherd in Jaya, 2001: 7). Oligopoly with eight largest firms dominating the market for less than 33% is usually called the unconcentrated industry (Hani and Turner, 1959, in Kuncoro, 2007: 142).
Meanwhile, to measure the barriers to entry it uses a tool analysis of Minimum
Efficiency Scale (MES). MES is the size of the barriers to entry for a firm in the industry. If a firm can easily enter the market then it can be said that the barriers to enter the market is small. MES can be calculated as follows:
output
According to Lubis (1997) in Bank Indonesia study (2011), MES>10% shows the high barriers to entry for a firm in the industry.
These approaches have been
experienced in several researches related to the market structure, especially in some industrial sectors to assess the market structure in the banking industries, the great trades, and the small trades.
Price Formation Transmission Analysis egg price formation using the econometric approach with the Vector Autoregressive (VAR) model. In that research, the egg price at the farm and retail levels is positively affected by a shock of corn price. This research also shows that the egg price will respond positively with an increase of about 33% when the price of corn increases 100%.
chain that have an impact on the relationship among the agents at every activity level or different distribution channels (Vavra and Goodwin, 2005). Analysis of price transmission is important to detect the pattern of asymmetric price formation among agents along distribution channels (Bor et al., 2014).
To study the behavior of producers, distributors, and retailers in the mechanism of price formation transmission, the empirical method used is Asymmetric Price Transmission (APT). APT method is developed from the basic equation of price transmission. Assumed that the price adjustment process is symmetric and linear, the equation used is the basic equation of
price transmission (Peltzman, 2000).
However, on progress, the basic equation becomes Asymmetric Price Transmission (APT) by considering the dimensions of inter temporal price changes (time series). APT is based on variable segmentation of moving up and down in price.
...(5) In which:
: Price first derivative at retail level
: Price moving up at retail level
: Price moving down at upstream level
Tweeten and Quance (1969) operated a dummy variable technique to estimate the irreversible supply function. The equation below is a translation of the supply function in the context of price transmission, which is noted as follows:
price at upstream level moves up ( in
t in t p
p 1
); Dt= dummy variable, values 1 if price at
upstream level moves down ( in
t
evaluated by F test standard.
That equation describes the Granger Causality test, which proves that the price movement in upstream level is as a price driver for price movements in downstream level. In this research, the application of that equation faces obstacle in which the researchers find difficulty in obtaining the data over time (time series) and only collect the cross section data with one data series. Therefore, this research applies the Granger Causality method that is operated to the cross section data (Bank Indonesia, 2011). The results of this causality test can be used to detect the most dominant influence in the price formation (Bank Indonesia, 2008).
On the Granger test, the regression equation is used to test whether variable X1
has more effect on changes in variation of X2
(X1X2) or vice versa, X2 has more effect on
changes in variation of X1 (X1X2). Granger
test assumes (Gujarati, 2009): (1) all information is relevant for predicting objective variable, (2) the error term in the causal relationships among variables is not correlated with the variables studied, (3) each variable studied is stationary, (4) because of its causality testing, the
coefficient estimation result is not
important, (5) F-test is needed to determine the effects of causality. The significant F-test
results on X1X2 is interpreted that X1 effect
on X2 significantly.
Granger Causality is applied in the cross section case by comparing the value of the F-test of four equations, which is noted as follows:
Ptt = ƒ(Pdb, Pdc) F1 price domination at
breeder level...(7)
Pdb = ƒ(Ptt, Pdc) F2 price domination at
wholesaler level...(8)
Pdc = ƒ(Ptt, Pdb) F3 price domination at
retailer level...(9) In which Ptt is the price at the breeder level, Pdb is the price at the wholesaler level, and Pdc is the price at the retailer level. The
equation with the highest F statistic indicates that the price domination at the sub-producer level is the greatest. Obviously, the process of price formation on four equations can be presented in Figure 1.
Figure 1. F-test with Granger Causality for APT Analysis
RESULTS AND DISCUSSION
Laying and broiler chicken livestocks make important contributions to the economy of Banyumas. In this regency, there are centers of poultry which products can fulfill the demand of the local needs, even selling out of Banyumas. For purebred chicken egg production, Baturaden is the main district of commodity producer with
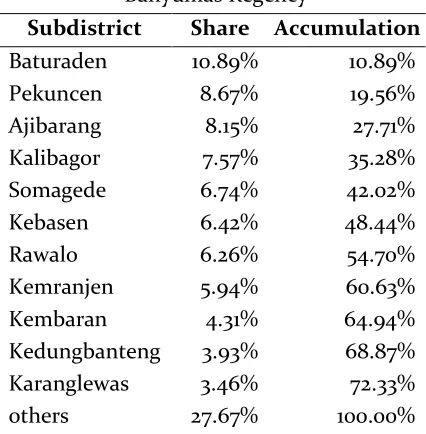
annual production of more than 62 thousand kilograms. Table 1 presents the main districts as the egg producers in Banyumas Regency.
Compared to the surrounding
regencies, such as Purbalingga, Cilacap, and Banjarnegara, the production of eggs in Banyumas is relatively higher. Two regencies, Banjarnegara and Cilacap, have deficit of eggs production, in terms of not being able to produce the eggs sufficiently for the domestic consumption.
Table 1. Eggs Production Shares in Banyumas Regency
Subdistrict Share Accumulation
Baturaden 10.89% 10.89%
Pekuncen 8.67% 19.56%
Ajibarang 8.15% 27.71%
Kalibagor 7.57% 35.28%
Somagede 6.74% 42.02%
Kebasen 6.42% 48.44%
Rawalo 6.26% 54.70%
Kemranjen 5.94% 60.63%
Kembaran 4.31% 64.94%
Kedungbanteng 3.93% 68.87%
Karanglewas 3.46% 72.33%
others 27.67% 100.00%
Source: Banyumas Statistics, 2014
Cilacap has deficit as much as 8,792,802 eggs. It is reasonable because the consumption of eggs in Cilacap reached 10,371,330 eggs while its production is only 1,578,528 eggs. Egg deficit is experienced by Banjarnegara amounted 3,689,408 eggs.
Based on Table 2, it can be seen that Cilacap and Banjarnegara have egg deficit while Banyumas and Purbalingga have the opposite conditions. With the production of 14,052,006 eggs and the consumption of 9,973,508 eggs, Banyumas has a surplus of 4,078,498 eggs.
Breeder
Wholesaler
Retailer
Consumer
P1=price due to transaction 1
P2=price due to transaction 2
P3= price due to transaction 3
Table 2. Production and Consumption of Eggs in Four Regency in Banyumas Area,
2014
Regency Production
(pcs)
Consumption (pcs)
Banyumas 14,052,006 9,973,508
Purbalingga 6,528,844 5,471,333
Cilacap 1,578,528 10,371,330
Banjarnegar
a 1,823,593 5,513,001
Regency Difference Information
Banyumas 4,078,498 Surplus
Purbalingga 1,057,511 Surplus
Cilacap -8,792,802 Deficit
Banjarnegar
a -3,689,408 Deficit
Source: Central Java in Report, 2015
In the same condition, Purbalingga has a surplus of 1,057,511 eggs, the production is 6,528,844 eggs and the consumption is 5,471,333 eggs. However, the surplus in Banyumas and Purbalingga cannot fulfill the deficits occured in Cilacap and Banjarnegara Regencies.
Moving Pattern of Purebred Chicken Egg Price
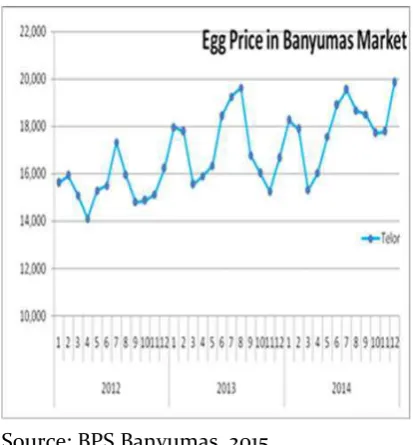
By using the monthly data in range of 2012-2014, the egg price is shown as positive trend. The egg price in end of 2014 tends to be similar among the regions in range of Rp 19,500.00. Referring to the statistical behavior trend of egg price in Banyumas, the average egg price in Banyumas during 2012-2014 is Rp 16,868.00 with the increase in the average price per month is Rp118.00, or the increase of 0.75%. Meanwhile, based on the calculation of the Consumer Price Index, it moves up by 0.41 or the increase of 0.42% in average per month. Figure 2 below presents the movements of the egg price (in rupiah).
Source: BPS Banyumas, 2015
Figure 2. Egg Price Movements in Banyumas District, 2012 – 2014 (Rupiah)
The egg price, which shows a positive trend, has a seasonal pattern detected from the price changes that tend to be static in every same month among three years. By using the approach of seasonal index, the prices show the highest level in July and August, and in December and January. On the other hand, the prices tend to be the lowest every year in March and April. Figure 3 presents the information of egg price movement pattern monthly in Banyumas Regency.
Source: Bank Indonesia Purwokerto, 2015
Figure 3. Seasional Pattern of Egg Price in
Banyumas Regency (Monthly, %).
The pattern of seasonal fluctuations for the egg price can be seen in January, April, May, June, July and December, which are the months with the higher prices than monthly average. Meanwhile, February, March, August, September, October, and November are the months with the lower prices than monthly average, during the period of 2012-2014.
The prices show the deflation trend in March with approximately 14% and the deflation is detected in September about 10%. Conversely, the prices show high value in June. All regions experience the same behavior where July is a month with the highest egg price. This highly price still remains in July but moves down gradually, or show the pattern of deflation in the months later. Then, the prices move up at the end of the year and early next year.
Characteristics of Laying Hen Breeders
In this research, the egg producers are the laying hen breeders spread in Banyumas Regency, especially Purwokerto and its surrounding area, such as Candi Negara Village (Pekuncen District) and Sikapat (Sumbang District). They have been operating this business for 5-15 years and the total hens in one last year are 2,700 to 20,000 heads. The breeders have the farm land and henhouse of 1,500 to 7,500 square meters.
As explained earlier that the
distribution channels of eggs is divided into two ways; first, directly sold to the retailers and then to the final consumers; second, sold to the wholesalers prior to the retailers. The first distribution channel is found in many traditional markets in Banyumas Regency while the second one is often found in several markets in Ajibarang Regency. The breeders mostly choose to sell the eggs to the wholesalers because of the certainty of price,
profit, and time of purchase/retrieval. However, some also sell the eggs by combining in percentage of eggs that are sold to the wholesalers and sold to the retailers, even being sold directly to the final consumers.
In order to raise the added value of sale, the breeders apply several attempts. The majorities of them do the cleaning cages (50
percents) and check the hens’ healthy
regularly (50 percents). Some of them also do the packaging (25 percents) and service the delivery (25 percents) (see Figure 4).
Figure 4. Attempting Added Value of Egg Sales
The eggs sold to the buyers (wholesalers and retailers) are paid to the breeders in several ways. According to the survey, 75% of the wholesalers pay directly when buying while only about 50% of the retailers who pay directly. No traders take long time to pay off the debt because eggs are not durable (only two to three weeks) so the mobility of selling and purchasing is very high. Therefore, the method of payments is relatively short and easy (see Figure 5). In
distributing the eggs, the breeders
often the biggest obstacle (50% of respondents think so). It causes a delay in delivery while the eggs cannot stand too long. In this condition, the breeders usually send their eggs by using a boxcar. Other obstacle is the high transportation costs. As many as 25% of respondents said so. The increase in this cost can be caused by the price of fuel oil (BBM) even when the location is far (see Figure 6).
Figure 5. Payment Method of Egg Purchase
Figure 6. Obstacles of Egg Distribution
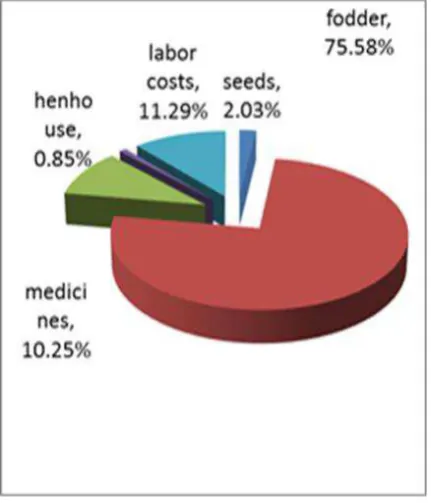
In the process of egg production, the breeders need some production factors such as seeds, fodder, medicines, cage/henhouse, and labor. The largest proportion of production costs are from the fodder purchase. The respondents on average say that fodder budget has the largest percentage, amounting to 75.58 percents. Then, the percentage of production costs respectively is labors (11.29%), medicines (10.25%), seeds (2.03%), and cages/henhouse (0.85%). The breeders buy the fodder and medicines from the distributor while the seeds come from the local and out of Banyumas (such as from Subang, West Java) (see Figure 7).
Figure 7. Egg Production Costs Composition
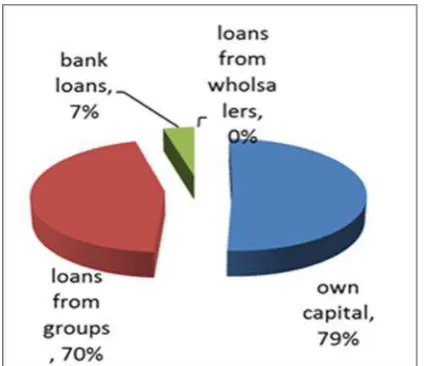
Figure 8. Capital Sources Percentages of Eggs Breeders
Characteristics of Purebred Chicken Egg Sellers
The egg sellers in Banyumas District can be differed on two types; the wholesaler or large-scale sellers and the retailer or little sellers. A part of the commodities is distributed directly to the wholesaler and the rest directly to the retailer. The wholesaler will offer to the retailer before the household or the final consumers receive the products, while the retailers that receive directly from the producer will sell directly to the final consumers.
The majority of egg retailers clarify that they prioritize to sell their commodity to the consumers in Banyumas area only. Some reasons are because their consumer will purchase in cash (72%), also the will receive the higher price level (22%). Only a few which reasons is the higher demand (6%) and the effective transportation cost (6%). Picture 9 shows the distribution of the seller opinions.
Picture 9. Reason of Egg Selling in Banyumas District
Related to the constraints, generally the respondents have no complaints. Only a few of them complain about the bad weather and the high cost of transportation. In cost of distribution perspective, most of 100% respondents extend that they face the transportation cost, and less for other cost like advertising and tax.
In financial capital formation aspect, the seller relatively can fulfil it. Of the respondents on research, 94% convey that their capital formation is fulfilled from their own properties and 6% come from the bank debt. To the bank debt, they pay in installments monthly.
The average on one day turnover of egg seller is Rp 577,433.00, maximum is Rp
2,080,000.00 and minimum is Rp
Table 3. Price and Quantity of Egg Selling
Indicators Average value Minimum
value
Maximum value Average of Purchase price in normal
condition (from breeder) (Rp)
12,412.50 11,500.00 14,000.00
Average of Purchase price in normal condition (from wholesaler) (Rp)
12,914.29 12,000.00 14,000.00
Mount of sales output in normal condition (kg)
157.28 6 1,000
Mount of sales output in more than normal condition(kg)
337.12 5 1,500
Average of purchasing price in normal condition (Rp)
12,412.50 11,500.00 14,000.00
In commodity distribution, the
distribution channel of eggs is starting from the egg producers (chicken breeders) that produce the purebred chicken eggs. The commodities will be marketed to the retailer and wholesaler, where the sellers will distribute the product mainly to the local consumers (Banyumas District). The sellers face some constraints to sell widely. The properties of commodities, which are naturally perishable, are the important obstacles. The commodity is holding out one to two weeks only after the chicken lay eggs. Some respondents extend the information that the unstable transportation cost has impeded their product distribution to
Purwokerto and Banyumas. The
unpredictable weather problem has caused the barrier in the distribution process of the commodities to various locations such as modern and traditional markets, stores, and small shops.
In normal condition, the average price of egg received by the wholesaler from the producer is Rp 12,412.50 per kg. Then, the commodities will give over to the retail seller on the average price of Rp 12,914.29 per kg. Averagely, the number of eggs sold by the
seller to the consumer is 158 kg daily in normal condition, and 337 kg in a full stock capacity (more than normal condition), even reaches 1,500 kg daily.
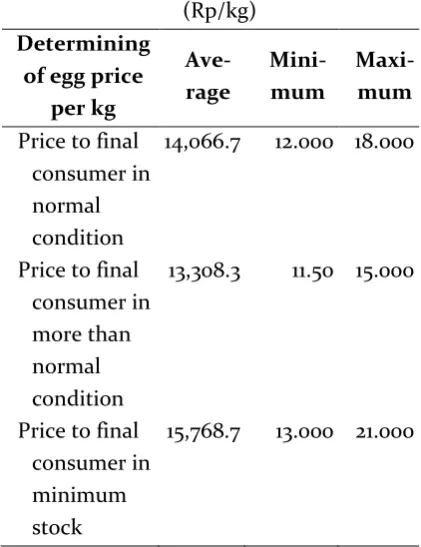
Table 4. Determining of Final Egg Price (Rp/kg)
Determining of egg price
per kg
Ave-rage
Mini-mum
Maxi-mum
Price to final consumer in normal condition
14,066.7 12.000 18.000
Price to final consumer in more than normal condition
13,308.3 11.50 15.000
Price to final consumer in minimum stock
15,768.7 13.000 21.000
capacity in market, the price will decrease in the range of Rp 11,750.00 to Rp 15,000.00/kg. Otherwise, in the few capacity condition in market, the price will reach to Rp 21,000.00/kg.
The producers (chicken breeder) have no ability to influence the price in egg market. They cannot influence it because of the capacity of egg in the market will follow the price mechanism and the competition among the sellers. The egg producer will follow the price and market mechanism to sell out their output.
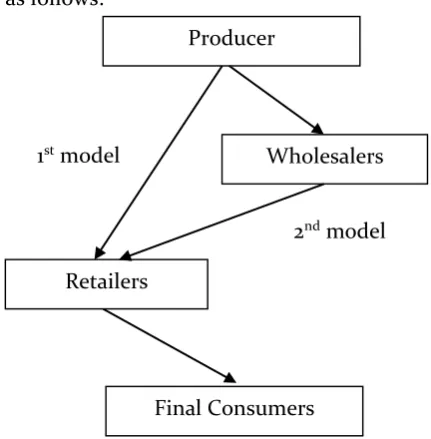
Analysis of Distribution Channel, Market Structure, and Egg Price Formation Transmission
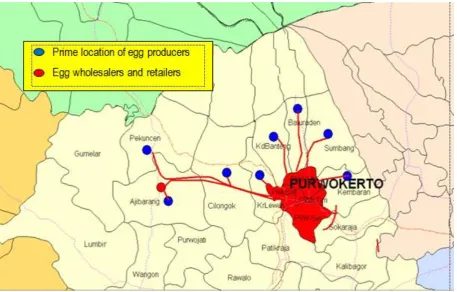
The type of distribution channel of the eggs includes two models. First, the commodity will be distributed by the producer directly to the retailer, and the retailer will distribute it to the final consumer. The model distribution can be seen in the traditional market, such as Pasar Wage, Pasar Manis and around. Second, the producer will market it to the wholesaler, then the wholesaler will sell it to the retailer, and the retailer will sell it out to the final consumers. The last model will be seen in Pasar Ajibarang and around. Figure 10 presents the illustration.The egg producers are spread in several locations in Purwokerto such as North Purwokerto, Sumbang, Pekuncen, and Karang Lewas. Then the eggs will be distributed through the wholesaler and the retailer that are located in Purwokerto City and its surroundings and then enter the traditional market especially in Pasar Wage, Pasar Manis, Pasar Karang Lewas, and Pasar Ajibarang and the rest to modern market. The final consumer will buy
the product to the egg retailer that place in the traditional market also. Figure 11 shows as follows:
Figure 10. Distribution Channel of the Egg in Banyumas District
How the formation of the channel distribution depends on the market structure as indicator to determine the level of business competition among the producers. Based on the market structure analyses including the determination of market concentration (HI and CR) and the barrier to market entry (MES), it is obtained some research finding quantitatively. The value of HI is 0.1079, CR4 is 0.1784 and CR8 is 0.2487. All the result measurements show that the market of eggs in Banyumas Regency is categorized as the unconcentrated market or the low level of market concentration.
The value of HI shows the spreading of market powers among the egg sellers, in which every seller has 10% market power approximately. Therefore, among the sellers there is no significant difference on the size of business and selling turnover. It is supported by the value of CR4.
Producer
Retailers
Wholesalers
Final Consumers 1st model
Figure 11. Map of Distribution Channel of Purebred Chicken Egg in Banyumas District
The value of 0.1784 means the total value of the four largest sellers contributing to the market amounted 17.84% calculated from total market selling. The value of CR8
shows that eight largest sellers contribute to the market of 24.87% only. The industry with the eight largest enterprises that control the market power less than 33% is categorical as the unconcentrated industry (Keysan & Turner, in Kuncoro, 2007:142).
The value of MES = 0.0706 shows that the barrier to entry to the egg market is lower than 10%. It means that the mobility of every egg seller to enter and exit from the market is relatively high. There is no significant barrier to the entrant to open his business without the influencing competitor power of the other ones. Table 5 shows the output of calculation.
Based on the statistic description, it can be concluded that the industry (market) of purebred chicken eggs is a perfect competition market.
Table 5. Main indicators of Market Structure in Egg Commodity
Market
Structure Indicator Value
Concentration HI 0.1079
CR4 0.1784
CR8 0.2487
Barrier to Entry MES 0.0706
Source : Primary data processing
The main characteristic of the market is an unconcentrated market to the power of one or little sellers and the low level in barrier to entry.
power in the price transmission mechanism but every seller will take the proper profit margin.
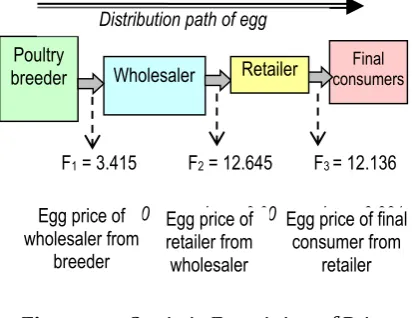
On Asymmetric Price Transmission
(APT) analyses, the main driver of price mechanism is the price transaction between the wholesaler and the retailers. It means that the transaction will determine the final price and the price will be followed by the next stage of channel distribution.
On the figure 12. The biggest F-value is showed by 12.645 in the equation calculated. The value is related to the influence of the price between the retailers – wholesaler that shaped the pattern of the final price. In other words, the egg price formation on the stage will determine the egg price mechanism. Because the egg market structure is a perfect competition, there is no dominant agent in the market, even the domination of the wholesaler to the retailer in the price creating.
Figure 12. Statistic Examining of Price Transmission in Distribution Channel of
Purebred Chicken Egg
The research result finding that there is no difference of market power from the producer to final consumer on the egg price is different from the other research finding. It refers to Asogwa and Okwoche (2012) in the case of sorghum trading in Nigeria that placed the final consumers as the price taker.
The seller, wholesaler and retailer, have significant effect on gaining the trading margin. The wealth of the sellers is created by every business activity in each stage. It is different from the finding of Magesa et al (2014) who detected the weakness of the egg producer on the market transaction.
Other research that is similar to this research is the finding of Summer et al (2010). He found that the egg consumption in United State has no powerful respond to the egg price changing. The increasing of egg price of 40% will decrease 10% of the egg
consumption. In United State, the
consumers consider that egg is a source of animal production. Therefore, the egg price mechanism could be supposed to have the important effect to the low income household.
CONCLUSION
This research aims to analyse the distribution channel, market structure, and
the mechanism of price formation
transmission on the purebred chicken eggs in Banyumas Regency. Based on the data analytical result, it can be concluded that the distribution channels of the egg selling can final consumer. Related to the distribution channel, the market structure formed in the market commodity is a perfect competition market. It is a market in which there is no dominant power between the whole producers (breeder or seller), especially on the egg price mechanism. It means that every agent of the market (breeder and seller) has the important role in the distribution channel. Each level of the transaction will
Poultry breeder
(Ayam
Wholesaler consumers Final
reach the price agreement that impact to the
price changing significantly to final
consumer. However, the role of the market driver keeps important. It is the role of transaction between the grocery and retailer level, which is the most important to determine the price of the commodity.
Some policies to support the
stabilization the egg price in Banyumas Regency are needed. First, the market of purebred chicken eggs in Banyumas Regency tends to follow the market clearing model (perfect competition market). That is why some public policies to cut off the distribution channel can be applied. One of the policies is to create the market operation by selling the eggs under the market price directly to the retailers and the final consumers. The expectation is to prevent the market failure. Therefore, the increasing of eggs stock from outside Banyumas area will be required in the emergency condition, for example, when the supply of eggs in the market is in the critical condition, this may impact to the increasing of the price quickly.
Besides, the local government, the
Department of Farming, the Department of Industry, Trading and Cooperatives need to control the price in order to prevent the breeder from the loss if the price declines. This is appropriate to the research of Paranata and Umam (2015) who recommend that the government should control the price mechanism in order to prevent the loss of Regency tends to change, which is caused by the changing of commodity supply in the breeder level. To reduce the egg price, the government needs to support the breeders to
increase their productivity. It can be strived by making the availability of purebred chicken seeds, which are superior and endure on the climate changing.
This research finding is also similar to
Kristiansen’s (2003) research, which detected
that the barrier factor to entry on the animal feed market of laying hen is still one of the constraints of the production of purebred chicken eggs in Indonesia. The government needs to give dissemination of information and knowledge of the rule of egg chicken
commerce and broaden lthe ocal
government service to participate on providing the extra amount of the local production.
Otherwise, although the market structure is placed on the high concentration of theegg seller, the egg price tends to increase every year. The price is fluctuating appropriate to the inflation rate and identified following the seasonal factor. The price tends to deflate in March and September. Otherwise, the price will jump to increase in the high price level in June. It reflects that the behavior of public consumption, in same manner as the broiler chicken consumption, is supposed to give the important impact on the fluctuation of the egg price in the market.
society, the government should maintain the stock on market, also increase and keep the quantity and quality of the commodity. The related official institutions need to minimize the spreading of the chicken endemic locally and inter regionally
REFERENCES
Ahmad, A.A., A. Arifin dan R Priyono. (2011). Pemetaan Distribusi Komoditas Laporan Hasil Penelitian Penyumbang Inflasi Terbesar di Jawa Tengan dan DIY (Studi Kasus di Purwokerto). Laporan Hasil Penelitian. Kerjasama Kantor Bank Indonesia Purwokerto dengan Fakultas Ekonomi UNSOED.
Asogwa, B.C., and V. A. Okwoche. (2012). Marketing of Agricultural Produce among Rural Farm Households in Nigeria: The Case of Sorghum Marketing in Benue State. International Journal of Business and Social Science, 3 (13), July 2012.
Babula, R.A. and D.A. Bessler, (1990). The Corn-Egg Price Transmission Mechanism, Southern Journal of Agriciltural Economics, December 1990
Badan Pusat Statistik. (2013). Banyumas dalam Angka 2013. Badan Pusat Statistik.
Bank Indonesia. (2008). Outlook Ekonomi Indonesia 2008-2013: Organisasi Industri dan Pembentukan Harga di Tingkat Produsen. Juli 2008. Bank Indonesia.
______. (2011). Pemetaan Struktur Pasar dan Pola Distribusi Komoditas Strategis Penyumbang Inflasi di Wilayah KBI Purwokerto serta
Implika’sinya terhadap Kebijakan
Pengendalian Harga Komoditas. Laporan Hasil Penelitian. Kerjasama Kantor Bank Indonesia Purwokerto dengan Fakultas Ekonomi UNSOED.
______. (2015). Kajian Penguatan Kerja sama Antar Daerah Eks Karesidenan Banyumas – 2015. Laporan Hasil Penelitian. Kerjasama Kantor Bank Indonesia Purwokerto dengan Fakultas Ekonomi dan Bisnis UNSOED.
Bor, Ö., M. Ismihan, A. Bayaner. (2014). Asymmetry in farm-retail price transmission in the Turkish fluid milk market, NEW MEDIT N. 2/2014 Fuentes-Pila, J., C. Rodríguez-Monroy, R. Antelo, J.
Torrubiano, and L. Roldán. (2007). Designing Food Supply Chains: An Application of Lean Manufacturing and Lean Supply Chain
Paradigms to the Spanish Egg Industry. Paper prepared for presentation at the 1st International European Forum on Innovation and System Dynamics in Food Networks Officially endorsed by the European Association of Agricultural Economists (EAAE), Innsbruck-Igls, Austria February 15-17, 2007.
Gujarati, D.N. and D.C. Porter. (2009). Basic Econometrics, fifth edition. New York: McGraw-Hill Companies, Inc.
Kristiansen, S, (2003), Information Asymmetry and Economic Concentration: The Case of Hens and Eggs in Eastern Indonesia, ESA Working Paper No. 03-21, December 2003, Agricultural and Development Economics Division, The Food and Agriculture Organization of the United Nations
Kuncoro, M. (2007). Ekonomika Industri Indonesia, Menuju Negara Industri Baru 2030?. Yogyakarta: Penerbit ANDI.
Magesa, M.M., K. Michael, and J. Ko. (2014). Access to Agricultural Market Information by Rural Farmers in Tanzania. International Journal of Information and Communication Technology Research, 4(7), July 2014
Martin, S. (1994). Industrial Economics, Economic Analysis and Public Policy, 2nd edition. New
York: Macmillan Publishing Company. Memon I.N., Noonari S., Asif M., Shah S.T., Peerzado
M.B., Panhwar G.M., Sethar A.A., Kalwar G.Y., Bhatti M.A., Jamro A.S, (2015). Economic Analysis of Poultry Egg Production in Quetta District Balochistan, Journal of Fisheries & Livestock Production, Vol.3, Issues 3
Muhammed, A.B., S.A. Mohammed, A.F A.F Ayanlere and O.K Afolabi. (2013). Evaluation of Poultry Egg Marketing in Kuje Area Council Municipality of F.C.T Abuja, Nigeria. Greener Journal of Agricultural Sciences, 3 (1), 068-072, January 2013.
Nicholson, W, and C. Snyder. (2012). Microeconomic Theory: Basic Principles and Extentions, 11th edition. South-Western. Cengange Learning. United States.
Otto, D, M. Ibarburu, L. Schutz. (2013). Economic Importance of the Iowa Egg Industry, Iowa State University
Peltzman, S. (2000). Prices Rise Faster than they fall. Journal of Political Economy, 108(3), 466-502. Porter, M.E. (1990). The Competitive Advantage of
Nations. The Free Press. New York: A Division of Macmillan, Inc.
Paranata, A. & Umam, A.T. 2015. Pengaruh Harga Bawang Merah terhadap Produksi Bawang Merah di Jawa Tengah. JEJAK Journal of Economics and Policy, 8(1), 30-37.
Pritchard, NT, (1969). A Framework for Analysis of Agricultural Marketing System in Developing Countries, Agricultural Economics Research, Vol.21, No.3, July 1969
Rudiyanto, Achmad Afif. Pola Kemitraan Koperasi Sejahtera Abadi Dalam Meningkatkan Keuntungan Petani Cabai. JEJAK: Jurnal Ekonomi dan Kebijakan, [S.l.], v. 7, n. 2, sep. 2014. ISSN 2460-5123.
Samuelson, P. A., & Nordhaus, W. D. (2005). Economics, 18th edition. New York: The
McGraw-Hill Companies.
Scherer, F.M. 1996. Industry Structure, Strategy, and Public Policy. New York: Harper Collins College Publishers.
Sumner, D. A., H. Gow, D. Hayes, W. Matthews, B. Norwood, J. T. Rosen-Molina, and W. Thurman, (2010). Economic and market issues on the sustainability of egg production in the United States: Analysis of alternative production systems, Emerging Issues: Social Sustainability of Egg Production Symposium, the Poultry Science Association, American Society of Animal Science, and American Dairy Science Association in Denver, Colorado, July 11–15, 2010
Tweeten, L.G. and C.L. Quance. (1969). Positivistic Measures of aggregate Supply Elasticities: Some new Approaches. American Journal of Agricultural Economics, Vol. 51, 342-352. Vavra, P., and B. K. Goodwin. (2005). Analysis of Price
Transmission Along the Food Chain. OECD Food, Agriculture and Fisheries Working Papers, No. 3, 2005. OECD Publishing. Wiedemann, S.G., and E.J. McGahan. (2011).
Environmental Assessment of an Egg Production Supply Chain using Life
Appendix A. Egg Price
Period Egg Price (IDR) Price Changing (%)* Seasonal
factor*
2012 January 15,610 10.1826 8.9477
February 15,921 1.9923 -1.9207
March 15,092 -5.2070 -12.9590
April 14,100 -6.5730 0.2123
May 15,292 8.4539 5.4358
June 15,492 1.3079 7.2455
Jule 17,323 11.8190 5.3191
August 15,958 -7.8797 -4.4094
September 14,804 -7.2315 -9.9404
October 14,860 0.3783 -3.4428
November 15,125 1.7833 -2.2550
December 16,213 7.1934 7.7669
2013 January 17,960 10.7753 8.9477
February 17,779 -1.0078 -1.9207
March 15,542 -12.5823 -12.9590
April 15,893 2.2584 0.2123
May 16,333 2.7685 5.4358
June 18,417 12.7594 7.2455
Jule 19,253 4.5393 5.3191
August 19,625 1.9322 -4,4094
September 16,783 -14.4815 -9.9404
October 16,022 -4.5344 -3.4428
November 15,250 -4.8184 -2.2550
December 16,653 9.2000 7.7669
2014 January 18,250 9.5899 8.9477
February 17,875 -2.0548 -1.9207
March 15,313 -14.3329 -12.9590
April 16,033 4.7019 0.2123
May 17,563 9.5428 5.4358
June 18,896 7.5898 7.2455
Jule 19,533 3.3711 5.3191
August 18,667 -4.4335 -4.4094
September 18,500 -0.8946 -9.9404
October 17,708 -4.2811 -3.4428
November 17,771 0.3558 -2.2550
December 19,850 11.6988 7.7669
Source: BPS Banyumas District,
Appendix B. Output Regression
ANOVAb
Model Sum of
Squares
df Mean
Square
F P-Value
1 Regression 1638021 2 819010.4 3.41488144 0.05995381
Residual 3597535 15 239835.7
Total 5235556 17
a. Predictors: (Constant), HK, HPK b. Dependent Variable: HPB
ANOVAb
Model Sum of
Squares
df Mean
Square
F P-Value
1 Regression 6879971 2 3439986.0 12.6488541 0.00060406
Residual 4079404 15 271960.3
Total 10959375 17
a. Predictors: (Constant), HK, HPB b. Dependent Variable: HPK
ANOVAb
Model Sum of
Squares
df Mean
Square
F P-Value
1 Regression 7856177 2 3928089.0 12.1360352 0.00073292
Residual 4855073 15 323671.5
Total 12711250 17
a. Predictors: (Constant), HPK, HPB b. Dependent Variable: HK
No Transmision
F-Value P-Value
1 Egg price of grocer and retailer level > Egg price of
farmer level 3.415 0.060
2 Egg price of farmer and retailer level > Price of
grocer level 12.645 0.000
3 Price of farmer and grocer level > Price of retailer
Appendix C. Price and Quantities of Egg Purchasing by Retailers
Indicators Measure Average Minimum Maximum
Average purchasing price normally (from breeders)
Rp 12.412,50 11.500,00 14.000,00
Average purchasing price normally (from wholesalers)
Rp 12.914,29 12.000,00 14.000,00
Commodity Quantities normally Kg 157,28 6 1000
Commodity Quantities excessively Kg 337,12 5 1500
Appendix D. Price Decision of Egg Retailers (Rp/kg)
Commodity Price per kg Average Minimum Maximum
Price to final consumers normally 14.066,67 12.000 18.000
Price to final consumers excessively 13.308,33 11750 15.000