© The Author 2014. Published by Oxford University Press on behalf of the American Association for Public Opinion Research. All rights reserved. For permissions, please e-mail: [email protected]
AccurAcy of Vote expectAtion SurVeyS in
forecASting electionS
AndreAs GrAefe*
Abstract simple surveys that ask people who they expect to win are among the most accurate methods for forecasting Us presidential elec-tions. The majority of respondents correctly predicted the election win-ner in 193 (89 percent) of 217 surveys conducted from 1932 to 2012. Across the last 100 days prior to the seven elections from 1988 to 2012, vote expectation surveys provided more accurate forecasts of election winners and vote shares than four established methods (vote intention polls, prediction markets, quantitative models, and expert judgment). Gains in accuracy were particularly large compared to polls. On aver-age, the error of expectation-based vote-share forecasts was 51 percent lower than the error of polls published the same day. Compared to pre-diction markets, vote expectation forecasts reduced the error on aver-age by 6 percent. Vote expectation surveys are inexpensive and easy to conduct, and the results are easy to understand. They provide accurate and stable forecasts and thus make it difficult to frame elections as horse races. Vote expectation surveys should be more strongly utilized in the coverage of election campaigns.
“Who do you think will win the Us presidential election?” Pollsters have regularly asked variations of this question since the 1940s. Yet little is known
about the relative accuracy of such vote expectation surveys compared to
alternative methods for forecasting elections. Although researchers have long
Andreas Graefe is a research fellow at the department of Communication science and Media research at LMU Munich, Munich, Germany. J. scott Armstrong, Alfred Cuzán, Michael Lewis-Beck, Andreas Murr, and Christopher Wlezien provided helpful comments. The author also received valuable suggestions when presenting the manuscript at the 2013 Annual Conference of the International Communication Association in London, the 2013 International symposium on forecasting in seoul, and the 2013 American Political science Association Annual Meeting in Chicago. Bettina Zerwes helped with collecting data. Jamie Graefe and nancy elfant did edito-rial work. This work was supported by an LMUexcellent research fellowship from the Center for Advanced studies at LMU Munich. *Address correspondence to Andreas Graefe, LMU Munich, department of Communication science and Media research, Oettingenstr. 67, 80538 München, Germany; e-mail: [email protected].
Public Opinion Quarterly, Vol. 78, special Issue, 2014, pp. 204–232
doi:10.1093/poq/nfu008
at Jordan University of Science and Technology on July 26, 2016
http://poq.oxfordjournals.org/
demonstrated that responses to the vote expectation question, also known as citizen forecasts, provide accurate predictions of election outcomes (Lewis-Beck and skalaban 1989; Lewis-Beck and Tien 1999; Lewis-Beck and stegmaier 2011; Murr 2011), few studies compare their accuracy to estab-lished benchmarks.
The present study compares the accuracy of vote expectation surveys for forecasting Us presidential elections to predictions from four established methods: expert judgment, traditional polls, prediction markets, and quantita-tive models.
established Methods for forecasting uS presidential
elections
As long as there have been elections, people have tried to predict their results. Currently, the most common methods for election forecasting are expert judg-ment, polls, prediction markets, and quantitative models.
exPerT JUdGMenT
Judgment of political insiders and experienced election observers was used to forecast elections long before the emergence of scientific polling (Kernell 2000), and it still is. The common assumption is that experts have experi-ence in reading and interpreting polls, assessing their significance during cam-paigns, and estimating the effects of recent or expected events on the aggregate vote. Given their omnipresence, surprisingly little is known about the relative accuracy of experts’ election forecasts.
One study found that experts, in this case politicians, provided more accu-rate predictions of the outcomes of two controversial ballot measures than voters who had just left the voting booths (Lemert 1986). Another study com-pared the accuracy of experts (political scientists, journalists, and editors) and non-experts in predicting vote shares in the 2006 swedish parliamentary election. At the individual level, the experts provided more accurate forecasts than the non-experts. Interestingly, however, the results were reversed when calculating average (and median) forecasts within each group: The combined forecasts from the non-experts were more accurate than the combined fore-casts from the experts (sjöberg 2009).
POLLs
Traditional polls ask respondents for whom they intend to vote if the election
were held today. That is, polls do not provide predictions; they provide snap-shots of public opinion at a certain point in time. However, this is not how the media commonly treat polls. Polling results are routinely interpreted as fore-casts of what will happen on election day. This can result in poor predictions,
at Jordan University of Science and Technology on July 26, 2016
http://poq.oxfordjournals.org/
in particular if the election is still far away, because public opinion can be dif-ficult to measure and fragile over the course of a campaign (Campbell 1996). However, researchers have found ways to deal with these problems and to increase the accuracy of poll-based predictions by combining polls and pro-jecting the results to election day.
Combining polls to reduce measurement error: There is often high variance in the results of polls by different survey organizations, even if these polls were conducted at around the same time. such variance can be caused by sampling problems, nonresponses, and faulty processing (erikson and Wlezien 1999). Therefore, one should not look at the results from only a single poll. rather, one should combine polls that were conducted around the same time, since the systematic (and random) errors that are associated with individual polls tend to cancel out in the aggregate (Graefe et al. 2014). Combining has had a positive impact on how people nowadays consume polls, and online polling aggregators such as realclearpolitics.com and pollster.com have become increasingly popular.
Projecting poll results to Election Day: Polls conducted by the same survey organization, and by the polling industry as a whole, can fluctuate widely across the course of a campaign. The reason is that a large share of the electorate has not spent much time thinking about the important issues and the candidates’ positions if the election is still far away. As a result, people’s response behavior in early polls is influenced by campaign events such as conventions (Campbell, Cherry, and Wink 1992) and debates (Benoit, Hansen, and Verser 2003).
However, such events have a limited effect on the outcome of high-visibil-ity races like Us presidential elections. As the election nears, people are less influenced by the latest campaign events and have formed stable vote inten-tions based on a combination of information gleaned during the campaign— the state of the economy, for example—and their own basic predispositions, such as ideology and party identification (Gelman and King 1993). Therefore, it is not until shortly before election day that polls provide accurate forecasts.
researchers have, though, found ways to utilize early polls for use in
fore-casting by calculating poll projections, as they are termed hereafter. Poll
pro-jections take into account the historical record of polls in order to make a forecast. for example, assume that the incumbent leads the polls by 15 points in August. In analyzing historical polls conducted around the same time along with the respective election outcomes, one can derive a formula for translating August polling figures into an estimate of the incumbent’s final vote share in november. This is commonly done by regressing the incumbent’s share of the vote on his polling results during certain time periods before the election. Prior research found that such poll projections are much more accurate than treating raw polls as forecasts (e.g., erikson and Wlezien 2008; Campbell 1996).
Graefe 206
at Jordan University of Science and Technology on July 26, 2016
http://poq.oxfordjournals.org/
Calculating combined poll projections: One can also combine both strategies (i.e., combining polls and calculating poll projections) to generate poll-based forecasts. One study first calculated rolling averages of all polls that were published in a one-week period and then used these results to calculate poll projections. This procedure resulted in large gains in accuracy. Across the last 100 days prior to each
of the six elections from 1992 to 2012, the error of such combined poll projections
was 39 percent lower than the error of a randomly picked poll (Graefe et al. 2014).
PredICTIOn MArKeTs
Prediction (or betting) markets allow people to bet on the election outcome. The resulting betting odds can then be interpreted as forecasts. such markets were already popular in the late nineteenth and early twentieth centuries, when
newspa-pers such as the New York Times regularly reported the latest predictions. However,
around the time of World War II, prediction markets began to disappear, likely due to a combination of factors such as the rise of the polling industry in the 1930s, the introduction of laws to eliminate organized election betting, and the emergence of alternative betting opportunities such as horseracing (rhode and strumpf 2004). It took almost half a century, and the rise of the Internet, for the method to be redis-covered. In 1988, researchers at the University of Iowa launched the online Iowa electronic Markets (IeM) to predict the Us presidential elections held in the same year. since then, interest in prediction markets has resurged.
studies of prediction market accuracy for election forecasting commonly compare the daily market forecasts to results from polls published the same day. These studies generally find that prediction markets yield more accurate forecasts than single polls. for example, Berg, nelson, and rietz (2008) com-pared the accuracy of IeM forecasts to results from 964 polls across the five Us presidential elections from 1988 to 2004. The IeM forecasts were more accurate than single polls 74 percent of the time. However, as outlined above, single polls provide poor predictions and thus serve as only a weak bench-mark. erikson and Wlezien (2008) accounted for this problem and compared the IeM forecasts to poll projections, using the same data and time period as that analyzed by Berg, nelson, and rietz (2008); they found that poll projec-tions were more accurate than the IeM. I extended these analyses and
com-pared the IeM forecasts to combined poll projections, using the approach
suggested by Graefe et al. (2014). Across the last 100 days prior to each of the seven elections from 1988 to 2012, the IeM forecasts yielded an average error of 1.7 percentage points, which is 17 percent below the corresponding error of combined poll projections of 2.0 percentage points (cf. table 3).
QUAnTITATIVe MOdeLs
A popular theory of electoral behavior is that an election is a referendum on the incumbent’s performance. That is, voters are expected to reward the
at Jordan University of Science and Technology on July 26, 2016
http://poq.oxfordjournals.org/
government for good performance and punish the incumbent party otherwise. since the late 1970s, economists and political scientists have tested this theory by developing quantitative models to predict election results. Most models are based on multiple regression analysis of two to five predictor variables, which typically capture economic conditions, the incumbent’s popularity, and how long the president (or his party) has controlled the White House. The develop-ment and testing of these models has become an established subdiscipline of political science, and the models’ forecasts are regularly published about two
months prior to election day in scientific journals.1
These models predict the correct election winner most of the time. Across the six elections from 1992 to 2012, 34 of 39 forecasts of seven well-known models correctly predicted the winner. However, the models’ performance in predicting vote shares is mixed. Their mean absolute error (MAe) was 3 per-centage points, and ranged from 0 to 10 points (cf. appendix 1).
Vote expectation Surveys
Why not simply ask voters whom they expect to win and then use the
aggre-gate result as forecast? A common concern with using expectations as fore-casts is that people’s expectations are influenced by their preferences. In the case of elections, this means that people tend to predict their preferred
candi-date to win. This bias, which is known as wishful thinking, is long known to be
common in the context of elections. Hayes (1936) reported results from a 1932 preelection survey of an unrepresentative sample of 8,419 men and women and found that 72 percent of Hoover supporters predicted Hoover to win, whereas 91 percent of roosevelt supporters predicted roosevelt to win; roosevelt won by a landslide. In their seminal study of voting behavior, Lazarsfeld, Berelson, and Gaudet (1948) reported a strong relationship between people’s vote inten-tions and their expectainten-tions of who will win. Granberg and Brent (1983) stud-ied wishful thinking across the eight Us presidential elections from 1952 to 1980. Their analysis revealed a strong positive relationship between
expecta-tions and candidate preferences (r = .8). since these early studies, evidence
has accumulated. Wishful thinking occurs in all types of elections, from local referenda to national elections, and across various countries. see Miller et al. (2012) for an overview of recent research.
But, although people are subject to wishful thinking, most of them can still correctly predict the outcome of elections. In their pioneering study of citi-zen forecasts, Lewis-Beck and skalaban (1989) found that, across the eight Us presidential elections from 1956 to 1984, 69 percent of respondents to
1. since the 1992 election, forecasts from established models have been published in special sym-posiums in Political Methodologist 5(2), American Politics Research 24(4), and PS: Political Science and Politics 34(1), 37(4), 41(4), and 45(4).
Graefe 208
at Jordan University of Science and Technology on July 26, 2016
http://poq.oxfordjournals.org/
the Anes vote expectation question correctly predicted the election winner. I updated their results by analyzing data from all Anes preelection surveys for the 16 elections from 1952 to 2012. I found that, on average, 70 percent of 30,573 respondents correctly predicted the election winner. In addition, I ana-lyzed the accuracy of predictions of which candidate would win the election in
the respondent’s state.2 for this task, 69 percent of 23,301 responses predicted
the correct winner.3 Others obtained similar results for multiparty elections in
the UK. Across 13 elections conducted between 1951 and 2005, 60 percent of survey respondents correctly predicted which party would win the governing majority of seats (Lewis-Beck and stegmaier 2011). Another study analyzed data from the 2010 British election study Internet survey, in which respond-ents were asked to predict which party would win the election in their local constituency. Of the 13,334 respondents who provided a valid answer to the expectation question, 69 percent correctly predicted the winner (Murr 2011).
see table 1 for an overview of these results.4
The available evidence reveals that the chance for a typical respondent to correctly predict the election winner is usually above 50 percent, and thus more accurate than guessing. In other words, individuals are more likely to get the election winner right than wrong. Under such conditions, pooling the indi-vidual estimates into a group estimate will inevitably yield a correct decision. The mathematical proof for this relationship was provided in the eighteenth century by the Marquis de Condorcet and has become known as Condorcet’s Jury Theorem (Condorcet 1994[1785]). The theorem allows for calculating the probability that a given group of individuals will arrive at a correct deci-sion. for example, the pooled estimate of five individuals who are each cor-rect 60 percent of the time is expected to be corcor-rect 68 percent of the time. If the accuracy level of the five individuals is at 70 percent, the group estimate should get it right about 84 percent of the time. In general, given that individ-ual accuracy is better than chance, Condorcet’s Jury Theorem implies that the probability for a group to arrive at a correct decision rapidly increases toward 100 percent as the number of individual estimates increases.
Murr (2011) was the first to identify the powerful theoretical link between Condorcet’s Jury Theorem and the benefits of aggregating vote expectations.
2. In 11 of the 16 Anes surveys from 1952 to 2012, respondents were asked to predict the elec-tion winner in their state. The state-level queselec-tion was not asked prior to the four elecelec-tions from 1956 to 1968, nor was it asked prior to the 2000 election.
3. Analyses of the Anes surveys in the present article consider only responses that predicted one of the major two parties’ candidates to win.
4. The accuracy of individual vote expectations depends on the characteristics of the forecaster and the electoral context. In their micro-level analysis of citizen forecasts of the 11 Anes sur-veys from 1956 to 1996, Lewis-Beck and Tien (1999) showed that individuals with higher lev-els of education make more accurate predictions and that political involvement harms accuracy. furthermore, individual forecasts are less accurate for tight races and if the election is further away.
at Jordan University of Science and Technology on July 26, 2016
http://poq.oxfordjournals.org/
table 1. Accuracy of individual and pooled Vote expectations in British and uS elections
election British general elections Us presidential elections
source Murr (2011) Lewis-Beck and
stegmaier (2011)
Anes data, own calculations
Anes data, own calculations
number of elections 1 (in 2010) 13 (between 1951
and 2005)
16 (from 1952 to 2012)
11 (between 1952 and 2012)
Prediction task Predict election
winner in local constituency
Predict party that wins the governing
major-ity of seats
Predict national election winner
Predict election winner in respondent’s state
Individual expectations
no. of observations 13,334 n/A 30,573 23,301
% correct 69% 60% 70% 69%
Pooled expectations
no. of observations 627 13 16 399
Correct 537 10 13 329
% correct 86% 77% 81% 82%
Graef
e
210
In his study of the 2010 British election, the majority vote of respondents from the same constituency correctly predicted the winner in 537 (86 percent) of 627 constituencies. Thus, compared to the individual forecasts, which were correct 69 percent of the time, pooling estimates increased the likelihood of a correct forecast by 17 percentage points. Murr (2011) further analyzed the conditions under which pooling expectations is most beneficial. In general, the accuracy of aggregated expectations increases with the number of individual expectations and for races with large winning margins. In addition, aggregated vote expectations tended to be somewhat more accurate if variation in inter-view dates was higher.
Table 1 provides further evidence from other data sets on the gains from pooling expectations. for example, Lewis-Beck and stegmaier (2011) pro-vided similar results for forecasts of British election outcomes at the national level. While, on average, individuals were correct 60 percent of the time, the majority of vote expectations correctly predicted the election result in 10 of 13 elections, a hit rate of 77 percent. for Us presidential elections, I found that the aggregated responses to the Anes vote expectation question predicted the correct election winner in 13 of the 16 elections from 1952 to 2012, a hit rate of 81 percent. That is, compared to the average individual, who was correct 70 percent of the time, pooling estimates increased the chance of a correct fore-cast by 11 percentage points. At the state level, pooled expectations correctly predicted the winner in 329 (82 percent) of 399 state races. In comparison, the
average individual was correct 69 percent of the time.5
These results suggest that vote expectations are useful for election fore-casting. However, little is known about how accurate such vote expectation surveys are relative to other methods, as few studies compare their accuracy to established benchmarks.
VOTe exPeCTATIOn sUrVeYs VersUs POLLs
One exception is a study by rothschild and Wolfers (2012), who analyzed the relative accuracy of the vote expectation question and the vote intention
ques-tion when both are asked in the same survey. Based on an analysis of Anes
data from the 15 Us presidential elections from 1952 to 2008, the authors found that expectations were more accurate than intentions when predicting election winners, vote shares, and probabilities of victory.
5. As noted above for the case of combining polls, the phenomenon that aggregating individual estimates yields more accurate forecasts also holds for quantitative estimates. Hogarth (1978) showed analytically that combining judgments is most useful if individual judges possess diverse information. Adding more forecasts increases accuracy, although at a diminishing rate of improve-ment. The power of combining for generating accurate predictions is one of the major findings from forecasting research conducted since the 1970s, which impacted many fields, such as weather forecasting, economic forecasting, and political forecasting (Graefe et al. 2014).
at Jordan University of Science and Technology on July 26, 2016
http://poq.oxfordjournals.org/
A possible explanation for this result is that expectations capture more information than intentions. first, vote intention polls ignore information from respondents who are undecided, who do not want to reveal for whom they are going to vote, and who do not intend to vote at all. However, these people may also have valuable expectations about the election outcome. second, expec-tations likely incorporate information not only about one’s own vote inten-tion but also about the inteninten-tions of others, as well as informainten-tion from other sources. for example, people might form expectations of the election outcome from following general media coverage of the campaign, reading the latest polls and expert analyses, and talking to peers.
In fact, as shown by rothschild and Wolfers (2012), each person’s expecta-tion is equivalent to a multi-person intenexpecta-tion poll. The authors estimated that one vote expectation contains about as much information as 20 vote inten-tions. This is a major advantage of expectation surveys, since sample size and composition are less critical. rothschild and Wolfers (2012) demonstrated this by calculating forecasts based on expectations from biased subsamples (i.e., only democrats and only republicans). In both cases, the expectation-based forecasts of the biased subsamples provided more accurate forecasts than the complete sample of vote intentions.
These results suggest that responses to the vote expectation question pro-vide more accurate forecasts of what will happen on election day than the vote intention question. However, as outlined earlier, single polls are a poor benchmark of forecast accuracy. The present study thus compares the relative accuracy of vote expectations and sophisticated poll-based forecasts such as combined poll projections.
VOTe exPeCTATIOn sUrVeYs VersUs PredICTIOn MArKeTs And exPerTs In eliciting expectations, forecasts from experts and prediction markets are closely related to vote expectation surveys. One major difference between the three approaches lies in the composition of the sample. While vote expecta-tion surveys sample respondents randomly, the other two approaches rely on selected (as in the case of expert surveys) or self-selected (as in the case of
prediction markets) experts.6 Given the similarities of these methods, it is
sur-prising that few researchers have studied their relative accuracy.
One study compared responses to the Anes vote expectation question to forecasts from the IeM vote-share markets during the past two weeks prior to each of the five Us presidential elections from 1988 to 2004. The relationship
6. In addition, prediction markets differ from regular surveys in how they aggregate information. Prediction market participants buy and sell shares, whose prices reflect the combined expectations of all participants. That is, participants can win and lose money depending on their performance and thus have an incentive to be accurate. since participants should become active only if they think they know better than the market as a whole, they are often referred to as “self-selected experts.”
Graefe 212
at Jordan University of Science and Technology on July 26, 2016
http://poq.oxfordjournals.org/
between the respective forecasts and the final vote was slightly higher for the vote expectations compared to the IeM forecasts (Holbrook 2010). Another study found that an online expectation survey of more than 19,000 respond-ents was more accurate than the Intrade prediction market when forecast-ing winnforecast-ing probabilities for the 2008 Us presidential election (Miller et al. 2012). finally, a study of the 2006 swedish parliament elections found that combined vote-share forecasts of non-experts (members of the public) were more accurate than combined forecasts of experts (sjöberg 2009).
These results may surprise. How is it possible that the combined predic-tions of regular citizens perform as well as—or even better than—combined predictions of (self-)selected experts? especially since, at the individual level, sjöberg (2009) found what one would expect: experts were more accurate than the less interested, less informed, and less educated non-experts.
A possible explanation is variance in the heterogeneity of the groups. In sjöberg’s study, the non-experts varied in demographics, and their party pref-erences were in line with the general public (i.e., the final election result). In contrast, the experts (three groups consisting of political scientists, journal-ists, and editors) were mostly male and well educated. In addition, the experts showed a particularly low preference for the Conservative Party (the second strongest party in the polls) and high preferences for parties that were less popular among the general public (e.g., the Liberals and the Center Party). As a result, the less diverse expert group was likely biased in the same direc-tion. In such a situation, combining judgments is of limited value, since the individual estimates are highly correlated and biases do not cancel out in the aggregate (Graefe et al. 2014; Hogarth 1978).
The same appears to be true for prediction markets. One study analyzed trading behavior in two markets operated by the IeM: the 1988 Us presidential election vote-share market and the 1993 Canadian House of Commons mar-ket. In both markets, participants exhibited substantial biases. Compared to the average trader, participants bought more shares of candidates they favored and sold more shares of candidates they did not support (forsythe, rietz, and ross 1999). In other words, even market participants, who have an incentive to be accurate, depart from rational behavior and exhibit wishful thinking. Again, this would be less concerning if participants formed a heterogeneous group, as individual errors would likely cancel out in the aggregate. However, a study on the 1988 IeM shows that often this might not be the case. Participants were predominantly white, male, and well educated, and belonged to the mid-dle- and upper-income categories. In addition, participants tended to be more republican and less independent in their partisan leanings, and were more politically active than the general public (forsythe et al. 1992).
Given these findings, there is reason to believe that vote expectation surveys can provide forecasts that are competitive with expert surveys and prediction markets.
at Jordan University of Science and Technology on July 26, 2016
http://poq.oxfordjournals.org/
VOTe exPeCTATIOn sUrVeYs VersUs QUAnTITATIVe MOdeLs
I was unable to find prior empirical evidence on the relative accuracy of vote expectations and quantitative models. The advantage of models is that they follow a structured approach to forecasting and include much information about historical elections, such as the influence of the state of the economy, the popularity of the incumbent, and the time the incumbent was in the White House. While the accuracy of single models can vary widely across elections, one usually gets accurate forecasts when combining forecasts from different models (Graefe et al. 2014). However, a disadvantage of quantitative models is their limited ability to incorporate information about the specific context of a particular election, such as an economic crisis, threat of terrorism, or some scandal.
Accuracy of Vote expectation Surveys in forecasting uS
presidential elections
The following analysis provides empirical evidence on the relative accuracy of vote expectation surveys compared to polls, prediction markets, expert judgment, and quantitative models for the task of forecasting Us presidential elections.
MeTHOd
All data and calculations are publicly available (Graefe 2013).
Time horizon and error measures: The methods’ forecast accuracy was analyzed across the last 100 days prior to the seven elections from 1988 to 2012. The hit rate and the absolute error were used as measures of accuracy. The hit rate is the percentage of forecasts that correctly predict the winner. for methods that provide forecasts of two-party popular vote shares, the candidate with a vote share of more than 50 percent is predicted to win the election. In the case that each candidate is predicted to gain 50 percent of the popular vote, a tie is recorded. Ties score as half of a correct prediction. The absolute error is the absolute deviation of the predicted and the actual two-party popular vote for the incumbent party’s candidate.
Data and forecast calculations: To allow for fair comparisons, all forecasts are calculated as if they were made ex ante. That is, when calculating the forecasts I used only data that would have been available at the time of the election. In addition, comparisons include only forecasts made around the same time.
Graefe 214
at Jordan University of Science and Technology on July 26, 2016
http://poq.oxfordjournals.org/
Vote expectation surveys: A total of 217 vote expectation surveys were collected across 20 elections from 1932 to 2012; for example: regardless of whom you support, and trying to be as objective as possible, who do you think will win the presidential election in november (2008)—Barack Obama or John McCain? (Gallup Poll, October 23–26, 2008). All surveys obtained were conducted within 150 days prior to election day. The data set includes 16 Anes surveys, one for each of the elections from 1952 to 2012, and the 1932 survey reported by Hayes (1936). The remaining surveys were derived from the iPoll databank of the roper Center for Public Opinion research. for the 1936 election, no survey was found. The online appendix provides more information on the 217 surveys.
Vote expectation surveys provide direct forecasts of who will win; the can-didate that the majority of respondents expect to win is predicted as the elec-tion winner. Table 2 provides an overview of the accuracy of the collected surveys for this task. The vote expectation surveys correctly predicted the win-ner in 193 (89 percent) of the 217 surveys. Only 18 (8 percent) of the surveys predicted the wrong winner, half of which were conducted during the very close 2000 election. The remaining six surveys predicted a tie.
for each survey that was published during the past 100 days prior to election day, the two-party percentage of respondents that expected the incumbent
party candidate to win was recorded.7 This figure was kept constant on days
without any published surveys and was replaced with the results from a more recent survey once available. If more than one survey was published on the
same day, the results of all surveys from that date were averaged.8
While the results of vote expectation surveys allow for making quick forecasts of who will win an election, they cannot be directly interpreted as vote-share forecasts. for example, a survey that reveals that 60 percent of respondents expect the incumbent candidate to win does not mean that the incumbent can be expected to gain 60 percent of the vote. In order to translate vote expectation survey results into vote-share forecasts, it is thus necessary to use data from historical surveys. That is, one estimates how a hypotheti-cal incumbent lead of 60–40 in a vote expectation survey translated to the incumbent’s final vote share in past elections. A simple approach for esti-mating this relationship is linear regression analysis (Lewis-Beck and Tien 1999), whereby the incumbent party’s actual two-party popular vote share is regressed on the results from the vote expectation surveys. When using all 217
7. If no survey was published on day 100 prior to election day, the most recent available survey was used as the starting point. This is the reason why surveys were collected up to 150 days prior to election day.
8. Instead of a survey’s publication date, the iPoll databank reports the last day a survey was in the field. for the present analysis, I therefore assumed that the surveys were published two days later. I also tested whether using different values for the publication delay (i.e., from zero to five days) would affect the results; they did not.
at Jordan University of Science and Technology on July 26, 2016
http://poq.oxfordjournals.org/
vote expectation surveys from 1932 to 2012, regression analysis yields the
where V is the actual two-party popular vote share of the incumbent party and
E is the two-party percentage of survey respondents that expect the incumbent
party candidate to win. The figures in parentheses show the t-values.
The results show that the vote expectation survey results explain about two-thirds of the variance in the incumbent’s popular vote share. If the share of respondents who expect the incumbent to win increases by 10 percent, the incumbent’s vote share increases by 1.7 percentage points. The model also reveals the strong degree of partisanship among Us voters. As noted by Campbell (1996, 423), “no matter how bad the campaign goes for a party, it table 2. Accuracy of Vote expectation Surveys in predicting the Winner (1932–2012)
at Jordan University of Science and Technology on July 26, 2016
http://poq.oxfordjournals.org/
can count on receiving about 40 percent of the two-party vote; no matter how well a campaign goes for a party, it will receive no more than about 60 percent of the two-party vote.” The vote expectation model is consistent with this view. The model predicts that the incumbent would receive at least 41 percent of
the vote, even if nobody expected him to win the election (E = 0). Conversely,
if all survey respondents expected the incumbent to win (E = 1), the model
would predict the incumbent to receive at maximum 58.1 percent of the vote.9
since this vote equation is based on an in-sample estimation using all avail-able data, it cannot be used to evaluate the predictive accuracy of vote expecta-tion surveys for past elecexpecta-tions. for this, it is necessary to calculate forecasts by using only data that would have been available at the time of making a forecast. such ex ante forecasts were calculated by successive updating. for example, to estimate the equation for predicting the 1988 election, only the 40 surveys available from 1932 to 1984 were used, while the 2004 equation is based on
the 124 surveys available through 2000, and so on.10 With this approach, the
estimated vote equation for a particular year does not change over the course of
a campaign.11 The resulting equations were then used to translate the results of
the most recent vote expectation survey available at any day prior to the elec
tion under observation into a vote-share forecast.12 Thus, the vote equation
esti-mated above can be used to generate forecasts of the upcoming 2016 election.
Polls: Polls that were conducted within 100 days prior to each of the 16 elections from 1952 to 2012 were obtained from Graefe (2014). for each poll, the two-party percentage of respondents who intended to vote for the candidate of the incumbent party was recorded. If more than one poll ended on the same day, the results of all polls ending that date were averaged. On days without any polls ending, the most recent poll from preceding days was used.
9. Lewis-Beck and Tien (1999) ran the same regression analysis using data from the 11 Anes surveys from 1956 to 1996. With an intercept of 39.5 and an estimated coefficient of 21.0, the results are comparable, despite their small sample. This provides additional support for the robust-ness of the estimated relationship.
10. The number of available surveys for estimating the vote equation for a particular election can be derived from table 2.
11. Ideally, one would follow an approach similar to the calculation of poll projections. That is, one would estimate different vote equations depending on the time to election day. such an approach would account for the uncertainty that occurs over the course of a campaign, which is reflected in the decreasing accuracy of people’s expectations for long time horizons (Lewis-Beck and skalaban 1989; Lewis-Beck and Tien 1999; Miller et al. 2012; Murr 2011). Unfortunately, limited historical data currently preclude such an analysis, as only a few surveys are available for early elections (cf. table 2).
12. data from the Anes surveys are not available until months after the election. Therefore, the Anes surveys could not be used to calculate ex ante forecasts of the election outcome. However, the Anes data were used to estimate the vote equations for forecasting succeeding elections.
at Jordan University of Science and Technology on July 26, 2016
http://poq.oxfordjournals.org/
Three different poll-based forecasts were used as benchmarks: (1) single
polls, (2) combined polls, and (3) combined poll projections. The single
polls benchmark simply interprets the result of a single poll published on
a particular day as a forecast of the election outcome. The combined polls
benchmark calculates rolling averages of all polls released over a
seven-day period. The third benchmark, combined poll projections, was adopted
from Graefe et al. (2014). That is, for each of the 100 days prior to an
election, starting with 1952, the incumbent’s actual two-party share of the popular vote was regressed on the combined polls’ value for that day. This process produced 100 vote equations (and thus poll projections) per elec-tion year. Again, successive updating was used to calculate ex ante poll projections.
Prediction markets: daily prediction market data from the IeM vote-share markets were obtained from the IeM website (http://tippie.uiowa.edu/ iem). On these markets, people buy and sell futures according to their own expectations of the candidates’ final vote shares. The market price represents the combined forecast of all market participants. To put the prediction market forecasts on equal footing with vote expectation surveys and polls, two-party forecasts were calculated by ignoring any third-party options. The last traded prices per day were used as the market forecasts.
Experts: One expert survey was available for each of the elections in 1992 and 2000, four surveys were available for each of the elections in 2004 and
2008, and five surveys were available for the 2012 election.13 The average
number of experts per survey ranged from 10 to 15. In each survey, experts were asked to provide forecasts of the popular vote shares. Individual and average expert forecasts were compared to the average of the daily vote expectation forecasts during the seven days prior to the publication of the expert survey.
Quantitative models: The present study uses forecasts from seven established
quantitative models.14 These models, along with their forecasts, were collected
from the authors’ publications in Political Methodologist 5(2), American
Politics Research 24(4), and PS: Political Science and Politics 34(1), 37(4), 41(4), and 45(4). Most model forecasts are calculated about two to three
13. The 1992 survey was published in the Washington Post (david s. Broder, “Pundits’ Brew: How It Looks; Who’ll Win? Our fearless Oracles speak,” november 1, 1992, C1). The 2000 survey was pub-lished in the Hotline (“Predictions: Potpourri of Picks from Pundits to Professors,” november 6, 2000). The 13 surveys conducted for the three elections from 2004 to 2012 were derived from Graefe (2014). 14. The latest model versions are described in Abramowitz (2012), Campbell (2012), erikson and Wlezien (2012), Holbrook (2012), Lewis-Beck and Tien (2012), Lockerbie (2012), and norpoth and Bednarczuk (2012). see appendix 1 for the published forecasts for each election since 1992.
Graefe 218
at Jordan University of Science and Technology on July 26, 2016
http://poq.oxfordjournals.org/
months prior to the election. Therefore, the model forecasts were compared to the average of the daily vote expectation forecasts calculated across 90 to 60 days prior to election day, which is about the month of August in the election year.
resULTs
The following analysis provides empirical evidence of the relative accuracy of vote expectation surveys in predicting election winners and vote shares com-pared to each of the four established methods discussed above. The analysis is based on forecasts that were made during the last 100 days prior to the seven elections from 1988 to 2012.
Relative accuracy compared to polls and prediction markets: The accuracy of daily forecasts from vote expectations surveys, polls, and the IeM is analyzed across the full 100-day period prior to election day. Table 3 shows the methods’ hit rate and mean absolute error (MAe) across and for each of the seven elections from 1988 to 2012.
Vote expectation surveys were most accurate in predicting election winners and vote shares. If one had simply relied on the most recent vote expectation survey available on a particular day, one would have achieved an average hit
rate of 92 percent.15 That is, one would have correctly predicted the winner
more than nine out of 10 times. In comparison, if one had relied on the most recent single poll on the same day, one would have predicted the correct win-ner only 79 percent of the time. As expected, combining polls (86 percent correct predictions) and calculating combined poll projections (88 percent) increased upon the accuracy of single polls. surprisingly, with a hit rate of 79 percent, the IeM vote-share markets were no more accurate than single
polls.16
15. due to the disagreement of the popular and the electoral vote in the 2000 election, the calcula-tion of hit rates for that particular election requires special consideration. for each of the bench-mark methods, a forecast of more than 50 percent for Gore was coded as correct, because these methods predict popular vote shares. In contrast, the vote expectation question asks respondents
who will be elected president. Thus, responses that expected Bush to win were coded as correct. readers who disagree with this coding could invert the vote expectation hit rates for the 2000 elec-tion. In that case, for example, the hit rate for the 2000 election reported in table 3 would equal 40 percent, and the average hit rate across the seven elections would equal 89 percent. The results for the vote-share forecasts are not affected by the special case of the 2000 election.
16. I also compared the hit rate of vote expectation surveys to the IeM winner-take-all markets, which were first launched in 1992. The winner-take-all markets were specifically designed to predict popular vote winners and thus provide the better benchmark for this type of task. These markets achieved a hit rate of 88 percent across the six elections from 1992 to 2012. The corre-sponding hit rate of vote expectation surveys for the same time period was 93 percent.
at Jordan University of Science and Technology on July 26, 2016
http://poq.oxfordjournals.org/
table 3. Hit rate and Mean Absolute error of Vote expectation Surveys, polls, and the ieM Vote Share prediction Markets across the last 100 Days prior to election Day (1988–2012)
Mean 1988 1992 1996 2000 2004 2008 2012
Hit rate (in %)
Vote expectation surveys 92 85 100 100 60 98 99 100
single polls 79 74 100 100 48 68 90 76
Combined polls 86 78 100 100 56 69 96 100
Combined poll projections 88 84 99 100 97 100 39 100
IeM vote share market 79 70 67 100 30 88 100 100
Mean absolute error (in % points)
Vote expectation surveys 1.6 3.0 1.4 1.1 2.2 1.1 1.8 0.4
single polls 3.2 4.0 4.9 5.0 3.1 1.9 1.9 1.8
Combined polls 2.9 3.9 4.7 4.7 2.7 1.5 1.7 1.3
Combined poll projections 2.0 1.4 1.9 2.4 1.8 1.1 4.1 1.2
IeM vote share market 1.7 3.0 2.8 1.0 1.4 0.7 1.2 1.5
note.—The analysis of the 1988 election covers only the last 91 days prior to election day, since no vote expectation survey was available before that day.
Graef
e
220
In addition, vote expectation surveys provided highly accurate vote-share forecasts. The vote expectation forecasts missed the final election results on average by 1.6 percentage points and were thus more accurate than each of the four benchmark methods. Compared to single polls, which missed the final election result on average by 3.2 percentage points, vote expectation surveys
reduced the error by 51 percent.17 In other words, if one had relied on the most
recent vote expectation forecast rather than on the results from the most recent single poll, one would have cut the forecast error by more than half. Compared to combined polls and combined poll projections, error reduction was 46 per-cent and 21 perper-cent, respectively. Gains in accuracy compared to the IeM vote-share markets were smaller (6 percent).
Relative accuracy compared to experts: Table 4 compares the accuracy of vote expectation surveys and experts’ judgment made around the same time. In every single comparison, the vote expectation surveys predicted the correct winner. In comparison, the combined experts predicted the correct winner 70 percent of the time and were thus slightly more accurate than the typical expert
(66 percent correct).18
In terms of vote-share forecasts, the MAe of vote expectation surveys (1.2 percentage points) was 32 percent lower than the MAe of the typical expert and 14 percent lower than the MAe of the combined experts.
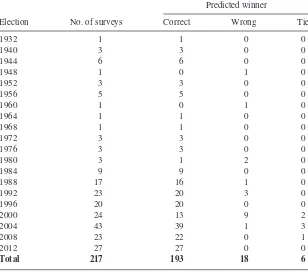
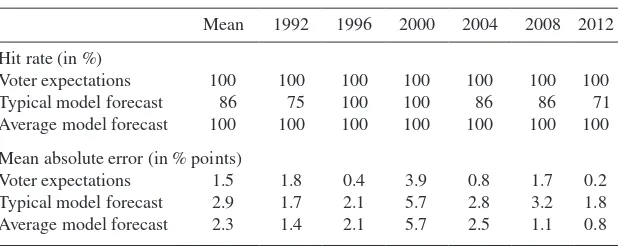
Relative accuracy compared to quantitative models: Table 5 shows the hit rates and MAe of vote expectation surveys and the typical and average forecast of seven quantitative models for the six elections from 1992 to 2012. The vote expectation surveys as well as the average forecast of all available models correctly predicted the winner in each election. The track record of the individual models is not perfect, with two models missing the winner in 2012 and one each in 1992, 2004, and 2008. This results in an average hit rate of 86 percent for the typical model.
In terms of vote-share forecasts, the vote expectation surveys yielded an MAe of 1.5 percentage points and thus reduced the corresponding error of the
typi-cal and combined model forecast by 50 percent and 36 percent, respectively.19
17. The error reduction in percent is calculated as 1 – MAe(vote expectations) / MAe (single polls) = 1 – 1.57 / 3.23 = 0.51.
18. The performance of the typical expert is the performance that one would achieve if one would randomly pick an expert.
19. The careful reader might note an apparent discrepancy between the expectation surveys’ per-fect hit rate and the rather large error in their vote-share forecasts for the 2000 election. The reason is that, at the time the forecasts are compared, which is around three months prior to election day, a large portion of respondents expected Bush to defeat Gore. While this led to accurate predictions of the election winner (i.e., a perfect hit rate), the vote-share forecasts underestimated Gore’s two-party vote (see also footnote 15 for further details).
at Jordan University of Science and Technology on July 26, 2016
http://poq.oxfordjournals.org/
Discussion
There has been much progress in our ability to forecast elections over the past three decades. Combining polls and projecting their results to election day yielded substantial improvements in accuracy compared to single polls. researchers have developed econometric models that can quite accurately predict election outcomes from structural information that is available months before election day. finally, prediction markets reappeared as a powerful tool.
table 4. Hit rate and Mean Absolute error of Vote expectation Surveys and experts (1992, 2000–2012)
Mean 1992 2000 2004 2008 2012
Hit rate (in %)
Vote expectations surveys 100 100 100 100 100 100
Typical expert forecast 66 87 20 47 94 82
Average expert forecast 70 100 0 50 100 100
Mean absolute error (in % points)
Vote expectations surveys 1.2 0.3 2.4 1.1 1.8 0.5
Typical expert forecast 1.8 1.8 2.4 1.8 1.7 1.3
Average expert forecast 1.4 0.7 2.3 1.4 1.5 1.3
note.—The expert forecasts are compared to the average of the daily vote expectation fore-casts during the seven days prior to the publication of the expert survey.
table 5. Hit rate and Mean Absolute error of Vote expectation Surveys and Seven established Quantitative Models (1992–2012)
Mean 1992 1996 2000 2004 2008 2012
Hit rate (in %)
Voter expectations 100 100 100 100 100 100 100
Typical model forecast 86 75 100 100 86 86 71
Average model forecast 100 100 100 100 100 100 100
Mean absolute error (in % points)
Voter expectations 1.5 1.8 0.4 3.9 0.8 1.7 0.2
Typical model forecast 2.9 1.7 2.1 5.7 2.8 3.2 1.8
Average model forecast 2.3 1.4 2.1 5.7 2.5 1.1 0.8
note.—Only four model forecasts were available for the 1992 election. see appendix 1 for the yearly forecasts of each model. The model forecasts are compared to the average of the daily vote expectation forecasts calculated across 90 to 60 days prior to election day.
Graefe 222
at Jordan University of Science and Technology on July 26, 2016
http://poq.oxfordjournals.org/
One simple method, which has existed at least since the advent of scientific polling, has been largely overlooked in this development: surveying people on who they expect to win. Across the past seven Us presidential elections, vote expectation surveys provided more accurate forecasts of election winners and vote shares than any other established method. Gains in accuracy were particularly large compared to the method that is still standard practice for the coverage of election campaigns: single polls. The error of vote-share forecasts derived from vote expectation surveys was 51 percent lower than the corre-sponding error of a single poll. nevertheless, the widespread belief that polls provide accurate forecasts persists.
reLATIVe PerfOrMAnCe Of POLLs And VOTe exPeCTATIOn sUrVeYs In THe 2012 eLeCTIOn
The national Council on Public Polls (nCPP) analyzed 25 national polls that were conducted within the final week of the 2012 campaign. The nCPP con-cluded that, with an average error of 1.46 percentage points, the polls “came
close to the election outcome.”20 However, the nCPP failed to compare the
polls’ performance to a benchmark. I calculated the corresponding error of forecasts from vote expectation surveys and the IeM for the same time period. Both benchmarks provided much more accurate predictions than the nCPP poll sample. The vote expectation surveys yielded an error of 0.71 and thus reduced the error of polls by more than 50 percent. With an error of 0.99 per-centage points, the IeM were 30 percent more accurate than the polls. note that these gains in accuracy were obtained for the last week prior to the
elec-tion, a time in which polls usually provide very accurate forecasts.21
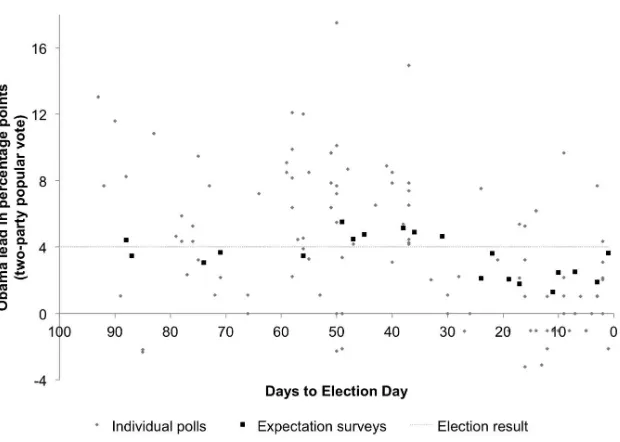
figure 1 extends this analysis and shows the relative accuracy of vote-share predictions of 110 polls and 20 vote expectation surveys that were published during the last 100 days prior to the 2012 election. The vertical axis shows Obama’s predicted lead in the two-party popular vote, and the dotted gray line depicts the final election outcome; Obama won the election with a four-point advantage over romney. single polls varied wildly and predicted anything from a three-point lead for romney to an 18-point lead for Obama (standard devia-tion: 4.3). In comparison, the vote expectation survey forecasts ranged from a one-point to a six-point lead for Obama (standard deviation: 1.3). That is, vote expectation survey forecasts were much more stable, less extreme, and closer to the election result than individual polls throughout the 100-day time horizon. The elections from 1988 to 2008 show a similar pattern (cf. appendix 3).
20. The nCPP’s “Analysis of final 2012 Pre-election Polls” is available at www.ncpp.org. 21. I also compared the accuracy of the final vote expectation forecasts and the final Gallup pree-lection poll for the past seven epree-lections from 1988 to 2012. The vote expectation survey forecasts were more accurate in four of the seven surveys, with an average error of 1.5 percentage points. In comparison, the error of the final Gallup poll was 27 percent higher (1.9 percentage points). The numbers are provided in appendix 2.
at Jordan University of Science and Technology on July 26, 2016
http://poq.oxfordjournals.org/
reLATIVe PerfOrMAnCe Of fIVeTHIrTYeIGHT.COM And VOTe exPeCTATIOn sUrVeYs In THe 2012 eLeCTIOn
One cannot discuss forecasts of the 2012 election without mentioning nate silver’s fiveThirtyeight.com, a polling aggregation website that was launched in 2008
and became part of the New York Times online from 2010 to 2013. silver uses
sophisticated statistical analyses to analyze the type and extent of biases of single pollsters, and to demonstrate the value of polling aggregation for forecasting. His forecast model aggregates information from state-level polls by accounting for the relative performance of different pollsters and considering relationships between states. In addition, the model incorporates an index of economic indicators, whose weight decreases as the election nears. simply put, silver’s model is an enhanced and much more sophisticated version of the traditional quantitative models, some of which also combine polls and economic fundamentals.
fiveThirtyeight has become extremely popular. In the week prior to the
2012 election, almost three out of four politics visits at the New York Times
website included a stop at fiveThirtyeight. The day before the election, one in five nytimes.com visitors looked at silver’s site (Tracy 2012). fiveThirtyeight had become a synonym for election forecasting, which becomes evident when looking at the relative volumes of Google searches for variants of “fivethirtyeight” and “election forecast” (cf. appendix 4).
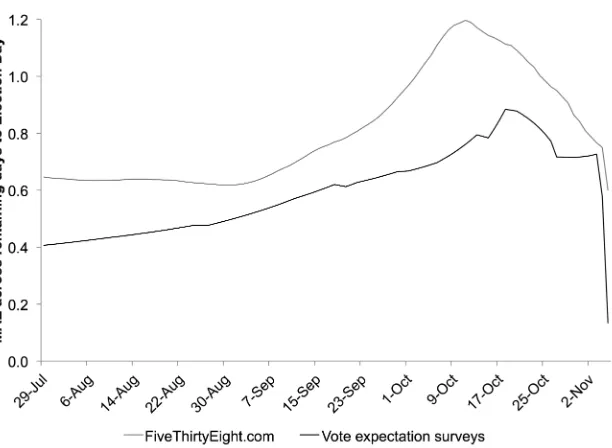
I compared the accuracy of vote expectation surveys to silver’s popular vote forecast. figure 2 reports the error of both approaches for the last 100 days figure 1. 2012 uS presidential election Vote-Share forecasts of 20 Vote expectation Surveys and 110 polls (last 100 Days prior to election Day).
Graefe 224
at Jordan University of Science and Technology on July 26, 2016
http://poq.oxfordjournals.org/
prior to the election. Any point on the lines in the chart shows the average error for the remaining days in the forecast horizon. for example, if one had relied on the fiveThirtyeight forecast on each of the 100 days prior to election day (i.e., starting from July 29), one would have achieved an MAe of 0.65 percent-age points. If one had relied on fiveThirtyeight on each day from October 11, one would have achieved an MAe of 1.2 percentage points, and so on. The corresponding values for the MAe of the vote expectation surveys are 0.40 (from July 29) and 0.76 (from October 11). As shown in figure 2, at any point in the campaign, one would have fared better by relying on the most recent vote expectation survey instead of relying on the forecasts at fiveThirtyeight.com. Across the full 100-day forecast horizon, vote expectation surveys reduced the
error of fiveThirtyeight on average by 38 percent.22
22. One advantage of fiveThirtyeight is that the model also provides forecasts at the state level. for the 2012 election, the model’s final forecast correctly predicted the winner in all 51 states. I used data from the 2012 Anes preelection survey to analyze the performance of vote expecta-tion surveys for the same task. Although the number of responses for some states was very small and the survey had started already in early september, two months before the election, the Anes vote expectation question performed well. In 49 of 51 states, the majority of respondents correctly predicted the election winner in that state; the two exceptions were north Carolina and new Hampshire. The results from this single survey suggest that vote expectation surveys can also provide highly accurate forecasts at the state level.
figure 2. Mean Absolute error of popular Vote-Share forecasts from Vote expectation Surveys and fivethirtyeight.com for the 2012 uS presidential election.
at Jordan University of Science and Technology on July 26, 2016
http://poq.oxfordjournals.org/
BArrIers TO THe AdOPTIOn Of VOTe exPeCTATIOn sUrVeYs
The accuracy of vote expectation surveys in forecasting elections may come as a surprise given that the results of vote expectation surveys are rarely reported, not to say ignored, by the media. Instead, the trial-heat question, which asks
respondents for whom they intend to vote, dominates the media coverage of
election campaigns.
One likely reason for the disregard of vote expectation surveys is that people simply do not know about their accuracy. The present study aims at addressing this knowledge gap by comparing the method to established benchmarks. But additional barriers are likely to hinder the adoption of vote expectation surveys in practice. In particular, people have no faith in sim-ple methods and journalists are interested in newsworthiness rather than accuracy.
Complexity persuades: Occam’s razor advises researchers to prefer simple models unless simplicity is offset by more explanatory power. since Occam, many famous researchers have advocated the use of simple models. Albert einstein is reputed to have said that “everything should be made as simple as possible but not simpler.” Zellner (2004), who coined the phrase “keep it sophisticatedly simple,” praised several nobel laureates as proponents of simplicity. Vote expectation surveys adhere to Occam’s razor; they are easy to conduct, the results are easy to understand, and they provide forecasts that are at least as accurate as more complex methods.
Unfortunately, simple methods often face resistance, because people tend to wrongly believe that complex solutions are necessary to solve complex problems. Hogarth (2012) reported results from four influential studies, which showed that simple methods often perform better than more complex ones. In each case, however, people initially resisted the findings regarding the perfor-mance of simple methods. The same appears to be true for election forecasting. People are impressed by sophistication and complexity (e.g., fiveThirtyeight. com) and overlook obvious approaches, such as simply asking people whom they expect to win.
Newsworthiness beats accuracy: Journalists and political commentators need to meet the demands of the news cycle and constantly look for interesting stories and analyses. In this endeavor, they often select newsworthiness over
accuracy and relevance. In particular, journalists increasingly generate news
by focusing on who is ahead in the polls or linking the latest poll results to campaign events. As shown in figure 1 and appendix 3, polls from different survey organizations often vary wildly, even if they are conducted at around the same time. In such a situation, journalists can cherry-pick polls that support their story and perhaps be less concerned about the accuracy of a poll, in particular if the election is still some time away. This horserace
Graefe 226
at Jordan University of Science and Technology on July 26, 2016
http://poq.oxfordjournals.org/
approach negatively affects the quality of campaign coverage and comes at the expense of informing the public about candidates and their proposed policies (rosenstiel 2005; Patterson 2005).
In contrast, vote expectation surveys are much more robust and less extreme. Their forecast rarely changes. However, precisely because of this stability, journalists find them less suited to generating news. If journalists would over-come the horserace mentality and turn their attention to vote expectation sur-veys instead, they could concentrate on providing explanations for the relative performance of candidates and their proposed policies, and voters would be much better informed about who is really ahead.
conclusion
The general-election observer is probably most interested in knowing who will win. When it comes to Us presidential elections, vote expectation surveys are likely to produce the most reliable predictions. What is more, the results of such surveys can be translated into highly accurate vote-share forecasts.
Vote expectation surveys are inexpensive and easy to conduct, and the results are easy to understand. Because vote expectations are much more sta-ble than vote intentions, they are not suited to framing elections as horseraces. Thus, an increased focus on vote expectation surveys is likely to positively affect the quality of election campaign coverage.
at Jordan University of Science and Technology on July 26, 2016
http://poq.oxfordjournals.org/
Appendix 1. Quantitative Model forecasts of the uS presidential elections from 1992 to 2012
election 1992 1996 2000 2004 2008 2012
election result 46.4 54.7 50.3 51.2 46.3 52.0
Model fC Ae fC Ae fC Ae fC Ae fC Ae fC Ae
Abramowitz 46.7 0.3 56.8 2.1 53.2 2.9 53.7 2.5 45.7 0.6 50.6 1.4 Campbell 47.1 0.7 58.1 3.4 52.8 2.5 53.8 2.6 52.7 6.4 52.0 0.0
Holbrook 57.2 2.5 60.0 9.7 54.5 3.3 44.3 2.0 47.9 4.1
Lewis-Beck &
Tien 51.5 5.1 54.8 0.1 55.4 5.1 49.9 1.3 49.9 3.6 48.2 3.8
Lockerbie 57.6 2.8 60.3 10.0 57.6 6.4 41.8 4.5 53.8 1.8
norpoth 57.1 2.4 55.0 4.7 54.7 3.5 49.9 3.6 53.2 1.2
Wlezien &
erikson 45.9 0.5 56.0 1.3 55.2 4.9 51.7 0.5 47.8 1.5 52.6 0.6
note.—forecasts were published in Political Methodologist 5(2), American Politics Research 24(4), and PS: Political Science and Politics 34(1), 37(4), 41(4), and 45(4). forecasts and election results refer to the two-party share of the popular vote received by the candidate of the incumbent party.
Appendix 2. Accuracy of election eve forecasts for the Seven elections from 1988 to 2012: Vote expectation Surveys vs. final gallup Survey
election
aGallup poll numbers obtained from
http://www.gallup.com/poll/9442/election-polls-accu-racy-record-presidential-elections.aspx. forecasts and election results refer to the two-party share of the popular vote received by the candidate of the incumbent party.
Graefe 228
at Jordan University of Science and Technology on July 26, 2016
http://poq.oxfordjournals.org/
Appendix 3. error of Vote-Share forecasts from Vote expectation Surveys and individual polls (1988 to 2008)
note.—Horizontal axis: days to election day; Vertical axis: Percentage error in predicting the incumbent’s popular two-party vote (positive values mean that the forecast was higher than the actual result, negative values mean that the forecast was lower); Black markers: error of expecta-tion surveys; Gray markers: error of individual polls.
at Jordan University of Science and Technology on July 26, 2016
http://poq.oxfordjournals.org/
Supplementary Data
supplementary data are freely available online at http://poq.oxfordjournals.org/.
references
Abramowitz, Alan I. 2012. “forecasting in a Polarized era: The Time for Change Model and the 2012 Presidential election.” PS: Political Science & Politics 45:618–19.
Benoit, William L., Glenn J. Hansen, and rebecca M. Verser. 2003. “A Meta-Analysis of the effects of Viewing U.s. Presidential debates.” Communication Monographs 70:335–50. Berg, Joyce e., forrest d. nelson, and Thomas A. rietz. 2008. “Prediction Market Accuracy in
the Long run.” International Journal of Forecasting 24:285–300.
Campbell, James e. 1996. “Polls and Votes the Trial-Heat Presidential election forecasting Model, Certainty, and Political Campaigns.” American Politics Research 24:408–33. Campbell, James e. 2012. “forecasting the Presidential and Congressional elections of 2012:
The Trial-Heat and the seats-in-Trouble Models.” PS: Political Science and Politics 45:630–34. Campbell, James e., Lynna L. Cherry, and Kenneth A. Wink. 1992. “The Convention Bump.”
American Politics Research 20:287–307.
Condorcet, Jean-Antoine-nicolas de Caritat, marquis de. 1994[1785]. “essay on the Application of Probability Analyses to decisions returned by a Plurality of People.” In Condorcet: Foundations of Social Choice and Political Theory, edited by Iain McLean and fiona Hewitt, 11–36. Brookfield, VT: edward elgar Publishing.
erikson, robert s., and Christopher Wlezien. 1999. “Presidential Polls as a Time series: The Case of 1996.” Public Opinion Quarterly 63:163–77.
———. 2008. “Are Political Markets really superior to Polls as election Predictors?” Public Opinion Quarterly 72:190–215.
erikson, robert s., and Christopher Wlezien. 2012. “The Objective and subjective economy and the Presidential Vote.” PS: Political Science & Politics 45:620–24.
Appendix 4. google Searches for fivethirtyeight and “election forecast” prior to the 2012 election
Graefe 230
at Jordan University of Science and Technology on July 26, 2016
http://poq.oxfordjournals.org/
forsythe, robert, forrest nelson, George r. neumann, and Jack Wright. 1992. “Anatomy of an experimental Political stock Market.” American Economic Review 82:1142–61.
forsythe, robert, Thomas A. rietz, and Thomas W. ross. 1999. “Wishes, expectations, and Actions: A survey on Price formation in election stock Markets.” Journal of Economic Behavior & Organization 39:83–110.
Gelman, Andrew, and Gary King. 1993. “Why Are American Presidential election Campaign Polls so Variable When Votes Are so Predictable?” British Journal of Political Science
23:409–51.
Graefe, Andreas. 2013. Replication Data For: Accuracy of Vote Expectation Sur
veys in Forecasting Elections. Harvard dataverse network, doi:10.7910/dVn/
VOTeexPeCTATIOnsUrVeYs.
———. 2014. Replication Data For: Combining Forecasts: An Application to Elections. Harvard dataverse network. Available at dx.doi.org/10.7910/dVn/23184.
Graefe, Andreas, J. scott Armstrong, randall J. Jones Jr., and Alfred G. Cuzán. 2014. “Combining forecasts: An Application to elections.” International Journal of Forecasting 30:43–54. Granberg, donald, and edward Brent. 1983. “When Prophecy Bends: The Preference-expectation
Link in U.s. Presidential elections, 1952–1980.” Journal of Personality and Social Psychology
45:477–91.
Hayes, samuel P. Jr. 1936. “The Predictive Ability of Voters.” Journal of Social Psychology
7:183–91.
Hogarth, robin M. 1978. “A note on Aggregating Opinions.” Organizational Behavior and Human Performance 21:40–46.
———. 2012. “When simple Is Hard to Accept.” In Ecological Rationality: Intelligence in the World, edited by Peter M. Todd, Gerd Gigerenzer, and ABC research Group, 61–79. Oxford, UK: Oxford University Press.
Holbrook, Thomas M. 2010. “forecasting Us Presidential elections.” In The Oxford Handbook of American Elections and Political Behavior, edited by Jan e. Leighley, 346–71. Oxford, UK: Oxford University Press.
Holbrook, Thomas M. 2012. “Incumbency, national Conditions, and the 2012 Presidential election.” PS: Political Science & Politics 45:640–43.
Kernell, samuel. 2000. “Life before Polls: Ohio Politicians Predict the 1828 Presidential Vote.”
PS: Political Science and Politics 33:569–74.
Lazarsfeld, Paul f., Bernard Berelson, and Hazel Gaudet. 1948. The People’s Choice: How the Voter Makes Up His Mind in a Presidential Campaign. 2nd ed. new York: Columbia University Press.
Lemert, James B. 1986. “Picking the Winners: Politician vs. Voter Predictions of Two Controversial Ballot Measures.” Public Opinion Quarterly 50:208–21.
Lewis-Beck, Michael s., and Andrew skalaban. 1989. “Citizen forecasting: Can Voters see into the future?” British Journal of Political Science 19:146–53.
Lewis-Beck, Michael s., and Mary stegmaier. 2011. “Citizen forecasting: Can UK Voters see the future?” Electoral Studies 30:264–68.
Lewis-Beck, Michael s., and Charles Tien. 1999. “Voters as forecasters: A Micromodel of election Prediction.” International Journal of Forecasting 15:175–84.
Lewis-Beck, Michael s., and Charles Tien. 2012. “election forecasting for Turbulent Times.” PS: Political Science & Politics 45:625–29.
Lockerbie, Brad. 2012. “economic expectations and election Outcomes: The Presidency and the House in 2012.” PS: Political Science & Politics 45:644–47.
Miller, Michael K., Guanchun Wang, sanjeev r. Kulkarni, H. Vincent Poor, and daniel n. Osherson. 2012. “Citizen forecasts of the 2008 U.s. Presidential election.” Politics & Policy 40:1019–52.
Murr, Andreas e. 2011. “‘Wisdom of Crowds”? A decentralised election forecasting Model That Uses Citizens’ Local expectations.” Electoral Studies 30:771–83.
at Jordan University of Science and Technology on July 26, 2016
http://poq.oxfordjournals.org/