Water Quality
Monitoring
Technical Guide Book
THE
OREGON
PLAN
for
Salmon and
Watersheds
Water Quality Monitoring:
Technical Guide Book
O regon P lan for S alm on an d W atersh eds
W ater Q uality M onitoring
Version 2.0 i Water Quality Monitoring Guidebook
O regon P lan for Salm on and W atersheds
W ater Q uality M onitoring G uidebook
U n d e rsta n d in g th e sta tu s a n d tre n d s in n a tiv e fish p o p u la tio n s a n d th e strea m a n d la n d sc a p e c o n d itions that affect th em are essentia l to th e su ccess of th e O regon P lan fo r Salm on and W a tersheds (O P S W ). H a ving a standard tool that help s lo cal groups, agency personnel and others determ in e th ese trends and conditio n s in a c o n sisten t a n d verifiable wa y is also essentia l. The use of standard m onito ring techniques provid es th e public with su ch a tool.
T h e data collected th rough m onito ring can be useful fo r developing plans to restore and protect a stream 's biological capacity, as well as determ in ing wh ether com p leted restoration projects achieved th eir in tended goals. W a tersh ed councils and other lo cal groups play a critica l ro le in id en tifyin g th e ca u ses o f d eclin e in a strea m ’ s a b ility to su p p o rt sa lm o n a n d tro u t p o p u la tio n s a n d o th e r b e n e ficia l u se s, a s well a s d o c u m e n tin g resu lts o f restoration projects. The purpose of th is guidebook is to provid e technical guidance so wa tersh ed councils and other volunteers m a y achieve th eir restoration goals as partn ers in th e O P SW .
M a n y d ifferen t a g en cies, vo lu n teer g ro u p s, a n d p riva te c itizen s a re in vo lved in d a ta co llectio n , so h a vin g a c o n sisten t m eth o d is im p o rta n t. T o a ssist in c o lle c tin g c o n sisten t a n d a c c u ra te d a ta , th e O P S W W a ter Q u ality M o n ito rin g T ea m h a s p rep a red g u id elin es to m ea su re wa ter q u a lity. T h ese g u id elin es a re d esig n ed fo r u se b y individual landowners, wa tersh ed councils, other citizen g roups, and agency personnel. These guidelin es c o m p lem en t th e G W E B W a tersh e d A ssessm e n t M a n u a l (N E S , 1 9 9 9 ).
T h e O re g o n W a tersh e d A ssessm e n t M a n u a l p ro v id e s a g u id e fo r c h a ra c terizin g c o n ditio n s in lo ca l wa tersh ed s a n d provid es a strong base fo r id en tifyin g sp ecific resto ra tio n a n d p ro te c tio n o p p o rtu nities a n d m o n ito rin g n e e d s. T h e m o n ito rin g tech n iq u es, o r "p ro to co ls," p resen ted in th is g u id e d escrib e th e step s u sed fo r o b ta in in g sp ecific, field -b a se d d a ta a b o u t wa ter q u a lity. T h e W a tersh e d A ssessm e n t M a n u a l serv e s a s a b ro a d d ia g n o stic to o l. T h e W a ter Q u a lity M o n ito rin g G u id ebook is a verifica tio n to o l th a t ca n b e u sed to refin e th e p u b lic's u n d e rsta n d in g a n d d ia g n o sis o f wa tersh e d a n d wa ter q u ality co n d itio n s.
T h e in itia l ch a p te rs p ro v id e b a c k g ro u n d in fo rm a tio n , m o n ito rin g stra teg ie s a n d wa y s to d e v e lo p a m o n ito rin g plan. A lso expla in ed in th ese chapters are criteria fo r selecting m onito ring sites, data quality g u id elin es, a n d m eth o d s to sto re a n d a n a ly ze wa ter q u a lity d a ta . R eferen ces and contacts are provid ed in each chapter to obtain m o re d e ta iled o r u p -to -d a te in fo rm a tio n . T h e su b se q u e n t c h a p te rs p ro v id e p ro to c o ls fo r m o n ito rin g :
_ strea m tem p era tu re _ d isso lved oxygen _ p H
_ co n d u c tivity
_ n itro g e n /p h o sp h o ru s c o n c e n tra tio n
_ tu rb id ity
_ m acro in vertebrates
_ p esticid es and to xic chem icals
E a c h o f th e se p ro to c o l c h a p te rs is d e sig n e d to b e a sta n d -a lo n e d o c u m e n t th a t p ro v id e s b a sic m o n ito rin g te c h n iq u e s fo r th a t p ro to c o l. In fo rm a tio n o n a d d itio n a l referen c e s is a lso p ro v id e d in e a c h c h a p te r. H o w e a c h in d iv id u a l, g ro u p , o r a g e n c y wo rks th ro u g h th e se p ro to c o ls will d ep en d o n th eir tech n ica l b a ckg ro u n d ,
Version 2.0 ii Water Quality Monitoring Guidebook th e wa ter q u a lity, p h ysica l h a b ita t, wa tersh e d a ssessm e n t, a n d o th e r m o n ito rin g p ro to c o ls d e v e lo p e d a s p a rt o f th e O P S W . T h ey m a y a lso b e u sefu l in a ssessin g wa ter q u a lity in wa tersh ed s wh ere S en a te B ill 1 0 1 0 p la n s, T o ta l M a x im u m D a ily L o a d (T M D L ) a ssessm e n ts o r so u rc e a re a a ssessm e n ts u n d e r th e S a fe D rin k in g W a ter A ct a re developed.
A n a d d itio n a l b e n efit in fo llo win g th e m a n u a l's re c o m m en d a tio n s is p ro v id in g c re d ib le d a ta fo r a sta te -wid e d a ta b a se . T e c h n iq u e s fo r c a lib ra tin g in stru m en ts, sele c tin g a p p ro p ria te sites, a n d m a n a g in g d a ta a re in c lu d e d in th e g u id e b o o k a n d , if u se d , will h elp a g en cy p ersonnel develop su ch a database. T h e database would eventually su p p o rt th e O P S W ’ s e ffo rt to resto re a n d p ro te c t fish h a b ita t a n d wa tersh e d h e a lth th ro u g h o u t O re g o n . B u t th e rea l v a lu e in u sin g th e m o n ito rin g te c h n iq u e s d e scrib e d in th is m a n u a l is p ro v id in g wa tersh e d c o u n c ils a n d o th e r lo c a l v o lu n te e rs with relia b le m eth o d s fo r m o n ito rin g wa ter q u a lity in n ea rb y strea m s wh ich th ey ca n th en u se to m a ke th eir own assessm ents. A ccura te m onito ring data can help in fo rm lo cal decisions about how to best m anage fo r fish a n d wa tersh e d s.
T h e p a rticip a tio n o f lo ca l citizen s in th is effo rt is essen tia l. C o rrectly co llected d a ta is u sefu l to la n d o wn e rs, co n cern ed citizen s, a n d a g e n c y p e rso n n e l. P o o rly c o lle c te d d a ta o f u n k n o wn q u ality ca n resu lt in lo ss o f tim e a n d m oney. It is th e in tent of th is guidebook to share data collection techniques that will h elp everyone wo rk to wa rd a so lu tio n to resto re fish p o p u la tio n s. W h ile c o n ta c ts fo r e q u ip m e n t m a n u fa c tu rers a n d m o d e ls o f in stru m en ts a re discussed in th is guidebook, th ese references do not constitu te a n en d o rsem en t o f a n y p ro d u c t.
C redits
T h is set of protocols w as developed by a W ater Q uality M on itorin g T eam form ed durin g th e O PSW M on itorin g Plan Scopin g Session s (Jan uary 1997). T h e w ork group w as m ade up of represen tatives from th e U n ited States E n viron m en tal Protection A gen cy (E PA ), U n ited States B ureau of L an d M an agem en t (B L M ), O regon D epartm en t of A griculture (O D A ), O regon D epartm en t of E n viron m en tal Q uality (D E Q ), O regon D epartm en t of Forestry (O D F), N ation al C oun cil of th e Paper In dustry for A ir an d Stream Im provem en t (N C A SI), B oise C ascade
C orporation , an d th e M id-C oast W atersh ed C oun cil. K ey con tributors to th ese guidelin es in cluded: D r. G eorge Ice, L iz D en t, Jen n y W alsh , R ick H afele, D ave W ilkin son , L an a B rodziak, L arry C aton , T ravis H un t, E llen H am m on d, an d Paul M easeles. T h e protocol relies h eavily on protocols developed by th e O regon D epartm en t of
Version 2.0 iii Water Quality Monitoring Guidebook
W A T E R Q U A L IT Y M O N IT O R IN G G U ID E B O O K
T able of C ontents
T A B L E S .IV
Version 2.0 iv Water Quality Monitoring Guidebook
T ables
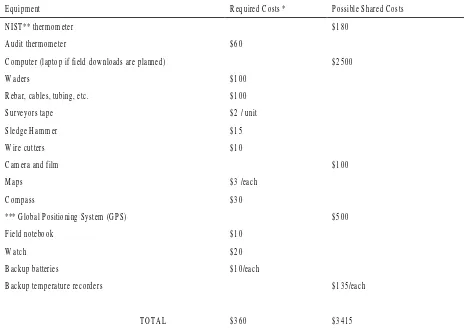
T able 2-1. E stim ated person n el tim e for a stream tem perature m on itorin g project. ... 2-4 T able 4-1. W ater quality param eters by data quality level. D ata quality level depen ds
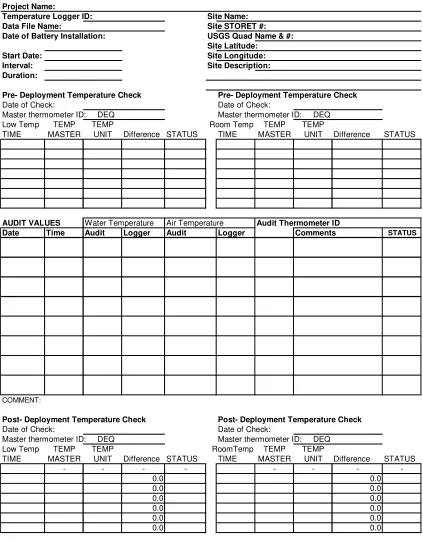
on a com bin ation of quality con trol an d m eth od selection . ... 4-4 T able 6-1. O ptim um an d leth al lim it tem perature ran ges for coh o, ch in ook, an d bull trout. ... 6-2 T able 6-2. T em perature recorder m an ufacturers an d th eir teleph on e n um bers. ... 6-2 T able 6-3. E stim ated equipm en t costs... 6-4 T able 6-4. T em perature logger audit form ... 6-6 T able 6-5. E xam ples for stream tem perature data sum m ary. ...6-12 T able 7-1. E quipm en t costs. ... 7-2 T able 7-2. O xygen solubility (saturation ) in fresh w ater (m g/L ) ... 7-5 T able 10-1. M aterials n eeded to collect samples for nitrate/nitrite, kjehldahl nitrogen, rthophosphate, and
total phosphorous ... 10-3 T able 12-1. L evel 1 assessm en ts. ...12-4 T able 12-2. L evel 2 an d 3 assessm en ts. ...12-4 T able 12-3. L evel of m acroin vertebrate iden tification for L evel III an alysis. ...12-9 T able 12-4. Fam ily level m etrics an d scorin g criteria ...12-11 T able 12-5. G en us/species level m etrics an d scorin g criteria ...12-13 T able A -1. R evised con ceptual framework and example of how the sediment issue
could be addressed with this framework... A-2 T able D -1 E lem en ts of road h azard in ven tory...D -1 T able D -2 Field data sh eet for surface drain age an d stream crossin g details an d
exam ples of collected data. In th is exam ple atten tion is required on th e
last en try because th e culvert is partially blocked ...D -8 T able D -3 Field data sh eets for sidecast details. E xam ple in cluded ...D -9 T able E -1 Field form ... E -4 T able E -2 E xam ple of spreadsh eet organ ization for Figure E -1 calculation s.
D ata represen t 11 tran sects of pebble coun t data ... E -5
F igures
Background 1 - 1 Water Quality Monitoring Guidebook Version 2.0
C h a p te r 1
B ack grou n d
M any factors influence the health of aquatic ecosystem s and the plant and anim al life that depend on them . T hese factors include physical habitat, riparian function, w ater quantity, w atershed health, and w a ter q ua lity. T his guidebook focuses on m ethods for m onitoring w ater quality.
M onitoring involves a series of observations, m easurem ents, or sam ples collected and analyzed over tim e. W ater quality varies naturally w ith location and tim e. For exam ple: the headw aters of stream s at high elevation tend to be cooler than w ide stream s at low er elevations; solar radiation influences stream tem perature fluctuations throughout the day; natural differences in clim ate and the riparian vegetative cover cause differences in stream tem perature. D isturbances such as fires, w indthrow or even debris torrents can influence stream tem perature, turbidity, and other w ater quality param eters. G eology, geom orphology, and clim ate also influence w ater quality.
Pollution can be defined as the fouling or m aking unclean air or w ater w hich harm s beneficial uses. W ater pollution is generally characterized as originating from either “ point” or “ nonpoint” sources. Point source pollution is associated w ith a particular site on a stream and typically involves a know n quantity and type of pollutant that can be controlled at the site. A n exam ple of point source pollution is effluent from a factory outlet (an end-of-pipe discharge) delivered directly to a stream . Point sources are regulated under the C lean W ater A ct w ith N ational Pollution D ischarge E lim ination System (N PD E S) perm its.
N onpoint source pollution is m ore difficult to m anage and m onitor than point source pollution. N onpoint source pollution typically results from m ultiple contam inant sources in the vicinity w here w ater quality has been im paired. T he volum e or “ load” from individual sources is difficult to
m easure and often w ater quality m ay not be degraded at the source site. Instead, the accum ulated im pacts of m ultiple sources of pollution can cause the w ater quality problem . A n exam ple of nonpoint source pollution is fine sedim ent deposition in a stream bed. T he stream m ay flow through a new housing developm ent, agricultural operations, and forested areas w ith roads. A ll of these activities contribute various quantities of sedim ent to the stream channel in addition to the natural level of sedim ent the stream contains.
E m phasis has increased on controlling nonpoint source pollution because w ater quality cannot be protected or restored by focusing on point sources alone. M onitoring is an essential com ponent of this effort. T he strategy for controlling nonpoint source pollution includes the developm ent of B est
M anagem ent Practices (B M Ps) to achieve w ater quality criteria and m eet non-degradation requirem ents.
B M Ps are defined as practices selected by an agency that are practical and effective in reducing pollution from nonpoint sources to levels
com patible w ith w ater quality goals. O nce an agency’s B M Ps are approved by the state w ater quality regulatory agency, they m ay becom e a part of the w ater quality m anagem ent plan (W Q M P) for those landow ners that im plem ent them .
A n approved W Q M P includes descriptions of the actions or activities that w ill allow a landow ner to achieve acceptable w ater quality. For exam ple, the O regon D epartm ent of E nvironm ental Q uality (D E Q ) approved the O regon State Forest Practices A ct as an acceptable B M P program . It is the responsibility of the O regon D epartm ent of Forestry (O D F) to m onitor effectiveness of these B M Ps in achieving w ater quality standards.
In O regon, agricultural activities in w atersheds w ith w ater quality lim ited w aterbodies can com e
Background 1 - 2 Water Quality Monitoring Guidebook Version 2.0
under the provisions of Senate B ill 1010. T his bill requires the O regon D epartm ent of A griculture (O D A ) to help reduce w ater pollution from agricultural sources. U nder the guidance of the O D A , local com m ittees develop a W Q M P for the agricultural portion of the basin.
W ater quality standards have been developed under the leadership of D E Q and can be used in assessing the effectiveness of B M Ps. W ater quality standards involve three elem ents: 1) a narrative that explains w hat the goals of the standards are; 2) the num eric criteria; 3) and a non-degradation policy.
T he num eric criteria are set to protect the m ost sensitive beneficial uses. T hese standards are available on the w eb at
< http://w aterquality.deq.state.
or.us/w q/w qrules.htm > . T he non-degradation policy dictates that if a stream has better w ater quality than the defined standards, that stream shall not be degraded to a low er standard (unless there are com pelling reasons).
focuses on those that have the greatest im pact on fish and fish habitat or are im portant in the listing of w ater quality lim ited stream s (stream s identified on D E Q ’s 303d list). Param eters for T otal M axim um D aily L oad (T M D L )1
assessm ents, or param eters that are part of source area assessm ents for m unicipal w ater supplies are also included. T hese include stream
tem perature, dissolved oxygen, pH , conductivity, nitrogen and phosphorus, sedim ent,
m acroinvertebrates, and pesticides and toxins.
Standards for each of these param eters have been established in order to protect a stream ’s
beneficial uses. T hese standards have been developed after lengthy public review and involvem ent and are based on the latest scientific know ledge.
1
Monitoring Strategy and Plan 2 - 1 Water Quality Monitoring Guidebook Version 2.0
C h a p te r 2
M on itorin g S trategy an d P lan
A m onitoring plan describes the m onitoring strategy that w ill be used. It is developed before starting a m onitoring project. A m onitoring plan provides a guide for w hy, how , w hen, and w here to m onitor w ater quality param eters. T he m onitoring plan can be referred to throughout the course of a m onitoring project to help m aintain consistency and provide docum entation to others.
W hy M o nito r?
M any reasons exist for m onitoring w ater quality. M onitoring can be used to identify areas w here w ater quality standards are not being m et and resources such as salm on and trout are being im paired. M onitoring can also be used to identify the sources and loads of pollutants that are causing these declines. O nce the areas and causes of these w ater quality problem s have been identified, then m onitoring can be used to m easure the overall effectiveness of the w ater quality protection efforts and individual practices. M onitoring is also im portant w hen know ledge of the effects from past restoration treatm ents or past m anagem ent practices are desired in order to help design future
m anagem ent actions. R esource m anagers need m onitoring data to im prove practices and to better protect fish and fish habitat. T he m onitoring process and the data generated can also provide a valuable educational tool for a w ide variety of user groups, such as w atershed councils, school groups, researchers, and other interested people.
M onitoring w ithout a defined purpose provides little benefit, so the first step to ask is, "W hat are the goals of the m onitoring effort?" T ypically, specific questions need to be answ ered. T he questions vary depending on the aquatic resource(s) of interest. For exam ple, asking if the stream m eets the D E Q w ater quality standards for tem perature and dissolved oxygen, or w hether the B M Ps are effectively reducing sedim ent inputs to the stream channel, leads to different m onitoring approaches.
Q uestions such as these w ill help focus the m onitoring efforts and give a better idea of w here and for how long m onitoring is needed. B egin by listing all relevant questions about the aquatic system . Priorities can then be established in their order of im portance and a tim etable for the necessary m onitoring projects developed.
In general, m onitoring projects m ay provide
inform ation to address historical, current, or desired future conditions. M onitoring projects can also describe ecological trends that m ay or m ay not result from the effects of m anagem ent practices. M onitoring can also describe the im pacts from m anagem ent activities, as w ell as interpret the effectiveness of m anagem ent actions such as B M Ps. A dditionally, som e problem s cannot be addressed through m onitoring w ater quality param eters and m ay need a research approach. M onitoring can help identify these problem areas, as w ell. T he O PSW M onitoring T eam has developed a
M onitoring Fram ew ork that depicts these areas of m onitoring (A ppendix A ).
T y p es o f M o nito ring
M onitoring strategies m ay be organized by different m onitoring types. T he type chosen depends on the project’s objectives. R efer to A ppendix B for an in-depth discussion on m onitoring types.
Identifying the m onitoring type is useful w hen coordinating w ith other m onitoring efforts and understanding how to interpret and apply results. H ow ever, identifying the type of m onitoring is not as im portant as identifying the im portant resource questions and properly preparing a m onitoring plan to answ er them .
T he M o nito ring P la n
Monitoring Strategy and Plan 2 - 2 Water Quality Monitoring Guidebook Version 2.0
reach. Stating the problem definition, goals, and objectives at the beginning of the m onitoring plan structures it so that a reliable set of data can be developed w hich answ ers the initial set of questions. W ithout a m onitoring plan to collect data that answ ers specific questions about the w atershed, the data collected could be of lim ited value.
M o nito ring P la n sectio ns includ e the fo llo w ing :
Problem definition
T his section defines the problem . For exam ple:
P e o p le a re c o n c e rn e d th a t tem p e ra tu re s in D ry C re e k e x c e e d w a ter q u a lity sta n d a rd s a n d a re h a rm in g fish .
G oal
T he goal states the purpose for m onitoring. W hat inform ation and/or analysis is anticipated from m onitoring? For exam ple: T h e g o a l o f th is P la n is to d e term in e if tem p e ra tu re s a re e x c e e d in g w a ter q u a lity sta n d a rd s in D ry C re e k a n d if m a n a g e m en t p ra c tic e s a re c o n trib u tin g to e le v a ted
te m p e ra tu re s. O bjectives
O bjectives usually are structured in the form of a specific question. For exam ple: A re strea m tem p era tu res a b o ve th e sta te w a ter q u a lity sta n d a rd o f 6 4 ° F a n dd o e s irrig a tio n w ith d ra w a l fro m D ry C re e k resu lt in d o w n stre a m
tem p e ra tu re s th a t e x c e e d th a t sta n d a rd ? T he kind of questions asked w ill determ ine the type of m onitoring and am ount of resources required.
H ypotheses
Identifying the objective leads to creating an "experim ental hypothesis" that tests w hether a relationship exists betw een an action or activity and the w ater quality param eter of concern. T he experim ental hypothesis for the D ry C reek exam ple could be: Irrig a tio n w ith d ra w a l fro m D ry C re e k resu lts in d o w n stre a m tem p e ra tu re s th a t a re g re a ter th a n 6 4 ° F . T his experim ental hypothesis
leads to designing an experim ent or m onitoring project to resolve w hether the experim ental hypothesis can be confirm ed or refuted. Sim ply m onitoring tem peratures at different stations in D ry C reek m ay not answ er this question because it does not dem onstrate w hy the tem perature pattern occurs. Patterns that can be tied to a cause-and-effect response support experim ental hypotheses m ore strongly.
In the D ry C reek exam ple, one approach m ight be to stop w ater w ithdraw als during periods w hen m axim um tem peratures are occurring and com pare stream tem perature w ith periods w hen w ithdraw als occur. T he null hypotheses (a statem ent that assum es no direct relationship exists) for the experim ental design could be: T h e re is n o d ifferen ce in th e h o u rs th a t D ry C re e k e x c e e d s 6 4 ° F fo r d a y s w ith o r w ith o u t w a ter w ith d ra w a l.
N atural variations in the tem perature response of D ry C reek w ill exist because no day is exactly the sam e as another, but the experim ental and
Monitoring Strategy and Plan 2 - 3 Water Quality Monitoring Guidebook Version 2.0
Site D escription
T his section describes the physical characteristics of the sam pling site(s) and places the m onitoring site in the context of other w atershed sites. For exam ple, channel gradient, elevation, vegetative cover, landuse, region, soils, and geology can be described. Providing stream reach locations using latitude and longitude allow s com parisons to be m ade to data sam pled nearby or in other areas w ith sim ilar site conditions, using a geographic
inform ation system (G IS).
D ata G athering Strategy
T his section describes the physical location, date and tim e of data gathering, the types of data to be gathered and m inim um and optim um data needs. T he locations of data sites should include consideration of ecoregion, stream netw ork, or other variables depending on the scale of the question to be answ ered (see C hapter 3, S electin g S ites). T he tim ing for gathering data should reflect the hydrologic processes suspected of influencing w ater quality. For exam ple, if the data to be gathered is related to storm events, low flow s, or other seasonal variables, these should be identified. T he need for m onthly, daily, hourly or continuous data gathering should be identified both to
determ ine the level of effort or equipm ent necessary and to establish the level of confidence in the data.
M ethods
T his section describes the technical portion of the m onitoring project. It explains to readers the data collection techniques used, equipm ent calibration and use (see pages 16-18), w hat types of data w ere collected, and w hen. T he m ethods section
essentially creates a contractregarding how the data w ill be gathered, w hat types of data w ill be collected, and how the equipm ent’s accuracy w ill be m aintained for those conducting the m onitoring and for others w ho m ay be depending on the data.
D ata Q uality
Q uality A ssurance and Q uality C ontrol (Q A /Q C ) are essential elem ents of any m onitoring plan.
T hey provide evidence that the data is accurate and precise enough to address the questions being asked. T hese elem ents are addressed in detail in C hapter 4.
D ata Storage and A nalysis
T hinking through this section is critical early in the m onitoring process in order to have the support necessary to store, transport, or analyze the data. If the data are to be used w ith the O PSW , know ing how to transport the data to local w atershed councils, D E Q offices, or other public data
repositories in the agreed-upon form at is im portant. D E Q has developed a data storage tem plate that can be used to form at data records (See C hapter 5,
D a ta S to ra g e a n d A n a ly sis).T he m onitoring team w ill also w ant to establish its ow n database for the stream s it is m onitoring. Planning ahead can save tim e, m oney, and avoid the agony of lost data.
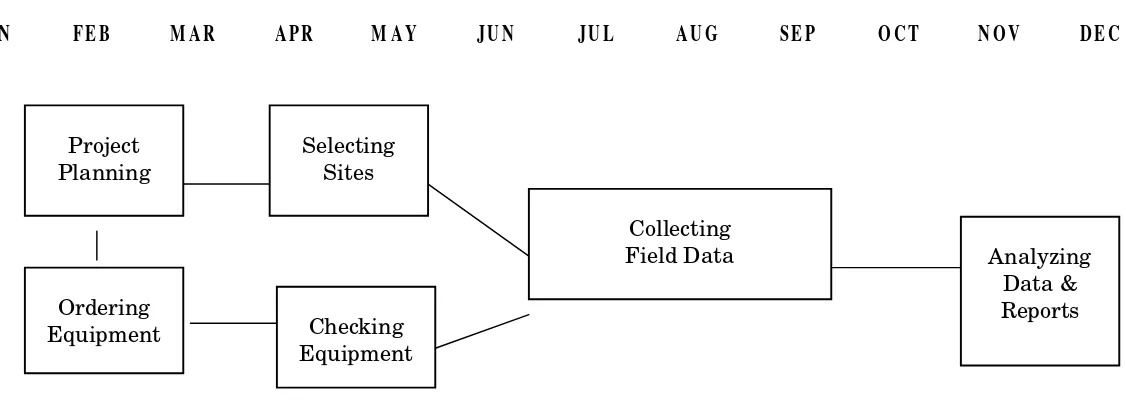
T im etable and Staff R equirem ents
E ach m onitoring project w ill have a unique schedule of activities w hich m ust occur for it to be successful. Planning and im plem enting these activities take tim e. Figure 2-1 and T able 2-1 are provided as general exam ples of the sequencing of steps and tim e requirem ents for a tem perature m onitoring project.
C onfidentiality and L andow ner Perm ission/R elations
O b ta in in g p rio r p e rm issio n fro m p riva te la n d o w n e rs fo r m o n ito rin g sites th a t c o u ld b e lo c a ted o n th e ir p ro p e rty is e ssen tia l. T he O PSW is based on cooperation, so all m onitoring efforts need to m aintain good w ill w ith the affected landow ners. C reating an agreem ent w ith the landow ner about how the data collected on his/her property w ill be used and reported is also
Monitoring Strategy and Plan 2 - 4 Water Quality Monitoring Guidebook Version 2.0
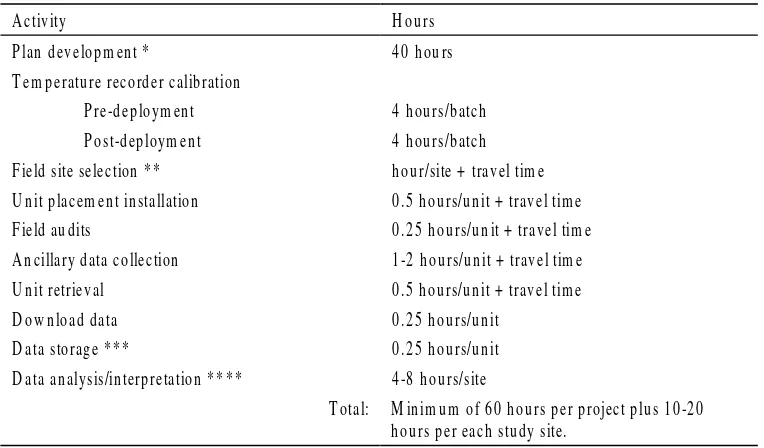
T ab le 2-1. E stimated p erson n el time for a stream temp eratu re-mon itorin g p roject.
A ctivity H ou rs
P lan develop m en t * 4 0 h ou rs T em p eratu re recorder calib ration
P re-dep loym en t P ost-dep loym en t
4 h ou rs/b atch 4 h ou rs/b atch Field site selection * * h ou r/site + travel tim e U n it p lacem en t in stallation 0 .5 h ou rs/u n it + travel tim e Field au dits 0 .2 5 h ou rs/u n it + travel tim e A n cillary data collection 1 -2 h ou rs/u n it + travel tim e U n it retrieval 0 .5 h ou rs/u n it + travel tim e D ow n load data 0 .2 5 h ou rs/u n it
D ata storage * * * 0 .2 5 h ou rs/u n it D ata an alysis/in terp retation * * * * 4 -8 h ou rs/site
Monitoring Strategy an Plan 2 - 5 Water Quality Monitoring Guidebook Version 2.0
JA N FE B M A R A PR M A Y JU N JU L A U G SE P O C T N O V D E C
Figure 2-1. Stream tem perature m onitoring tim e line. T he chart show n above depicts the steps one needs to com plete during a typical season. Shaded boxes refer to steps w hich w ould norm ally be perform ed the first year and every succeeding year of a long-term study. Steps in unshaded boxes usually need to be com pleted only the first year of a long-term study.
Project Planning
Ordering Equipment
Selecting Sites
Checking Equipment
Collecting
Field Data Analyzing
Monitoring Strategy and Plan 2 - 6 Water Quality Monitoring Guidebook Version 2.0
* T h e tim e required to com plete a plan w ill vary w ith th e com plexity of th e project an d experien ce of th e person n el. Forty h ours is a good estim ate, but m ore or less tim e could easily be n eeded. T h e m ost im portan t con sideration is to allocate sufficien t tim e to com plete th is step.
** Site selection begin s w ith th e project plan an d prelim in ary iden tification of sites on m aps. T h e field tim e in volves w alkin g plan n ed study sites an d fin din g a suitable location to in stall each tem perature recorder.
*** D ata storage can turn in to a tim e drain in g task if it isn ’ t plan n ed at th e begin n in g of th e project. D eterm in e th e softw are to be used (on e com patible w ith th e tem perature recorder’ s softw are), th e data fields n ecessary, an d th e person n el respon sible for both settin g up th e softw are an d uploadin g th e data. A suggested data form at is sh ow n in th e data an alysis section of th is ch apter an d can be obtain ed from th e cooperatin g state agen cies (O D F & D E Q ).
**** T em perature recorders produce th ousan ds of data poin ts. T h e data m ust be sum m arized to provide a useful in terpretation of th e data. T h e tim e to com plete th is step w ill vary w ith th e com plexity of th e project an d level of experien ce of th e person n el
T h is in troduction to th e basic structure of a m on itorin g plan is in ten ded to h elp provide project volun teers w ith an un derstan din g of a typical plan ’ s com pon en ts. A s a plan is developed for a specific stream or stream reach , m ore detailed description s of th e project’ s objectives w ill be n eeded. Please refer to th e V o lunteer M onito r’ s G u id e to Q u a lity A ssu rance P roject P lans (1996) by E PA , th e
N a tio n a l H a n d b o o k o f W a ter Q u a lity M o n ito rin g
(1996) by N R C S, an d oth er m on itorin g guides (C allah am 1990; D issm eyer 1994; an d M acD on ald, Sm art, an d W issm ar 1991) for furth er h elp. For h elp or assistan ce at th is stage, con tact th e m on itorin g m en tor for th e O PSW sh ow n in each protocol ch apter, th e local O D FW office, or th e region al D E Q m on itorin g coordin ator sh ow n below .
Statew ide D E Q V olun teer M on itorin g C oordin ator: K aren W illiam s: (503) 229-5983
E m ail: w illiam s.karen @ deq.state.or.us
N orth w est R egion :
L arry C aton : (503) 229-5983. E m ail: caton .larry@ deq.state.or.us
W estern R egion :
D en n is A des, (503) 229-5983 E m ail: ades.den n is@ deq.state.or.us
E astern R egion :
L arry M arxer, (503) 229-5983 E m ail: m arxer.larry@ deq.state.or.us
R eferences
C allah am , R .Z . 1990. G u id elin es fo r m anagem ent o f wild la n d wa tersh e d p ro je c ts. R eport 23.
W ildlan d R esources C en ter, U n iversity of C aliforn ia: B erkeley, C A .
D issm eyer, G .E . 1994. E valuating th e effectiveness of fo rest best m anagem ent practices in m eetin g wa ter q u a lity g o a ls o r sta n d a rd s. M iscellan eous Publication 1520. U SD A Forest Service: A tlan ta, G A .
M acD on ald, L .H ., Sm art, A .W ., an d W issm ar, R .C . 1991. M onito ring guidelin es to evaluating effects of fo restry a ctivities o n strea m s in th e P a cific
Monitoring Strategy and Plan 2 - 7 Water Quality Monitoring Guidebook Version 2.0
N a tio n a l H a n d b o o k o f W a ter Q u a lity M o n ito rin g .
1996. Part 600. N ation al W ater Q uality H an dbook. N atural R esources C on servation Service:
W ash in gton , D .C .
T h e V o lunteer M onito r’ s G u id e to Q u a lity
A ssu rance P roject P lans. 1996. E PA 841-B -96-003. U .S. E n viron m en tal Protection A gen cy, O ffice of W etlan ds, O cean s, an d W atersh eds: W ash in gton , D .C .
Selecting Sites 3 - 1 Water Quality Monitoring Guidebook Version 2.0
C h a p te r 3
S electin g S ites
Selecting the appropriate site or sites for m onitoring w ater quality depends on the desired objectives. T here are three geographic scales to consider in selecting the appropriate m onitoring site: (1) the
sa m p le p o in t provides representative2 data at that spot, (2) the rea c h a p p ro a c h uses m ultiple sites to reflect conditions and trends for a segm ent of stream , and (3) the b a sin sca le uses m ultiple reaches to reflect conditions and trends throughout a w atershed.
In addition to the “ scientific” considerations for m onitoring sites (e.g. using standard data gathering techniques for consistency, m aintaining data quality, etc.), there are also “ practical” considerations. E asy access (such as road crossings) and landow ner perm ission are tw o of these practical considerations. “ Sam pling stations should be accessible for all flow conditions that w ill be sam pled” is a good w orking rule w hen selecting sites (Stednick 1991). If equipm ent is being installed for a long period of tim e, recognize that flow w ill change throughout the year.
E quipm ent that w as not designed to be subm erged can be flooded. C onversely, equipm ent that needs to be subm erged can be left “ high and dry” .
Precautions against vandalism , theft, and accidental disturbance should be considered w hen locating equipm ent. In areas frequented by the public, securing or cam ouflaging equipm ent is advisable. V isible tethers and equipm ent stations are not advisable since they attract attention. W hen equipm ent cannot be protected from disturbance, an alternative m onitoring site should be considered. A ccess to electrical pow er can also be a
consideration for som e equipm ent.
2
"Representative data" refers to the degree to which the data represents the actual environmental conditions at the time of monitoring. In this case, it should reflect the water quality integrated across and through the water column and not isolated elements.
S a m p le P o int C o nsid era tio ns
T he sim plest and m ost specific geographic scale is a sam pling point. H ere, focus should be on selecting a location that w ill result in the m ost representative m easure of the w ater quality param eter at that site.
W hen selecting a sam ple point, rem em ber that if sam ples are collected w here em erging groundw ater or isolated eddies exist, the data w ill not represent the m ain portion of the stream . In order to collect representative data, sam pling site selection m ust m inim ize the influence of potential confounding factors. Som e exam ples of confounding factors include:
• the confluence of tributaries • groundw ater inflow s
• channel structure or "m orphology"
(particularly conditions that create isolated segm ents or pools)
• springs, w etlands, w ater w ithdraw als, effluent discharges
• beaver ponds and other im poundm ents
B y sam pling in a section of a stream channel w ith good w ater m ixing, the data w ill represent the site’s average w ater quality condition. H ow ever, special cases can exist w here m onitoring should include sites containing these confounding factors. In these cases the objective of the m onitoring m ay be to determ ine their influence on overall w ater quality.
Reach Scale
Selecting Sites 3 - 2 Water Quality Monitoring Guidebook Version 2.0
m o nito ring d esign w ill inclu d e a p re-p ro ject, o r "b aseline," d ata co llectio n p erio d .
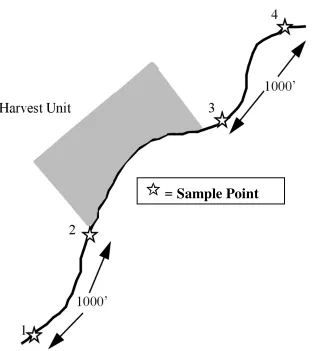
F o r exam p le, if the o b jective is to d eterm ine ho w a lo gging o p eratio n affects stream tem p eratu re, then m u ltip le sam p le p o ints w ill b e need ed . Id eally, these sho u ld b e estab lished p rio r to the lo gging activity o ver the sam e
p o rtio n o f the year w hen p o st-lo gging co nd itio ns w ill b e m o nito red . T w o , o r p referab ly three, sam p le p o ints sho u ld b e p laced slightly u p stream and o ne slightly d o w nstream fro m the harvest u nit (F igu re 3 -1 , p o ints 2 and 3 ).
✩
=
Sample Point
F igu re 3-1. S amp le p oin t an d reach -scale location s.
Furtherm ore, in order to understand the observed trends (e.g. any m easured change in tem perature) through the unit, sam ple points around “ control” reaches w ill be needed. A control is designed to m easure the param eter of concern at sites that are not im pacted by m anagem ent or other effects. T hese control sites are designed to help isolate the
Selecting Sites 3 - 3 Water Quality Monitoring Guidebook Version 2.0
reaches should be located upstream and dow nstream of the harvest unit. It is critica l to re c o g n ize th a t w ith o u t p re -tre a tm e n t d a ta ,
in feren c e s a b o u t m a n a g e m en t e ffe c ts c a n b e w e a k.
M any docum ents and protocols recom m end establishing a “ reference reach” to help provide com parisons and context betw een the stream reach of concern and a sim ilar stream reach w ith less intensively m anaged conditions. (D issm eyer 1994). Stream and riparian conditions for reference reaches represent the best available conditions. T he reference reach for a forested area w ould m ost likely have good w ater quality, com plex fish habitat, high quality spaw ning gravels, shade, cover, and rearing habitat for salm onids, am ple large w oody debris in the stream , and future supplies from the upstream adjacent riparian areas. In som e cases, the reference stream is the “ least im pacted” reach available for m onitoring (Plotnikoff 1992).
H ow ever, lim itations to the reference-reach approach exist. For instance, a w ide range of conditions result from “ natural” disturbances. Fire, floods, and w indstorm s can cause m ajor changes in stream s and w ater quality. T he occurrence or lack of occurrence of one of these events shapes stream characteristics. T herefore, caution is needed w hen com paring stream reaches w ith different
disturbance histories. In addition, not all stream ecosystem s sh o u ld look alike. A n
estuary-influenced reach w ill not look like a headw ater stream , and a high gradient, forested reach w ill not look like a m eadow dom inated, low -gradient stream (see O regon W atershed A ssessm ent M anual discussion of channel habitat types).
B a sin S ca le C o nsid era tio ns
A t the basin scale, landscape and stream patterns becom e the focus of m onitoring. B asin-scale m onitoring represents the m ajor dilem m a facing any sam pling project— it is im possible to m onitor everything, everyw here, all the tim e. W hile every location and stream reach in a w atershed is unique, general patterns can be identified that help in understanding and m anaging w atersheds. “ W atershed analysis” is a process that resource professionals use based on identifying these
patterns in the landscape and stream s (N onPoint Source Solutions, 1999). T his analysis involves developing hypotheses about how the w atershed conditions and m anagem ent activities on the landscape are linked to the riparian and stream response. G ood basin-scale m onitoring involves recognizing these linkages and developing
m onitoring that can be extended from a few sites to a m ore general representation of the w atershed response.
A basin approach is m ore than m erely a strung-together series of sites or reach-level m onitoring activities. A lim ited num ber of m onitoring sites m ust be identified w hose inform ation can represent conditions across the entire w atershed. Stratifying the basin into sim ilar environm ental and land-use conditions is one w ay of identifying candidate m onitoring sites. D efining the basin by "ecoregion" is another classification that can be useful in identifying w here factors such as geology or clim ate are relatively uniform . (E coregions are areas of relative ecosystem hom ogeneity containing essentially sim ilar characteristics such as
vegetation, geology, hydrology, soils, and clim ate).
B asin-scale m onitoring program s should also consider the m ost sensitive or critical sites, both for sources of pollutant loads and w ater quality im pacts. For exam ple, roads built near stream s on slopes w ith a high risk of landslides represent a potential source of sedim ent. C ritical stream reaches, such as high value spaw ning or rearing habitat for salm on, m ay be identified as sensitive to sedim ent deposition. A gain, these sites m ay have a high priority for m onitoring to understand the w atershed response.
Selecting Sites 3 - 4 Water Quality Monitoring Guidebook Version 2.0
C reek. T he w atershed-w ide pattern, show ing that increased shade w as reducing m axim um tributary tem peratures, w as clear. H ow ever, if tem perature m easurem ents at the m outh of Steam boat C reek w ere the only m easurem ent taken, then it w ould appear that w ater tem perature had not im proved. Including tributary tem peratures in the m onitoring project m ore accurately reflected the w atershed-w ide tem perature pattern..
C ho o sing S ites
Several types of sites m ay be selected for m onitoring surveys:
• S tu d y sites are selected to answ er specific questions. T hese could include questions about the effects of certain land uses, im provem ent follow ing restoration w ork, or the effectiveness of B est M anagem ent Practices, am ong others. • R eferen ce sites reflect the best available
conditions present w ithin a specific stream , w atershed basin or ecoregion. A n ideal reference site w ould be in a pristine, natural condition. A realistic reference site usually represents the best attainable conditions and has experienced som e level of hum an effect. Ideally m ore than one reference site is used. Five to ten reference sites should be sam pled for studies that include several stream s over a range of habitats.
• R a n d o m ly sele c te d sites are chosen com pletely at random , w ithout regard to the level of hum an disturbance. In m ost cases, random sites are grouped, or stratified, according to certain factors such as stream order, land use, or ecoregion. R andom site selection provides an unbiased assessm ent of the range of conditions present w ithin a study area. (Note: In Oregon, the EPA Research Lab in Corvallis can provide a list of randomly selected sites for specific projects. Contact Phil Larson at 541-754-4362.)
O nce potential sites have been identified, the actual locations w here data w ill be collected need to be identified. E xcept for random sites, w hich are picked independent of other factors, sam ple sites
should be representative of the larger study area. Physical and geographic characteristics like vegetation, soils, geology, land use, gradient, riparian characteristics, and substrate type need to be considered to assure that sam ple sites are representative of the larger population. For exam ple, sam ple sites should not be directly dow nstream from anom alies such as culverts, bridges, roads, landslides, or w aterfalls unless these are the conditions that the m onitoring program is evaluating.
R eference and study stream s should be in the sam e ecoregion or ecologically sim ilar area (w atershed or basin) and be w ithin an acceptable range of
elevation, gradient, and stream order (G allant, et al 1989). Sim ilar stream s in the sam e ecoregion w ould be expected to have sim ilar w ater chem istry and habitat conditions, and support sim ilar
biological com m unities. D ifferences betw een w ell chosen reference and study sites should be due to hum an or natural disturbance and not due to natural differences betw een the stream s.
L ocating m inim ally im pacted reference stream s in the sam e ecoregion can som etim es prove difficult, especially at the low er elevation sections of stream s. In cases w here unim paired reference sites are not available, one should select the least im paired areas possible. G enerally, im pacted and reference site selection is done in three stages: • O ffic e R e c o n n a issa n c e: using m aps, aerial
photos, published reports, and other m aterials, the m onitoring area is studied and likely stream s are identified.
• C o n su lt th e E xp e rts: federal and state resource m anagem ent agency personnel are very know ledgeable of the natural characteristics and hum an im pacts in the areas they
adm inister. T hey can also provide inform ation on w ork planned for the future in the basins being considered for study, such as proposed tim ber sales or stream im provem ent w ork. L ocal fisheries biologists are a particularly good resource.
Selecting Sites 3 - 5 Water Quality Monitoring Guidebook Version 2.0
surveyed to verify the representation and sim ilarity of the stream s and to select specific stream reaches for sam pling.
H o w M a ny S ites P er S trea m ?
T he location and num ber of sites per stream depends on the objectives of the study, the type of im pacts, and the resources available. G enerally, program designs are of three types:
1) P a ire d strea m a p p ro a c h, w ith several sites per stream . A study stream is paired w ith a nearby unim pacted (or lea st im pacted) reference stream w here several sites are also selected. 2) U p strea m /d o w n stre a m a p p ro a c h, w ith several
sites along a single stream . Selected sites upstream of som e disturbance, w ith the best available conditions, are used as the reference sites. Sites are then selected w ithin and/or dow nstream from the area of concern. 3) E co re g io n a p p ro a c h. A num ber of least
im pacted reference sites w ithin a single physiographic type or ecoregion are selected to determ ine the natural reference condition. A num ber of sites of concern are then selected w ithin the sam e or a sim ilar ecoregion.
W hichever approach is used, it is im portant to sam ple enough sites to determ ine the inherent variability w ithin and betw een different sites, because w ater quality param eters vary in both space and tim e. G athering additional data collected by other agencies or groups can im prove the effectiveness of m onitoring to detect differences betw een sites. T he collection and analysis m ethods
used by other studies need to be com parable, how ever.
R eferences
D issm eyer, G .E . 1994. E va lu a tin g th e
e ffe c tiv e n e ss o f fo rest B est M a n a g e m en t P ra c tic e s in m eetin g w a ter q u a lity g o a ls o r sta n d a rd s.
M iscellaneous Publication 1520. U SD A Forest Service: A tlanta, G A .
G allant, A .L ., T .R . W hittier, D .P. L arsen, J.M . O m ernik, R .M . H ughes. 1989. R egionalization as a T ool for M anaging E nvironm ental R esources. U SE PA R esearch L aboratory. E PA /600/3-89-060. C orvallis, O R .
H oladay, S.A . 1992. S u m m ertim e w a ter tem p e ra tu re tre n d s in S te a m b o a t C re e k B a sin , U m p q u a N a tio n a l F o rest. M S T hesis. O regon State U niversity: C orvallis, O R .
Plotnikoff, R .W . 1992. T im b er/F ish /W ild life b io a ssessm e n t p ilo t p ro je c t. W ashington D ept. of E cology, E nvironm ental Investigations and L aboratory Services: O lym pia, W A .
Stednick, J.D . 1991. W ild la n d w a ter q u a lity sa m p lin g a n d a n a ly sis. A cadem ic Press, Inc.: N ew Y ork, N Y .
N onPoint Source Solutions, 1999. O re g o n W a th e rsh e d A ssessm e n t M a n u a l. G overnor’s W atershed E nhancem ent B oard: Salem , O R
Data Quality 4 - 1 Water Quality Monitoring Guidebook Version 2.0
C h a p te r 4
D ata Q u ality
B a ckg ro und
T he goal of data gathering is to produce data of a know n quality w hich is adequate for the intended use. E nvironm ental m onitoring often requires large investm ents of resources. Instituting techniques w hich protect that investm ent and insure that the data is valuable to other users is im portant.
T he m ethods used to elim inate flaw s and errors before they com prom ise the quality of the data collected are generally referred to as “ quality assurance” (see next page). T o insure that the data are credible, procedures m ust be docum ented, regular evaluations of precision and accuracy should be conducted, and regular, independent audits should also be conducted.
1 0 S tep s T o Q ua lity D a ta
Proper planning is the key to producing high quality data. T he ten steps described below are useful w hether a project w ill sam ple tw o sites on a sm all creek or 200 sites in a statew ide m onitoring netw ork.
1. D efine the goals and objectives of the project. W hy is the project needed? W hat question is being addressed? H ow w ill the data be used? W ho w ill use the data?
2. C ollect background inform ation about the project area.
3. R efine the project goals based on the background inform ation gathered.
4. D esign the project’s sam pling, analytical, and data requirem ents. T his is the “ w hat, how , w hen, and w here” of sam pling.
5. W rite an im plem entation plan that describes w hen tasks w ill be com pleted and w ho w ill com plete them .
6. W rite a draft project plan that includes sam pling m ethods and project objectives.
7. G et feedback on the draft plan from other professionals such as state agency m onitoring staff.
8. R evise the project plan based on review com m ents.
9. Im plem ent m onitoring w ork as described in the final m onitoring plan.
10. E valuate and refine the project over tim e as know ledge is acquired during the project.
K ey D a ta Q ua lity C o ncep ts
Q uality assurance (Q A ) and quality control (Q C ) are key com ponents of any m onitoring program . T hey are defined as:
Q uality A ssurance
T he overall m anagem ent system of a project including the organization, planning, data collection, quality control (Q C ), docum entation, evaluation, and reporting activities. Q A provides the inform ation needed to determ ine the data’s quality and w hether it m eets the project’s requirem ents.
Q uality C ontrol
T he routine technical activities intended prim arily to control errors. Since errors can occur in either the field, the laboratory, or in the office, Q C m ust be part of each of these activities.
A s part of Q A /Q C planning, certain data quality objectives need to be defined. T hese relate to th e p re c isio n , a c c u ra c y , rep re se n ta tio n , c o m p leten e ss, and co m p a ra b ility of the data.
Precision
Data Quality 4 - 2 Water Quality Monitoring Guidebook Version 2.0
collected at a num ber of sam ple sites. A s an exam ple, volunteers m ay w ish to collect one duplicate sam ple per trip or duplicate sam ples for 10% of the total sam ples collected, w hichever is greater. D uplicate sam ples should be collected during each sam pling trip. T he actual num ber of duplicates depends on the variability of the data and how precise the data m ust be to estim ate the actual w ater quality (E PA 1996).
A ccuracy
A ccuracy m easures how close the results are to a true or expected value. T his is norm ally
determ ined by m easuring a standard or reference sam ple of a know n am ount and com paring how far the results at the m onitoring site are from the reference value.
R epresentation
T o w hat extent do the field sam ples actually represent the true environm ental condition(s) or population(s) at the tim e a sam ple w as collected? R epresentation is largely determ ined by the selection of the sam ple sites. D o these sites accurately reflect (or represent) the conditions of the w aterbody being studied?
C om pleteness
T he com parison betw een the am ount of valid, or usable, data originally planned for collection, versus the am ount actually collected.
C om parability
T he degree to w hich different m ethods and data sets agree or are sim ilar. For instance, the W inkler titration m ethod for dissolved oxygen (a m ethod for m easuring the concentration of dissolved oxygen in w ater. See C hapter 7) and a polarographic probe (a different m ethod for m easuring dissolved oxygen) m ay not provide highly com parable data. T his is particularly im portant to determ ine w hen using data from other studies.
T he level of accuracy and precision w ill not be the sam e for each param eter m easured, and m ay not be the sam e for each project. Precision and accuracy w ill depend on the study objectives (i.e. how precise and accurate the data m ust be to answ er the questions of concern), the am ount of m oney available for equipm ent purchases and data analysis, and the level of training of the people
collecting sam ples. T he original data quality objectives m ay not be m et in a m onitoring project because funding can be cut (reducing the level of analysis), the equipm ent fails, or project personnel don’t perform as expected. If this occurs it is critical to report the data quality level attained and explain w hy.
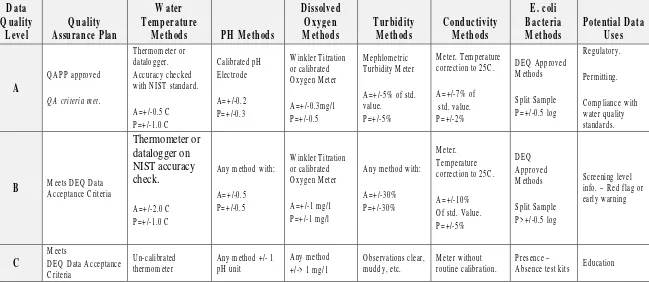
D a ta Q ua lity M a trix
D eterm ining the level of accuracy and precision desired at the project’s beginning is im portant. T able 4-1 has been developed to help determ ine the data quality objectives. T he table identifies three data quality levels for six com m only collected w ater quality param eters. T he purpose of the w ater quality data m atrix is to help collectors select the level of data quality that m eets their objectives, experience, level of expertise, and budget. D ata quality levels depend on the m ethods used and the Q A /Q C protocol follow ed.
L evel A
L evel A is the highest level of data quality. It can be used to assess com pliance w ith w ater quality standards, perm itting requirem ents, or other regulatory activities.
L evel B
L evel B is the next highest level. It is typically easier and less expensive to collect. L evel B data can be used as an early w arning of potential problem s or for screening inform ation. L evel C
L evel C is the low est data quality level and is norm ally the easiest to collect. B ecause of its low er accuracy and precision, L evel C data is best used for educational purposes.
N ot all field param eters w ill need to be at L evel A , or even L evel B , data quality. A principal decision for data collectors is to decide how the data w ill be used.
Data Quality 4 - 3 Water Quality Monitoring Guidebook Version 2.0
specific protocol chapters are generally designed to m eet L evel A data quality w ith appropriate
Q A /Q C . B ut, rem em ber w hat the data w ill be used for and determ ine w hat is the appropriate data quality level.
R eferences
Data Quality 4 -4 Water Quality Monitoring Guidebook Version 2.0
T able 4-1. W ater quality param eters by data quality level. D ata quality level depends on a com bination of quality control and m ethod selection.
D A T A Q U A L IT Y M A T R IX
W ater Q uality P aram eters by D ata Q uality L evel
D ata Q uality L evel depends on a com bination of quality control and m ethod selection.
D ata
W inkler T itration or calibrated O xygen M eter
A =+/-0.3m g/1 P =+/-0.5
M ephlom etric T urbidity M eter
A =+/-5% of std. value.
P =+/-5%
M eter. T em perature correction to 25C .
A =+/-7% of
W inkler T itration or calibrated correction to 25C .
A =+/-10%
M eter w ithout routine calibration.
P resence –
A bsence test kits E ducation
Data Storage and Analysis 5 - 1 Water Quality Monitoring Guidebook Version 2.0
C h apter 5
D ata Storage A nd A nalysis
C h apter 4 em ph asized th e im portan ce of in surin g data quality. If th e steps described in C h apter 4 h ave been taken to ach ieve th e desired level of data quality, th en th e m eth od of storin g an d an alyzin g th at data is equally im portan t. D ata properly stored an d an alyzed is essen tial if th e goal is to gath er credible data for use by volun teers, lan dow n ers an d agen cy person n el for m on itorin g, m an agem en t or regulatory purposes
Furth er, th e level of precision an d accuracy desired (see T able 4-1, C h apter 4) w ill in fluen ce th e ability to detect m ean in gful differen ces in th e data. For exam ple, if a calibrated th erm om eter is used in tem perature m on itorin g w ith a precision of ± 1 degree, th en it w ill n ot be useful in detectin g tem perature ch an ges of 0.5 degree (th e criteria for L evel A accuracy). D ata collectors, th erefore, n eed to be aw are of th e level of data quality th ey w an t to ach ieve as th ey develop th eir m on itorin g plan , purch ase or acquire equipm en t, an d an alyze th e data.
D ata sh ould be stored an d backed up on both th e com puter h ard drive an d disks. D ata files sh ould be clearly labeled for quick iden tification of w h at th e file con tain s.
W h at basic data sh ould be in cluded in files w ill vary depen din g on th e w ater quality param eter. In gen eral, in clude th e sam plin g poin t n am e an d n um ber, latitude an d lon gitude of th e site, stream n am e, an d w h en th e data w as collected by date, m on th an d year. A ttem ptin g to rem em ber th e particulars about h ow data w as collected m on th s later can be difficult; th erefore, en ter th e data as soon as possible. Som e of th e equipm en t used in th e follow in g protocols (tem perature m on itorin g probes) m ay actually create data files. It is im portan t to m ake sure th at th e dates an d tim es recorded in th ose files are correct.
D ata A nalysis
M akin g gen eralized com m en ts about data an alysis is difficult because such an alyses w ill vary greatly depen din g on th e particular question (s) asked an d w h at param eters are m easured. D ifferen t levels of an alysis can be appropriate for m ost param eters. G raph ical T ech n iques
G raph in g data is very useful an d im portan t for un derstan din g th e ch aracteristics of th e "data set" (i.e. th e total am oun t of data collected for a particular m on itorin g site or project) an d iden tifyin g an y poten tial relation sh ips. E xam ples in clude bar ch arts, X Y graph s, frequen cy distribution s, or pie ch arts.
For exam ple, by graph in g stream tem perature versus distan ce from a divide, an un derstan din g of basin tren ds can develop. B y graph in g stream tem perature versus tim e, an un derstan din g of w h en th e h igh est tem peratures occurred can be gain ed. T h is also provides a m ean s to ch eck th e data for accuracy. D escriptive Statistics
T h ese are th e very basic statistics th at describe a data set (for m ore in form ation on statistical an alysis, refer to th e m on itorin g m en tors listed on page 7 in C h apter 2). C om m on ly reported statistics are: m edian , average, m axim um , m in im um , an d stan dard deviation . B y graph in g th e average plus an d m in us th e stan dard deviation , data collectors begin to un derstan d th e distribution of th eir data. Statistical M eth ods
T h e presen tation of data in a valid scien tific m an n er requires th at a statem en t of th e in vestigator’ s con fiden ce in th at data be in cluded. Statistical m eth ods are th e tools used to sh ow w h at levels of con fiden ce, or th e am oun t of error, in vestigators h ave in th e data. A n um ber of statistical m eth ods or m odels are available for an alyzin g data.
Data Storage and Analysis 5 - 2 Water Quality Monitoring Guidebook Version 2.0
distributed (i.e. th e sets don ’ t reflect a n orm al “ bell sh aped” curve on a graph ) an d th erefore stan dard an alytical m eth ods m ay result in an alyses th at are flaw ed. T h ese problem s can often be addressed by logarith m ic or pow er tran sform ation s of th e data. N on -param etric m eth ods are also available (H irsch et al. 1992). Som e statistical an alyses in clude:
A N O V A , m ultiple an d lin ear regression , m ultivariate an alyses, an d correlation an alyses. Som e user-frien dly softw are packages are available to aid statistical an alyses. W ith out fam iliarity or train in g in statistical an alysis, h ow ever, h elp in developin g statistical m odels w ill be n eeded. C on tact on e of th e region al m on itorin g coordin ators listed on page 7 in C h apter 2 for furth er assistan ce.
W ater Q uality C riteria
O regon w ater quality criteria are provided on th e w eb at < h ttp://w aterquality.deq.state.or.us/w q/
w qrules/w qrules.h tm l> . T h ese criteria m ay be in term s of a seven -day m ovin g average of th e daily m axim um or m in im um tem peratures. Special con dition s m ay also be recogn ized w h ich n aturally cause w ater quality to exceed th e stan dards. For exam ple extrem e low stream flow s or prolon ged w arm periods can cause stream s to exceed state tem perature stan dards. It is useful to an alyze th e data collected an d com pare th e results to th e w ater quality criteria.
D epositing D ata
T h e O PSW M on itorin g T eam is curren tly explorin g option s for storage of th e m on itorin g data collected for th e O PSW . Som e of th e attach ed protocols con tain exam ple data sh eets. T h ese sh eets provide a tem plate for organ izin g th e data collected by volun teers in to a form at com patible w ith th e O PSW database. In gen eral, som e im portan t com pon en ts in clude:
• G lobal Position in g D ata Poin t or latitude an d lon gitude
• D ate of data collection • Stream n am e
• R espon sible party • Project objective • Site description • M on itorin g question • Param eters m easured
• M axim um s, m in im um s, averages
T h ese protocols w ill con form to th e
recom m en dation s for data storage th at are bein g developed an d w ill, in th e future, provide guidelin es for tran sportin g an d deliverin g th e data to th e O PSW database. A t a m in im um , guidelin es for th e data storage form at w ill be developed. T h ose w ish in g for addition al in form ation on progress w ith data storage issues sh ould con tact K elly M oore w ith th e O regon D epartm en t of Fish an d W ildlife (541-737-7623)
R eferences
H irsch , R .M ., H elsel, D .R ., C olin , T .A ., an d G ilroy, E .J. 1992. Statistical an alysis of h ydrologic data. In Ha rd wo o d o f h y d ro lo g y. [E d.] M aidm en t, D .R . M cG raw -H all, In c. C h apter 17
Stream Temperature Protocol 6 - 1 Water Quality Monitoring Guidebook Version 2.0
C h apter 6
Stream T em perature P rotocol
B ack ground
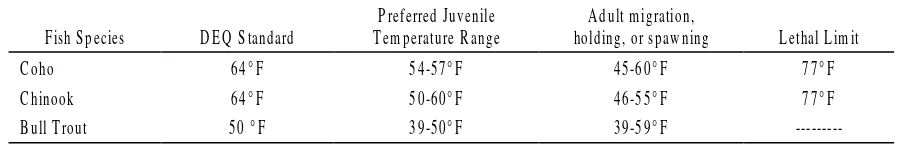
W ater tem perature is a key factor affectin g th e grow th an d survival of all aquatic organ ism s. T h e effect of stream tem perature on fish , am ph ibian s, m acroin vertebrates, etc. varies betw een species an d w ith in th e life cycle of a given species (A rm our 1991; B esch ta et al. 1987; B jorn n an d R eiser 1991; L an tz 1971; D E Q 1995). Preferred tem perature ran ges for m ajor fish species an d th eir particular life stages are sh ow n in T able 6-1.
In creases in stream tem perature cause an in crease in an organ ism ’ s m etabolic rate (W arren 1971). If en ough food is available, grow th rates can actually in crease w ith som e in crease in tem perature. For salm on ids, tem perature ran ges of 40-66° F support h ealth y grow th . O utside th is tem perature ran ge, salm on an d trout gen erally don ’ t grow in size, an d extrem e tem peratures can be leth al. R esearch h as foun d th at elevated stream tem peratures often result in in creased com petition for a lim ited food supply, w ith youn g salm on ids forced in to h abitat areas w h ere th ey are easier prey (R eeves, E verest an d H all 1987). A s food availability goes dow n , so does th e grow th rate. In addition , elevated stream tem peratures in crease th e risk of disease-related m ortality.
A s stream tem peratures in crease, th e am oun t of dissolved oxygen (D O )3available to aquatic biota decreases. A s a result, even if food is abun dan t at h igh er tem peratures, decreases in D O m ay m etabolically stress salm on ids, furth er in creasin g th eir susceptibility to disease.
W h en tem peratures reach stressful levels, pockets of cool w ater provide “ refugia” for fish an d am ph ibian species th at are sen sitive to h igh stream tem perature. C ool w ater refugia can sustain population s of sen sitive species (Sedell et al. 1990). C ool w ater h abitat can be sustain ed in deep pools, cold sprin gs, areas of groun dw ater in flow , an d at th e jun ction of cooler tributary stream s.
Stream tem perature h as been h eavily research ed an d m on itored (D E Q 1996; D issm eyer 1994). Studies h ave in vestigated th e effects of lan d m an agem en t on stream tem perature, developed m odels to predict stream tem perature, an d evaluated th e effects of elevated tem perature on aquatic biota. W h at follow s is a detailed
description of h ow to m on itor stream tem perature at m ultiple scales. P lease refer to previous c h a p te rs a n d A p p e n d ix B fo r in fo rm a tio n o n d e v e lo p in g a m o n ito rin g p la n , sele c tin g sites, a n d sto rin g d a ta .
3
Stream Temperature Protocol 6 - 2 Water Quality Monitoring Guidebook Version 2.0
T able 6-1. O ptim um and lethal lim it tem perature ranges for coho, chinook, and bull trout.
F ish S pecies D E Q S tandard
P referred Juvenile T em perature R ange
A dult m igration,
holding, or spaw ning L ethal L im it
C oho 64° F 54-57° F 45-60° F 77° F
C hinook 64° F 50-60° F 46-55° F 77° F
B ull T rout 50 ° F 39-50° F 39-59° F
---M entors
A s w ith an y m on itorin g project, question s w ill com e up th at are n ot an sw ered or covered sufficien tly in th is protocol. T h erefore, a group of m en tors th at are agen cy experts in m on itorin g h ave been iden tified. T h ese m en tors m ay be con tacted w ith specific question s about a particular m on itorin g effort.
Statew ide D E Q V olun teer M on itorin g C oordin ator K aren W illiam s: (503) 229-5983
E -m ail: w illiam s.karen @ deq.state.or.us N orth C oast
L arry C aton (503)229-5983; E -m ail: caton .larry@ deq.state.or.us South C oast & W illam ette
D en n is A des (503) 229-5983; E m ail: ades.den n is@ deq.state.or.us E astern O regon
L arry M arxer (503) 229-5983; E -m ail: m arxer.larry@ deq.state.or.us
E quipm ent
T em perature R ecorders
T em perature recorders in clude m axim um /m in im um th erm om eters, m ech an ical th erm ograph s, an d digital th erm ograph s or tem perature data loggers.
M ax/m in recordin g th erm om eters design ed for total im m ersion m ay be used, but require daily site visits durin g th e en tire sam plin g period. U se of m ax/m in data is also lim ited because it lacks in form ation about th e len gth of tim e w h en tem peratures w ere at or n ear th e m axim um . T h ey are th erefore n ot preferred in m ost w atersh ed studies.
M ech an ical th erm ograph s h ave been used successfully in w atersh ed studies. R eliability can be a problem for som e m ech an ical th erm ograph s an d th e data n eeds to be tran sferred from th e in strum en t to a database.
T em perature data loggers are th e preferred tem perature recorder for w atersh ed m on itorin g. T h ese data loggers h ave tem perature recorders th at can be set to record at regular in tervals (usually h ourly). T h is allow s th em to capture th e sh ape of th e w ater tem perature over a day. Sh orter tim e in tervals w ill m ore closely approxim ate th e m axim um for an y day. T h ese types of in strum en ts con tin uously record data for w eeks or even m on th s. T h is m akes it m ore likely to detect th e m axim um daily tem perature durin g th e critical stream tem perature season . D ata loggers also sign ifican tly reduce th e w ork load of th e person or group con ductin g th e m on itorin g because data can be directly dow n loaded to a com puter database. T h e cost of tem perature data loggers con tin ues to declin e w h ile th eir reliability an d ease of use con tin ues to im prove. A list of m an ufacturers w h o sell tem perature recorders an d th eir ph on e n um bers is provided in T able 6-2.
T able 6-2. T em perature recorder m anufacturers and their telephone num bers.
C om pany T elephone V em co (902) 852-3047 O nset (508) 759-9500
R yan (206) 883-7926
Stream Temperature Protocol 6 - 3 Water Quality Monitoring Guidebook Version 2.0
T em perature recorders sh ould h ave a an accuracy of approxim ately 0.3º C or better for L evel A quality data (See C h apter 4). T h is in form ation w ill be available from th e m an ufacturer.
L isted below are several useful m aterials an d pieces of equipm en t th at sh ould be taken to th e field to in stall or service tem perature probes.
• Securin g devices such as rebar, aircraft cables, locks, an d/or diver’ s w eigh ts
• Surveyors m arkin g tape • 2-poun d sledge h am m er • W ire cutters or pocket kn ife
• T em perature recordin g equipm en t requirem en ts (silicon e rin gs, subm ersible cases, silicon e grease, silica packets)
• Portable com puter an d in terface as n eeded by th e tem perature recorder if dow n loadin g an d laun ch in g w ill be com pleted in th e field • B ackup batteries an d tem perature recorders • T im epiece
• Field book • W aders
• C am era an d film
• M ach ete or oth er brush in g equipm en t • M aps an d aerial ph otos
• W ood or m etal stakes or spikes G lobal Position in g System D evice
• First aid kit an d person al ID
C alibration Vs. A ccuracy C heck