This report was compiled by Catherine Cameron,
Gemma Norrington-Davies and Dr. Victoria te Velde of
Agulhas: Applied Knowledge, with the guidance of
Dr. Tom Mitchell, Overseas Development Institute.
The authors would like to thank the following reviewers for their support and comments: Mairi Dupar, Katie Harris, Amy Kirbyshire, Maarten van Aalst, Mihir Bhatt and Salmah Zakaria. Also to Neville Nicholls, Elizabeth Colebourn and Kris Ebi for their assistance with the wider series of summaries.
This document should be referenced as follows: Climate and Development Knowledge Network (2012) Managing climate extremes and disasters in Asia: Lessons from the SREX report. CDKN, available online at www.cdkn.org/srex.
All correspondence should be addressed to:
Dr. Tom Mitchell
Overseas Development Institute E: [email protected]
1. Introduction to the Special Report
01
2. Changing disaster risks
03
3. Future impacts
12
4. Managing the risks of climate extremes and disasters
14
5. Conclusions: What does this mean for decision makers in Asia?
17
IPCC SREX Glossary of Terms
20
1. Introduction to the Special Report
1.1 About the
SREX report
The Special Report on Managing the Risks of Extreme Events and Disasters to Advance Climate Change Adaptation (SREX) was commissioned by the Intergovernmental Panel on Climate Change (IPCC) in response to a recognised need to provide specific advice on climate change, extreme weather and climate events (‘climate extremes’). The SREX report was written over two and a half years, compiled by 220 expert authors, 19 review editors and taking account of almost 19,000 comments. It went through three rigorous drafting processes with expert and government review. The findings were approved by the world’s governments following a four-day meeting, where the Summary for Policy Makers was agreed. It thus provides the best scientific assessment available to date. It comprises a policy summary released in November
2011 and the full report released in March 2012 (available online at http://ipcc-wg2.gov/srex).
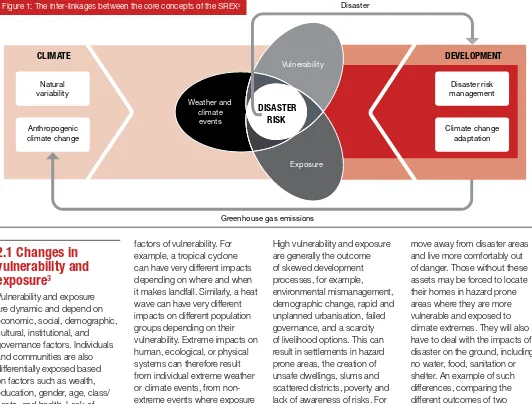
This summary highlights the key findings of the report from an Asian perspective, including an assessment of the science and the implications of this for society and sustainable development. The SREX report considers the effects of climate change on extreme events, disasters, and disaster risk management (DRM). It examines how climate extremes, human factors and the environment interact to influence disaster impacts and risk management and adaptation options (see Figure 1). The SREX report considers the role of development in exposure and vulnerability, the implications for disaster risk, and the interactions between disasters and development. It examines how human responses to extreme events and disasters could contribute to adaptation objectives, and how adaptation to climate change could
1. Highlights are derived and extended from a note by Dr. Tom Mitchell, Overseas Development Institute and Dr. Maarten van Aalst, Red Cross/Red Crescent Climate Centre available at http://cdkn.org/2011/11/ipcc-srex.
become better integrated with DRM practice. The SREX report represents a significant step forward for the integration and harmonisation of the climate change adaptation, disaster risk management and climate science communities.
1.3 The implications
of this for Asia
are as follows:
y There is a need for countries to reassess their vulnerability and exposure in order to better manage disaster risk. This needs to be fully integrated into planning processes, including e.g. through improved continuous data collection for vulnerability and exposure to changing floods and cyclones. y There is a need for new
and better disaster risk
assessments that take climate change into account, which may require countries and people to reassess their thinking on what levels of risk they are willing and able to accept.
y It will be important to strengthening new and existing partnerships for reducing risk, e.g. including with the private sector and bilateral and multilateral agencies. Mutual learning within Asia will be important. y There is a need to strengthen
the integration of financial and
and effectively prepare for and manage disaster impact in a changing climate. An example is the introduction of index-based insurance for non-irrigated crops in Andhra Pradesh. This balance will require a stronger emphasis on anticipation and risk reduction.
7. Existing risk management measures need to be improved as many countries are poorly adapted to current extremes and risks, so are not prepared for the future. This would include a wide range of measures such as early warning systems, land use planning, development and enforcement of building codes, improvements to health surveillance, or ecosystem management and restoration. Indonesia’s 2007 Disaster Management Law for example, has created a stronger association between DRM and development planning processes.
8. Countries’ capacity to meet the challenges of observed
1.2 Ten Key Messages
Key summary messages from the IPCC Special Report on Managing the Risks of Extreme Events and Disasters to Advance Climate Change Adaptation for the Asia region:1
1. Even without taking climate change into account, disaster risk will continue to increase in many countries as more vulnerable people and assets are exposed to weather extremes. In absolute terms for example, Asia already has more than 90% of the global population exposed to tropical cyclones.
2. Based on data since 1950, evidence suggests that climate change has changed the magnitude and frequency of some extreme weather and climate events in some global regions already.
3. In the next two or three decades, the expected increase in climate extremes will probably be relatively small compared
to the normal year-to-year variations in such extremes. However, as climate change impacts become more dramatic, its effect on a range of climate extremes in Asia will become increasingly important and will play a more significant role in disaster impacts.
4. There is better information on what is expected in terms of changes in extremes in various regions and sub-regions, rather than just globally (see Table 1 and Figure 2); though for some regions and some extremes uncertainty remains high (e.g. drought trends across most of Asia).
5. High levels of vulnerability, combined with more severe and frequent weather and climate extremes, may result in some places in Asia, such as low lying islands and coastal areas, being increasingly difficult places in which to live and work.
6. A new balance needs to be struck between measures to reduce risk, transfer risk (e.g. through insurance)
and projected trends in disaster risk is determined by the effectiveness of their national risk management system. Such systems include national and sub-national governments, the private sector, research bodies, and civil society including community-based organisations. In Bangladesh the government has worked in partnership with donors, NGOs, humanitarian organisations and with coastal
communities themselves to implement DRR efforts for tropical cyclones.
9. More fundamental adjustments are required to avoid the worst disaster losses and tipping points where vulnerability and exposure are high, capacity is low and weather and climate extremes are changing.
10. Any delay in greenhouse gas mitigation is likely to lead to more severe and frequent climate extremes in the future and will likely further contribute to disaster losses.
programming mechanisms to support adaptation and risk management across development sectors. y It will be important to highlight
changing climate-related disaster risks to policy makers working in other policy domains.
y There is a need to reaffirm the importance of mitigating greenhouse gases globally in order to avoid the worst climate extremes and their associated impacts across Asia.
y There must be consideration
that in some cases today’s climate extremes will be tomorrow’s ‘normal’ weather. Tomorrow’s climate extremes may therefore stretch our imagination and challenge our capacity to manage change as never before.
Greenhouse gas emissions
Vulnerability
Exposure Weather and
climate events
DISASTER RISK
Anthropogenic climate change
Disaster risk management
Climate change adaptation Disaster
Natural variability
DEVELOPMENT CLIMATE
2. Changing disaster risks
This section looks at the components of changing disaster risk in more detail. The inter-linkages between
the core concepts discussed in the SREX report are illustrated in Figure 1. This shows how both changes in
vulnerability and exposure and changes in weather and extreme climate events can contribute and combine to
create disaster risk, hence the need for both disaster risk management (DRM) and climate change adaptation
(CCA) within development processes.
Figure 1: The inter-linkages between the core concepts of the SREX2
2.1 Changes in
vulnerability and
exposure
3Vulnerability and exposure are dynamic and depend on economic, social, demographic, cultural, institutional, and governance factors. Individuals and communities are also differentially exposed based on factors such as wealth, education, gender, age, class/ caste, and health. Lack of resilience and capacity to anticipate, cope with and adapt to extremes are important
factors of vulnerability. For example, a tropical cyclone can have very different impacts depending on where and when it makes landfall. Similarly, a heat wave can have very different impacts on different population groups depending on their vulnerability. Extreme impacts on human, ecological, or physical systems can therefore result from individual extreme weather or climate events, from non- extreme events where exposure and vulnerability are high, or from a compounding of events or their impacts.
High vulnerability and exposure are generally the outcome of skewed development processes, for example, environmental mismanagement, demographic change, rapid and unplanned urbanisation, failed governance, and a scarcity of livelihood options. This can result in settlements in hazard prone areas, the creation of unsafe dwellings, slums and scattered districts, poverty and lack of awareness of risks. For example, those with awareness, transferable livelihoods, money and access to transport can
move away from disaster areas and live more comfortably out of danger. Those without these assets may be forced to locate their homes in hazard prone areas where they are more vulnerable and exposed to climate extremes. They will also have to deal with the impacts of disaster on the ground, including no water, food, sanitation or shelter. An example of such differences, comparing the different outcomes of two cyclones in Southern Asia, is shown in Box 1.
2. Lavell, A., M. Oppenheimer, C. Diop, J. Hess, R. Lempert, J. Li, R. Muir-Wood, and S. Myeong, 2012: Climate change: new dimensions in disaster risk, exposure, vulnerability, and resilience. In: Managing the Risks of Extreme Events and Disasters to Advance Climate Change Adaptation [Field, C.B., V. Barros, T.F. Stocker, D. Qin, D.J. Dokken, K.L. Ebi, M.D. Mastrandrea, K.J. Mach, G.-K. Plattner, S.K. Allen, M. Tignor, and P.M. Midgley (eds.)]. A Special Report of Working Groups I and II of the Intergovernmental Panel on Climate Change (IPCC). Cambridge University Press, Cambridge, UK, and New York, NY, USA, pp. 25-64.
4. Moench & Dixit, 2004
5. Draws on material from SREX Chapter 3, Nicholls. N. et al, ‘Changes in Climate Extremes and their Impacts on the Natural Physical Environment’.
Cyclones in Southern Asia
In November 2007, Cyclone Sidr made landfall in Bangladesh causing almost 4,200 fatalities. Cyclone Nargis hit Myanmar in May 2008 and caused over 138,000 fatalities, making it the eighth deadliest cyclone ever recorded. Sidr and Nargis were both Category 4 cyclones of similar severity; affecting coastal areas with comparable numbers of people exposed. However, these two comparable events had vastly different impacts.
The Government of Bangladesh has made serious efforts aimed at disaster risk reduction (DRR) from tropical cyclones. It has worked in partnership with donors, NGOs, humanitarian organisations and, most importantly, with coastal communities themselves. With a sevenfold increase of cyclone shelters and twofold increase of volunteers, 1.5 million people were safely evacuated prior to landfall of Sidr in 2007.
In contrast to Bangladesh, Myanmar has very little experience with powerful tropical cyclones, so did not have a comprehensive disaster management programme in place. Bangladesh has, since 1972, developed a holistic approach to disaster management, codified in the Standing Order on Disasters, this now includes early warning systems, community based mobilisation, coupled with operating procedures in place defining the response at every level of government.
The landfall of Nargis was the first time in recorded history that Myanmar experienced a cyclone of such a magnitude and severity. Despite Nargis being both slightly less powerful and affecting fewer people than Sidr, it resulted in human losses 32 times higher. This clearly demonstrates that climate change adaptation efforts can be effective in limiting the impacts from extreme tropical cyclone events through DRR and the importance of considering experience and governance contexts as factors affecting vulnerability and exposure to weather extremes.
y The quality of information will differ between global, regional and local scales.
y There will be differences in what the science can say about extremes, e.g. the links between rises in temperature and sea level rise are more clear than the links between rises in temperature and an increase in frequency or intensity of storms.
y Variability is always important. Climate trends are usually only one factor in the probability of hazards – in some regions and for some decisions, seasonal variability may be more important than long-term trends.
y For decisions affecting just the next decade, it may be more important to think about what has changed already and what the near term range of variability is, rather than what will happen in the coming century.
y In many cases, all we know is that risks are rising, because uncertainty is increasing, with sometimes some hints on future trends or ranges of uncertainty – there is seldom specific information on precise future probabilities of particular extremes.
y These factors should be considered when reviewing climate science for decision- and policy-making. However, uncertainty should not be used as a reason for inaction with regard to investing in reducing vulnerability and exposure. SREX provides enough information to show that more people and assets are in harm’s way and much more can be done to reduce exposure, vulnerability and risk.
Box 1: An example of different impacts depending on vulnerability and exposure
Box 2: What can policy makers expect from climate science?
In absolute terms, Asia has over 90% of the global population exposed to tropical cyclones. Although only 15% of world tropical cyclones occur in the North Indian Ocean, they account for 86% of the mortalities. There is strong evidence that weather-related mortality risk is highly concentrated in countries with low GDP and weak governance. For example, many of the countries exposed to tropical cyclones in the North Indian Ocean are characterised by high population density, vulnerability and low GDP. Studies indicate that the extent of the vulnerability to climate variability and climate change is shaped by both the dependence of the national economy and livelihoods on climate-sensitive natural resources and the resilience or robustness of the country’s social institutions to equitable distribution of resources under climate change.
A study in South Asia4 suggests
that adaptive capacity and livelihood resilience depend on social capital at the household level (education and other factors that enable individuals to function within a wider economy), the presence or absence of local enabling institutions (local cooperatives, banks, self-help groups), and the larger physical and social infrastructure that enables goods, information, services and people to flow. Interventions to catalyze effective adaptation are important at all these multiple levels.
Changing patterns of vulnerability and exposure are a key driver of risk and disaster losses. Understanding the multi-faceted nature of both exposure and vulnerability is a prerequisite for determining how weather
and climate events contribute to the occurrence of disasters, and for designing and implementing effective adaptation and disaster risk management strategies. Decision and policy making therefore needs to be based on the nature of vulnerability and exposure and not only on the hazard itself.
2.2 Changes in
extreme events
Defining climate
extremes
5A changing climate leads to changes in the frequency, intensity, spatial extent and duration of weather and climate
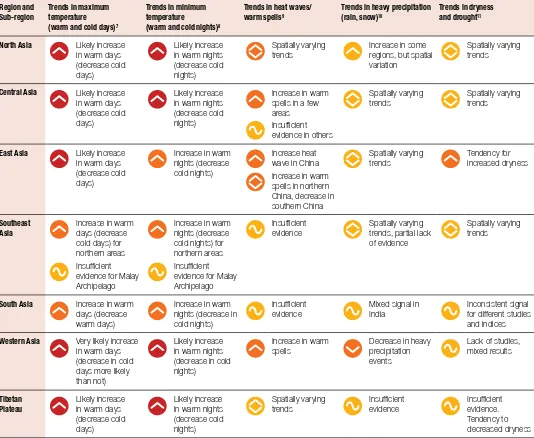
Table 1 shows observed changes in temperature and precipitation extremes, including dryness in regions of Asia since 1950, with the period 1961-1990 used as a baseline (see box 3.1 in Chapter 3 of SREX for more information).
2.3 Changes in
climate extremes
affecting the region
The SREX provides robust scientific information on what can be expected from changes in weather and climate extremes in various regions and sub-regions of Asia. A summary of this information is captured in Table 1 and 2.
Table 1: Observed changes in temperature and precipitation extremes since the 1950s6
Region and Sub-region
Trends in maximum temperature (warm and cold days)7
Trends in minimum temperature (warm and cold nights)8
Trends in heat waves/ warm spells9
Trends in heavy precipitation (rain, snow)10
Trends in dryness and drought11
North Asia Likely increase in warm days (decrease cold days)
Likely increase in warm nights (decrease cold nights)
Spatially varying trends
Increase in some regions, but spatial variation
Spatially varying trends
Central Asia Likely increase in warm days (decrease cold days)
Likely increase in warm nights (decrease cold nights)
Increase in warm spells in a few areas
Insufficient evidence in others
Spatially varying trends
Spatially varying trends
East Asia Likely increase in warm days (decrease cold days)
Increase in warm nights (decrease cold nights)
Increase heat wave in China
Increase in warm spells in northern China, decrease in southern China
Spatially varying trends
Tendency for increased dryness
Southeast Asia
Increase in warm days (decrease cold days) for northern areas
Insufficient evidence for Malay Archipelago
Increase in warm nights (decrease cold nights) for northern areas
Insufficient evidence for Malay Archipelago
Insufficient evidence
Spatially varying trends, partial lack of evidence
Spatially varying trends
South Asia Increase in warm days (decrease warm days)
Increase in warm nights (decrease in cold nights)
Insufficient evidence
Mixed signal in India
Inconsistent signal for different studies and indices
Western Asia Very likely increase in warm days (decrease in cold days more likely than not)
Likely increase in warm nights (decrease in cold nights)
Increase in warm spells
Decrease in heavy precipitation events
Lack of studies, mixed results
Tibetan Plateau
Likely increase in warm days (decrease cold days)
Likely increase in warm nights (decrease cold nights)
Spatially varying trends
Insufficient evidence
Insufficient evidence. Tendency to decreased dryness
Symbols
Increasing trend
Decreasing trend
Varying trend
Inconsistent trend/insufficient evidence
No or only slight change
Level of confidence in findings
Low confidence
Medium confidence
High confidence
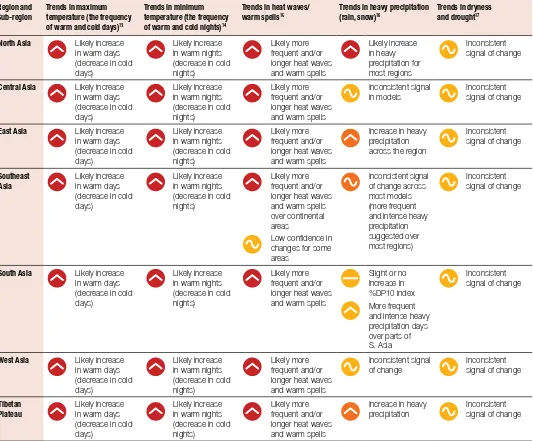
Table 2 shows projected changes in temperature and precipitation extremes, including dryness, in Asia. The projections are for the period 2071-2100 (compared with 1961-1990) or 2080-2100 (compared with 1980-2000) and are based on GCM and RCM12 outputs run under the A2/A1B emissions scenario.
Table 2: Projected changes in temperature and precipitation extremes, including dryness, in Asia
6. Period 1961-1990 used as a baseline.
7. Refers to the number of warm days and cold days with maximum temperature above or below extreme values, e.g. the 90th/10th percentile with respect to the 1961-1990 reference period.
8. Refers to the number of warm nights and cold nights with minimum temperature above or below extreme values, e.g. the 90th/10th percentile with respect to the 1961-1990 reference period.
9. Warm spell refers to periods of at least six days where maximum temperature values exceed the 90th percentile with respect to the 1961-1990 reference period. 10. Refers to the number of days with precipitation above an extreme value, e.g. the 90th percentile, with respect to the 1961-1990 reference period.
11. Dryness is calculated in relation to a number of variables including: number of consecutive dry days (dry is defined as daily precipitation with <1 mm); soil moisture anomalies; and drought severity index Dryness refers to a hydro-meteorological water deficit, whereas drought is extended and continuous water shortage. More information is given in Box 3.3 of Chapter 3 in the SREX report.
12. GCM refers to Global Circulation Model, RCM refers to Regional Climate Model.
13. Refers to the number of warm days and cold days with maximum temperature above or below extreme values e.g. the 90th/10th percentile in 2071-2100 with respect to the 1961-1990 reference period.
14. Refers to the number of warm nights and cold nights with temperature extremes above or below extreme values, e.g. the 90th/10th percentile in 2071-2100 with respect to the 1961-1990 reference period.
15. Warm spell refers to periods of at least six days where extreme temperature values exceed the 90th percentile in 2071-2100, with respect to the 1961-1999 reference period. 16. Refers to the number of days with precipitation above an extreme value, e.g. the 95th percentile, or above 10mm in one day in 2071-2100, with respect to the 1961-1990
reference period.
17. Dryness is calculated in relation to a number of variables including: number of consecutive dry days (dry is defined as daily precipitation with <1 mm); soil moisture anomalies; and drought severity index Dryness refers to a hydro-meteorological water deficit, whereas drought is extended and continuous water shortage. More information is given in Box 3.3 of Chapter 3 in the SREX report.
Region and Sub-region
Trends in maximum temperature (the frequency of warm and cold days)13
Trends in minimum temperature (the frequency of warm and cold nights)14
Trends in heat waves/ warm spells15
Trends in heavy precipitation (rain, snow)16
Trends in dryness and drought17
North Asia Likely increase in warm days (decrease in cold days)
Likely increase in warm nights (decrease in cold nights)
Likely more frequent and/or longer heat waves and warm spells
Likely increase in heavy precipitation for most regions
Inconsistent signal of change
Central Asia Likely increase in warm days (decrease in cold days)
Likely increase in warm nights (decrease in cold nights)
Likely more frequent and/or longer heat waves and warm spells
Inconsistent signal in models
Inconsistent signal of change
East Asia Likely increase in warm days (decrease in cold days)
Likely increase in warm nights (decrease in cold nights)
Likely more frequent and/or longer heat waves and warm spells
Increase in heavy precipitation across the region
Inconsistent signal of change
Southeast Asia
Likely increase in warm days (decrease in cold days)
Likely increase in warm nights (decrease in cold nights)
Likely more frequent and/or longer heat waves and warm spells over continental areas
Low confidence in changes for some areas
Inconsistent signal of change across most models (more frequent and intense heavy precipitation suggested over most regions)
Inconsistent signal of change
South Asia Likely increase in warm days (decrease in cold days)
Likely increase in warm nights (decrease in cold nights)
Likely more frequent and/or longer heat waves and warm spells
Slight or no increase in %DP10 index
More frequent and intense heavy precipitation days over parts of S. Asia
Inconsistent signal of change
West Asia Likely increase in warm days (decrease in cold days)
Likely increase in warm nights (decrease in cold nights)
Likely more frequent and/or longer heat waves and warm spells
Inconsistent signal of change
Inconsistent signal of change
Tibetan Plateau
Likely increase in warm days (decrease in cold days)
Likely increase in warm nights (decrease in cold nights)
Likely more frequent and/or longer heat waves and warm spells
Increase in heavy precipitation
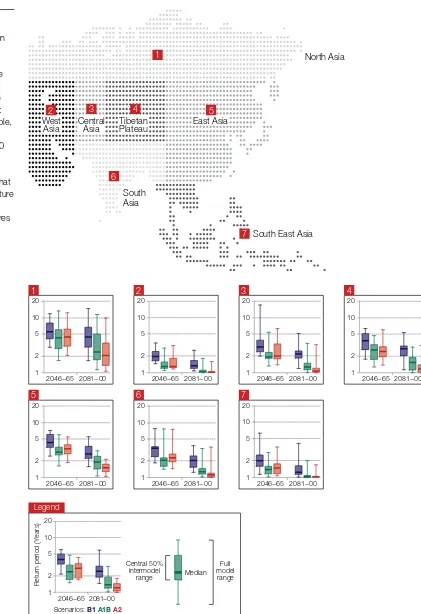
Figure 2: Projected return period (in years) of late 20th century 20-year return values of annual maximum (a) of the daily maximum temperature; and (b) 24-hour precipitation rates18
(a) Temperature
These graphs show how often the hottest day in the last 20 years of the 20th century will be experienced by the middle and end of the 21st century. These are shown under three different emissions scenarios: B1, A1B and A2.19 For example,
in Western Asia, the hottest day experienced in the last 20 years at the end of the 20th century will occur annually or biannually by 2046-65. So what are now considered temperature extremes will become much more like ‘normal’ temperatures in less than 50 years time.
2046−65 2081−00 1
2 5 10 20 1
2046−65 2081−00 1
2 5 10 20 3
2046−65 2081−00 1
2 5 10 20
5
2046−65 2081−00 1
2 5 10 20 7
2046−65 2081−00
1 2 5 10 20
Scenarios: B1A1BA2
Return period (Years)
Central 50% intermodel
range
Full model range Median
Legend
2046−65 2081−00 1
2 5 10 20 2
2046−65 2081−00 1
2 5 10 20 4
2046−65 2081−00 1
2 5 10 20 6
North Asia
South East Asia South
Asia Tibetan
Plateau East Asia
Central Asia West
Asia
1
2 3 4 5
6
7
2046−65 2081−00 3
5 10 40 50
Scenarios: B1A1BA2
Return period (Years)
Central 50% intermodel
range
Full model range Median
Legend
(b) Precipitation
These graphs show how often the wettest day in the last 20 years of the 20th century will be experienced by the middle and end of the 21st century. These are shown under three different emissions scenarios: B1, A1B and A2.20 For example, in East
Asia and the Tibetan Plateau, the wettest day experienced in the last 20 years at the end of the 20th century will happen more like every 10 years by the end of the 21st Century depending on which emissions scenario is followed.
2046−65 2081−00 3
5 10 20 50 1
2046−65 2081−00 3
5 10 20 50 3
2046−65 2081−00 3
5 10 20 50 5
2046−65 2081−00 3
5 10 20 50
2.4
7 2046−65 2081−00
3 5 10 20 50
53
2
2046−65 2081−00 3
5 10 20 50 4
2046−65 2081−00 3
5 10 20 50 6
North Asia
South East Asia South
Asia Tibetan
Plateau East Asia
Central Asia West
Asia
1
2 3 4 5
6
7
19, 20. These refer to three of the six possible IPCC emissions scenario groups used throughout their reports.
B1 describes a convergent world with rapid changes towards a service and information economy and introduction of clean and resource efficient technologies.
A1B describes rapid economic development and growth, with balanced technological development across all sources. i.e. neither fossil intensive nor all non-fossil sources. A2 is a heterogeneous world with self reliance and local identity, regional economic development, fragmented and slower growth. See www.ipcc.ch/pdf/special-reports/spm/
y The number of natural catastrophes in Asia has risen from under 100 in 1980 to over 300 in 2010. The largest growth is in hydrological events e.g. flooding and mass movement.
y Between 1980 and 2010 Asia experienced 4,950 weather related catastrophes, more than any other continent over the same period.
y Between 1980 and 2010 Asia has suffered 51% of the world’s reported fatalities from natural catastrophes (1.16 million people).
y In the first 9 months of 2011 80% of all economic losses from natural disasters occurred in Asia Pacific.
Source: Münchener Rückversicherungs-Gesellschaft, Geo Risks Research, NatCatSERVICE, 2011.
Box 3: Extreme weather events in Asia – beyond SREX
Observations and projections of trends in the monsoon and tropical cyclones and other relevant extremes are given in Table 3.
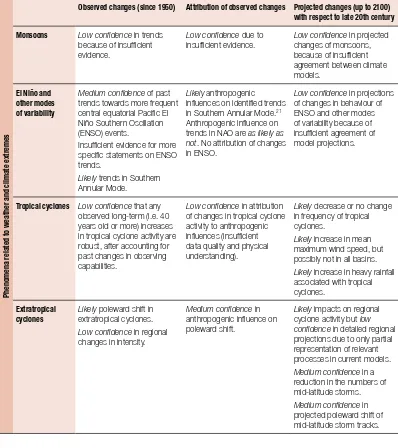
Table 3: Overview of considered extremes and summary of observed and projected changes on global scale
Phenomena related to weather and c
limate e
xtremes
Observed changes (since 1950) Attribution of observed changes Projected changes (up to 2100) with respect to late 20th century Monsoons Low confidence in trends
because of insufficient evidence.
Low confidence due to insufficient evidence.
Low confidence in projected changes of monsoons, because of insufficient agreement between climate models.
El Niño and other modes of variability
Mediumconfidence of past trends towards more frequent central equatorial Pacific El Niño Southern Oscillation (ENSO) events.
Insufficient evidence for more specific statements on ENSO trends.
Likely trends in Southern Annular Mode.
Likely anthropogenic influences on identified trends in Southern Annular Mode.21 Anthropogenic influence on trends in NAO are as likely as not. No attribution of changes in ENSO.
Low confidence in projections of changes in behaviour of ENSO and other modes of variability because of insufficient agreement of model projections.
Tropical cyclones Lowconfidence that any observed long-term (i.e. 40 years old or more) increases in tropical cyclone activity are robust, after accounting for past changes in observing capabilities.
Lowconfidence in attribution of changes in tropical cyclone activity to anthropogenic influences (insufficient data quality and physical understanding).
Likely decrease or no change in frequency of tropical cyclones.
Likely increase in mean maximum wind speed, but possibly not in all basins.
Likely increase in heavy rainfall associated with tropical cyclones.
Extratropical cyclones
Likely poleward shift in extratropical cyclones.
Lowconfidence in regional changes in intensity.
Mediumconfidence in anthropogenic influence on poleward shift.
Likely impacts on regional cyclone activity but low confidence in detailed regional projections due to only partial representation of relevant processes in current models.
Mediumconfidence in a reduction in the numbers of mid-latitude storms.
Mediumconfidence in projected poleward shift of mid-latitude storm tracks.
2.4 Consequences of
climate extremes
22This section builds on the information presented in Tables 1 and 2 and Figure 2 to highlight how climate extremes could affect Asia. It provides examples of the consequences and impacts that arise from a sample of climate extremes common to the Asia region. The science base also shows how incremental climate-related impacts, rather than extreme events per se, can have extreme consequences where vulnerability is high.
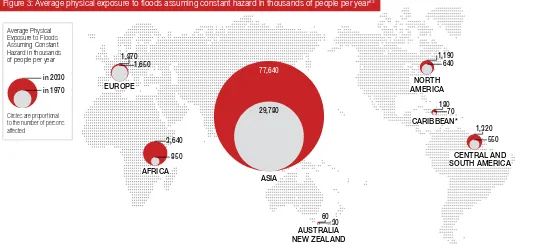
Floods: Pakistan’s 2010 floods left an estimated 6 million people in need of shelter. Urban poor populations often experience increased rates of infectious disease after flood events, for example after the July 2005 floods in Mumbai the prevalence of leptospirosis rose eight-fold. In Dhaka, Bangladesh, severe flooding in 1998 was associated with an increase in diarrhoea;
with the risk of non-cholera diarrhoea being higher among those from a lower socio-economic group unable to use tap water. Exposure to flooding in 1970, with projections to 2030, are shown in Figure 3, highlighting particular exposure for Asia.
Heat stress: Heat extremes can claim casualties in tropical countries, even where people are acclimatised to a hot climate. A study of the relationship between daily temperature and mortality in mid- and low-income countries found that higher mortality was observed on very hot days in most cities, including tropical cities, such as Bangkok, Dhaka and Delhi. Persons living in informal settlements and structures are more exposed to high temperatures.
Drought: Prolonged drought in Syria (2008-2011) has affected 1.3 million people. The loss of the 2008 harvest has accelerated migration to urban areas and increased levels of
22. Draws on material from SREX Chapter 4, Handmer, J. et al, ‘Changes in Impacts of Climate Extremes: Human Systems and Ecosystems’.
in 2030 in 1970
Circles are proportional to the number of persons affected
Average Physical Exposure to Floods Assuming Constant Hazard in thousands of people per year
*Only catchments bigger than 1,000 km2 were included in this analysis. Therefore, only the largest islands in the Caribbean are covered.
29,780
Figure 3: Average physical exposure to floods assuming constant hazard in thousands of people per year23 extreme poverty. This has put pressure on water resources with deficit exceeding 3.5 billion cubic meters in recent years due to growing water demands and drought.
Dzud is a compound hazard occurring in Mongolia’s cold dry climate that encompasses drought, heavy snowfall, extreme cold and windstorms. It lasts all year round and causes dramatic socioeconomic impacts, including significant loss of livestock, unemployment, poverty and mass migration from rural to urban areas, giving rise to heavy pressure on infrastructure, and social and ecosystem services.
Tropical cyclones: Damages from tropical cyclones are perhaps most commonly associated with extreme wind, but storm-surge and fresh-water flooding from extreme rainfall generally cause the great majority of damage and loss of life. Extreme strong winds damage buildings, infrastructure
and other assets, torrential rains cause floods and landslides, and high waves and storm surge lead to coastal flooding and erosion, all of which have major impacts on people. For example, Cyclone Nargis, which hit Myanmar in May 2008, caused over 138,000 fatalities. Projected sea level rise is expected to further compound tropical cyclone surge impacts. Asia is particularly exposed as Figure 4 illustrates.
30 100
CENTRAL AND SOUTH AMERICA
50 100
AUSTRALIA NEW ZEALAND
4,870
NORTH AMERICA
2,610
AFRICA 500 2,280
ISLANDS Indian Ocean, Pacific Ocean,
Caribbean and other Islands 1,910 3,490 in 2030
in 1970
Circles are proportional to the number of persons affected
Average Physical Exposure to Tropical Cyclones Assuming Constant Hazard in thousands of people per year
125,950
ASIA 68,000
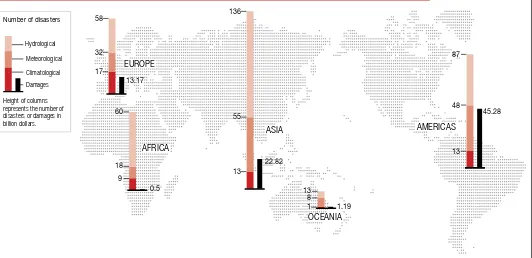
Height of columns represents the number of disasters or damages in billion dollars. Number of disasters
Meteorological
Climatological Hydrological
Damages
0.5 9
18 60
AFRICA
55
22.82 13
136
ASIA
45.28 87
13 48
AMERICAS
1 8 13
1.19 OCEANIA 13.17
17 32 58
EUROPE
Figure 4: Average physical exposure to tropical cyclones, assuming constant hazard, in thousands of people per year24
Figure 5: Weather and climate related disasters and regional average impacts (damages in US$ billion) from 2000-200825,26
23, 24, 25. Handmer, J., Y. Honda, Z.W. Kundzewicz, N. Arnell, G. Benito, J. Hatfield, I.F. Mohamed, P. Peduzzi, S. Wu, B. Sherstyukov, K. Takahashi, and Z. Yan, 2012: Changes in impacts of climate extremes: human systems and ecosystems. In: Managing the Risks of Extreme Events and Disasters to Advance Climate Change Adaptation [Field, C.B., V. Barros, T.F. Stocker, D. Qin, D.J. Dokken, K.L. Ebi, M.D. Mastrandrea, K.J. Mach, G.-K. Plattner, S.K. Allen, M. Tignor, and P.M. Midgley (eds.)]. A Special Report of Working Groups I and II of the Intergovernmental Panel on Climate Change (IPCC). Cambridge University Press, Cambridge, UK, and New York, NY, USA, pp. 231-290.
3. Future impacts
This section looks ahead to explore the range of possible future impacts for the region, considering points 3, 4
and 5 in the key messages (section 1.2) in more detail.
Impacts of extremes
on human systems
and eco systems
As shown in section 2, climate extremes may result in a broad range of impacts on both human and ecosystems including economic losses, impacts on different sectors such as tourism and agriculture, on urban settlements and on small island states. The severity of these impacts will depend strongly on the level of exposure and vulnerability to climate extremes. Collectively such impacts can also have a significant adverse affect on the population and can harm national, regional and global development. Some examples are provided below.3.1 Increasing
economic losses
27There is high confidence that economic losses from weather and climate related disasters are increasing, albeit with large inter-annual variability. Increasing exposure of people and economic assets has
been a major cause. Whilst measured economic losses from disasters are largest in developed countries, there is high confidence that fatality rates and economic losses as a proportion of GDP are higher in developing countries. The largest absolute adaptation costs are expected in East Asia and the Pacific, followed by the Latin American and Caribbean region as well as sub-Saharan Africa. In the period 2000-2008, Asia experienced the highest number of weather- and climate-related disasters.
Increases in exposure will result in higher direct economic losses from tropical cyclones. In July 2005, Mumbai, India, was struck by the largest storm in its recorded history. A week of heavy rain disrupted water, sewer, drainage, transport, power, and telecommunications systems. As a result of this ‘synchronous failure’, Mumbai-based ATM banking systems ceased working across much of the country, and the Bombay and National Stock Exchanges
were temporarily forced to close. This demonstrates that within megacities, risk and loss are both concentrated and also spread through networks of critical infrastructure as well as connected economic systems.
3.2 Sector
vulnerability
28Extreme events have the greatest impacts on sectors that are closely linked with or dependent on the climate, for example water, agriculture and food security, forestry, health and tourism. There is high confidence that changes in the climate could seriously affect water management systems. Climate extremes also have large adverse impacts on infrastructure, e.g. roads cracking, railways buckling, and flooding of airports, particularly in coastal areas. Coastal inundation due to storm surges and floods can affect terminals, freight villages, storage areas, and cargo, and disrupt supply chains and transport. This may
have far reaching implications for international trade, as more than 80% of global trade in goods (by volume) is carried by sea. The economic viability of for example, the Chinese coastal zone – home to many multinational companies producing a large share of consumer goods globally – is highly exposed to typhoon risk and will increasingly depend on well implemented DRR mechanisms. The tourism sector is also sensitive to the climate; particularly given that climate is a key factor in tourism demand. Agriculture is affected directly by both temperature extremes and rainfall. For example, rice, the staple food in many parts of Asia, is adversely affected by extremely high temperature. About 15% (23 million ha) of Asian rice areas experience frequent yield loss due to drought. The problem is particularly pertinent to eastern India, where the area of drought-prone fields exceeds more than 10 million ha.29
27. Draws on materials from SREX Chapter 4, Handmer, J. et al, ‘Changes in Impacts of Climate Extremes: Human Systems and Ecosystems’, and SREX Chapter 6, Lal, P. N. et al, ‘National Systems for Managing the Risks from Climate Extremes and Disasters’.
28. Draws on materials from SREX Chapter 4, Handmer, J. et al, ‘Changes in Impacts of Climate Extremes: Human Systems and Ecosystems’.
flooding can also contaminate surface water and affect environmental health in urban areas.
The need for adaptation is especially acute in Asia given that seven of the top 10 urban agglomerations projected to have the greatest exposure of assets in 2070 are in developing countries in this region. Scaled-up financing for adaptation may therefore be needed to safeguard residents and economic activity in these cities to a level comparable to that of other coastal megacities facing similar population and asset exposure, e.g. New York or Tokyo. Critical distinctions
include the degree of poverty and the effectiveness of local government in those cities most at risk. Some countries, such as China, India and Thailand, are projected to face increased future exposure to extremes, especially in highly urbanised areas, as a result of rapid urbanisation and economic growth. In central Dhaka, Bangladesh, infilling in areas occupied by natural water bodies and drains is increasing the risks of flooding. Building in the drained wetlands also generates new risks of liquefaction following earthquakes.
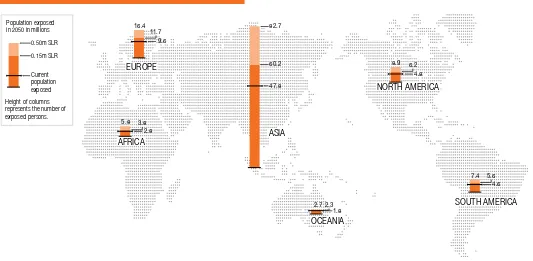
Population exposed in 2050 in millions
0.50m SLR
0.15m SLR
Current population exposed
Height of columns represents the number of exposed persons.
ASIA
SOUTH AMERICA
OCEANIA AFRICA
4.6 7.4 5.6
1.8 2.3 2.7 47.8
82.7
60.2
4.8 8.9
NORTH AMERICA 6.2 9.6
16.4
EUROPE 11.7
5.8 2.8 3.8
Figure 6: Population (in millions) exposed to sea level rise by 205031
Mumbai, Kolkata, Dhaka, Guangzhou, Ho Chi Minh City, Shanghai, Bangkok, Rangoon, and Hai Phòng will have the greatest population exposure to coastal flooding in 2070. Many of these cities are already characterised by significant population and asset exposure to coastal flooding. However, there is a certain limit to adaptation given that these cities are fixed in place and some degree of exposure to hazards is ‘locked in’ due to the unlikelihood of relocation. The numbers exposed in millions by 2050 are shown in the graph below highlighting the particular exposure of Asia.
3.3 Urban
settlements
30Changes in settlement patterns, urbanisation, and socio-economic status in Asia have influenced observed trends in vulnerability and exposure to climate extremes. In many coastal areas growing urban settlements have also affected the ability of natural coastal systems to respond effectively to extreme climate events, thus rendering them more vulnerable. Flooding regularly disrupts cities and urban food production, which can undermine food security, particularly in poor communities. Heavy rainfall and
30. Draws on materials from SREX Chapter 4, Handmer, J. et al, ‘Changes in Impacts of Climate Extremes: Human Systems and Ecosystems’.
4. Managing the risks of climate extremes
and disasters
This section considers the ranges of responses required in order to try to better manage the risks of climate
extremes and disasters. It considers the key messages 6-10 in more detail (see section 1.2).
Managing the
risk at different
scales/levels
32Disaster risk will continue to increase in many countries as more vulnerable people and assets are exposed to climate extremes. Increases in the occurrence of such weather-related disaster risk will magnify the uneven distribution of risk between wealthier and poorer countries. Climate change is altering the geographical distribution, intensity and frequency of some weather-related hazards in some regions, which threatens to exceed the capacities of poorer countries to absorb losses and recover from disaster impacts. So risk management becomes critical. This section considers the risk management options at local, national and international levels.
Closer integration of disaster risk management and climate change adaptation, along with the incorporation of both into local, sub-national, national, and international development policies and practices, could provide benefits at all scales. Addressing social welfare, quality of life, infrastructure, and livelihoods, and incorporating a multi-hazards approach into planning and action for
disasters in the short term, facilitates adaptation to climate extremes in the longer term. When considering the linkages between disaster management, climate change adaptation and development, timescales play an important role. For example, during disaster reconstruction tensions frequently arise between demands for speed of delivery and sustainability of outcome. Response and reconstruction funds tend to be time limited, often requiring expenditure within 12 months or less from the point of disbursement. This pressure is compounded by multiple agencies working with often limited coordination. Time pressure and competition between agencies tends to promote centralised decision-making and the sub-contracting of purchasing and project management to non-local commercial actors. Both outcomes save time but miss opportunities to include local people in decision-making and learning from the event, with the resulting reconstruction in danger of failing to support local cultural and economic priorities. Strategies and policies are more effective when they acknowledge multiple stressors, different prioritised values, and competing policy goals.
4.1 Local level DRM
33Integrating local knowledge with additional scientific and technical knowledge can improve disaster risk reduction and adaptation. This self-generated knowledge can uncover existing capacity, as well as important shortcomings. The social organisation of societies dictates the flexibility in the choice of protective actions. It is important to overcome the disconnect that remains between local risk management and national institutional and legal policy and planning. Local level DRM for example can, and should, be supported by environmental planning, urban land use planning, livelihood strengthening and improvement in health surveillance, water supply, sanitation, and irrigation and drainage systems.
Research undertaken by the Institute for Social and Environmental Transition (ISET) on a number of cases in India, Nepal and Pakistan shows that benefits exceed costs for local interventions. For example they note that return rates are particularly robust for lower-cost interventions, when compared to embankment infrastructure strategies that require capital investment. In Orissa, India, a comparison of the impact of the 1999 super cyclone
32. Draws on materials from SREX Chapter 8, O’Brien, K. et al, ‘Toward a Sustainable and Resilient Future’.
33. Draws on materials from SREX Chapter 5, Cutter, S. et al, ‘Managing the Risks from Climate Extremes at the Local Level’. 34. Draws on materials from Chapter 6, Lal, P. N. et al, ‘National Systems for Managing the Risks from Climate Extremes and Disasters’.
on 409 villages in two tahsils with and without mangroves, show that villages that had healthy strands of mangroves suffered significantly less loss of lives than those without (or with limited areas of) healthy mangroves, even though all villages had the benefit of early warnings and accounting for other social and economic variables.
4.2 National
level DRM
34Indonesia: Disaster Management Law (24/2007)
In 2007 Indonesia passed the Disaster Management Law, which created a stronger association between DRM and development planning processes. The legislative process was considered successful due to:
y Strong, visible professional networks – networks born out of previous disasters meant a high level of trust and willingness to co-ordinate the legal reform process. The political and intellectual capital, along with leadership from the Indonesian Society for Disaster Management was instrumental in convincing lawmakers about the importance of disaster management reform.
y Civil society leading advocacy – this resulted in CSOs being recognised by Law as key actors in implementing DRM in Indonesia.
y A supportive political environment – reform was initiated after the 2004 South Asian tsunami, which highlighted major deficiencies in DRM. However, the direction of the reform (from emergency management towards DRR) was influenced by the international focus, through the HFA, on DRR.
y Inclusive drafting process – consultations on the new Disaster Management Law were inclusive of practitioners and civil society, but not so far-reaching as to delay reform.
y Consensus that passing an imperfect law is better than no law at all – an imperfect law can be supplemented by additional regulations, which helps to maintain interest and focus.
Disaster management in China – integration and legislation
The Government’s disaster management process, developed as National Integrated Disaster Reduction, is a comprehensive system bringing together central and local government sectors and covering different phases of disaster preparedness, response and recovery/ rehabilitation. China has over 30 laws and regulations on disaster management. The Emergency Response Law, adopted in 2007, serves as the central legal document governing all disaster related efforts. It establishes an emergency response system consisting of three levels:
y The National Master Plan for Responding to Public Emergencies – a framework used throughout government to ensure public security and cope with emergency events, including all disaster response activities.
y Five national thematic disaster response plans which assign duties and arrangements for major disaster response categories (disaster relief; flood and drought; earthquakes; geological disasters and very severe forest fires).
y Emergency response plans for 15 central government departments with detailed implementation plans and operation norms.
Box 4: The role of legislation – examples from Indonesia and China
35. Draws on materials from Chapter 7, Burton, I. et al, ‘Managing the Risks: International Level and Integration Across Scales’. 36. http://drh.edm.bosai.go.jp/
adaptation to climate change and DRM issues have been priorities over extended time periods and have made significant progress.
There are some examples of standing disaster management capacity including the National Commission for Disaster Reduction in China, National Disaster Management Authorities in India and
Indonesia, and National Disaster Management Offices (NDMO) in
many Pacific island countries. In Mongolia the National Climate Risk Management Strategy and Action Plan (MMS 2009) seeks to build climate resilience at the community level through reducing risk and facilitating adaptation by: i) improving access to water, ii) improving the quality of livestock, iii) strengthening veterinarian services, and iv) using traditional herding knowledge and techniques, along with better community based DRM.
Legislation at the national level can play a useful role as explored in Box 4.
The existing literature on legislation for adaptation at the state level is not comprehensive, but a number of countries studied lack many of the institutional mechanisms and legal frameworks important for coordination at this level. In the South Pacific, high exposure to climate change risk has yet to translate into legislative frameworks to
support adaptation, with only Fiji, Papua New Guinea and Western Samoa formulating national climate change regulatory frameworks. Without a supporting and implemented national legislative structure, achieving local DRR and climate change adaptation planning can be complicated. In some high-risk regions rapid development of national platforms of CSOs and CBOs is helping to push for the transformation of policies and practices related to DRR.
A set of factors has been identified that make efforts to systematically manage disaster risk more successful. These are captured in Box 5.
4.3 Risk management
at the international
level
35International actors can also play a useful enabling role in risk management as summarised in Box 6.
International funding
Covering local risks: index-based micro insurance
for crop risks in India
An innovative insurance program set up in India in 2003 covers non-irrigated crops in the state of Andhra Pradesh against the risk of insufficient rainfall during key times of the cropping season. The index-based policies are offered by a commercial insurer and marketed to growers through microfinance banks. In contrast to conventional insurance, which is written against actual losses, this index-based (parametric) insurance is written against a physical or economic trigger, in this case rainfall. The scheme owes its existence to technical assistance provided by the World Bank. Schemes replicating this approach are currently targeting more than a million exposed farmers in India. One advantage of index-based insurance is the substantial decrease in transaction costs due to eliminating the need for expensive post-event claims handling, which has impeded the development of insurance mechanisms in developing countries. A disadvantage is basis risk, which is the lack of correlation of the trigger with the loss incurred.
Box 7: A risk transfer example
International agencies can play a strongly catalytic role in the development of catastrophic risk financing solutions in vulnerable countries, most notably by:
y exercising convening power and coordinating initiatives
y supporting public goods for development of risk market infrastructure
y providing technical assistance and sharing experience
y creating enabling markets, for example in the banking sector
y financing risk transfer, for example through micro-insurance.
Box 6: The role of IFIs, donors and other international actors in developing catastrophic risk financing mechanisms
37. Draws on material from Chapter 8, O’Brien, K. et al, ‘Toward a Sustainable and Resilient Future’.
a web-based collection of new and traditional indigenous technologies relevant to DRM that promote communication among developing and industrial countries.
Several Asian countries have been cooperating with OECD countries to develop small earth observation satellites, like DAICHI (Advanced Land Observing Satellite) and WINDS (Wideband InterNetworking engineering
test and Demonstration satellite) that include both optical and microwave sensors. DAICHI operated between 2006 and 2011 and made an important contribution to emergency observations of regions hit by major disasters in this period. It is important to note that there are existing capabilities within some particularly exposed developing countries (e.g. India, Bangladesh, China, Philippines) with well-developed remote-sensing capabilities of their own,
or existing arrangements with other space agency suppliers.
Risk transfer (usually with payment) and risk sharing (usually informal, with no payment) mechanisms are also recognised by international actors as an integral part of DRM and adaptation. A number of international organisations are already supporting countries most at risk from climate impacts to explore the potential for risk transfer, for example through enabling
access to insurance against extreme weather events. The international transfer and sharing of risk is an opportunity for individuals and governments of all countries that cannot sufficiently diversify their portfolio of weather risk internally, and especially for governments of vulnerable countries that do not wish to rely on ad hoc and often insufficient post-disaster assistance. Some specific examples of risk transfer in Asia are illustrated in Box 7.
y Risks are recognised as dynamic and are mainstreamed and integrated into policy and strategy, for example the impact of the 2004 Asian tsunami helped to create a supportive political environment for DRM in Indonesia.
y Legislation for managing disaster risk is supported by clear regulations that are enforced. For example, Bangladesh is developing national policies that require replacement houses built following disasters to include ‘climate proofing’ standards.
y Disaster risk management functions are co-ordinated across sectors and scales and led by organisations at the highest political level. In China the government’s National Integrated Disaster Reduction approach brings together a number of central and local government sectors and covers different phases of disaster preparedness, response and recovery.
y Risk is quantified and factored into national budgetary processes.
y Decisions are informed by the right information, using a range of tools and guidelines, for example remote-sensing capabilities in India, China and the Philippines.
y Early Warning Systems work, for example early warning
committees established in northern Bangladesh have helped to link communities to external organisations and improved their access to resources during floods.
5. Conclusions: What does this mean for
decision makers in Asia?
38This final section considers the implications for the Asia region in more detail. As climate change impacts
become more dramatic, the effects on a range of climate extremes will become more important and will play a
more significant role in disaster impacts and DRM. The capacity of Asian countries to meet this challenge will be
determined by the effectiveness of their national risk management systems, including adaptation and mitigation
measures. Some are poorly prepared and need to reassess their vulnerability, exposure and investments in order
to better manage disaster risks. A new balance needs to be struck between measures to reduce and transfer
risk, and to effectively prepare for and manage disaster impacts in a changing climate.
5.1 Links to the
mitigation of
greenhouse gases
Rapid and comprehensive reduction of greenhouse gas emissions is required in order to reduce the need for future adaptation and DRM in the longer term. Creating synergies between adaptation and mitigation can increase the cost-effectiveness of action and make them more attractive to stakeholders including potential funding agencies. Opportunities for synergies are greater in some sectors (agriculture and forestry, buildings and urban infrastructure) but are more limited in others (coastal systems, energy and health). Examples include where adaptation leads to effects on mitigation such as watershed planning including hydro-electricity affecting greenhouse gas emissions, or where mitigation can affect capacity to adapt, such as community carbon sequestration affecting livelihoods.395.2 Coping, adapting
and learning
How well a community responds to and survives disaster depends upon the resources that can be used to cope. Adaptation in anticipation of extreme events can help to limit the ‘coping’ that may be required to survive the next disaster. Adaptive capacity focuses on longer-term and more sustained adjustments, e.g. better rainwater harvesting techniques, changing crops, or building further inland or on higher ground. As possible climate futures are uncertain, ‘no regrets’ adaptation strategies are often recommended. They have net benefits over the range of anticipated future climate and associated impacts. Learning is essential to risk management and adaptation. Research on learning emphasises the importance of action-oriented problem solving, learning-by-doing, and concrete learning cycles.
5.3 Integrating
DRM, climate
change adaptation
and sustainable
development
Sustainable development involves finding pathways that achieve a variety of socioeconomic and environmental goals, without sacrificing any one for the sake of the others. As a result, the relationships between adaptation, disaster risk management and sustainability are highly political. Successful reconciliation of multiple goals ‘lies in answers to such questions as who is in control, who sets agendas, who allocates resources, who mediates disputes, and who sets rules of the game’.40 Thismeans that conflicts of interest must be acknowledged and addressed, whether they are between government departments, sectors, or policy arenas, and suggests that simple panaceas are unlikely
38. Draws on materials from SREX Chapter 6, Lal, P. N. et al, ‘National Systems for Managing the Risks from Climate Extremes and Disasters’ and Chapter 8, O’Brien, K. et al, ‘Toward a Sustainable and Resilient Future’.
39. These examples are from WGII, chapter 18 of the IPCC Fourth Assessment Report. 40. Wilbanks, 1994: 544.
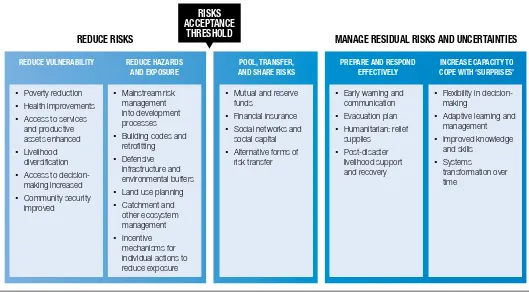
Figure 7: Integrating adaptation and DRM approaches for a changing climate41
y Poverty reduction y Health improvements y Access to services
and productive assets enhanced y Livelihood
diversification y Access to
decision-making increased y Community security
improved
y Mainstream risk management into development processes y Building codes and
retrofitting y Defensive
infrastructure and environmental buffers y Land use planning y Catchment and
other ecosystem management y Incentive
mechanisms for individual actions to reduce exposure
y Mutual and reserve funds
y Financial insurance y Social networks and
social capital y Alternative forms of
risk transfer
y Early warning and communication y Evacuation plan y Humanitarian: relief
supplies y Post-disaster
livelihood support and recovery
y Flexibility in decision-making
y Adaptive learning and management y Improved knowledge
and skills y Systems
transformation over time
REDUCE VULNERABILITY REDUCE HAZARDS
AND EXPOSURE
POOL, TRANSFER, AND SHARE RISKS
PREPARE AND RESPOND EFFECTIVELY
INCREASE CAPACITY TO COPE WITH ‘SURPRISES’
RISKS
ACCEPTANCE
THRESHOLD
REDUCE RISKS
MANAGE RESIDUAL RISKS AND UNCERTAINTIES
Although there is no single approach, framework or pathway to achieve such an integrated approach some important contributing factors have been identified. These include reducing exposure, reducing vulnerability, transferring and sharing risks and adequate preparation, response and recovery. These are captured in Figure 7.
A further set of critical factors to successfully integrate DRM, climate adaptation and resilience building have also been
identified and are highlighted in Box 8.
1. The capacity to reconcile short-term and long-term goals.
2. The willingness to reconcile diverse expressions of risk in multi-hazard and multi-stressor contexts.
3. The integration of DRM and climate change adaptation into other social and economic policy processes.
4. Innovative, reflexive, and transformative leaders (at all levels).
5. Adaptive, responsive, and accountable governance.
6. Support for flexibility, innovation and learning, locally and across sectors.
7. The ability to identify and address the root causes of vulnerability.
8. Long-term commitment to managing risk and uncertainty and promoting risk-based thinking.
Box 8: Eight critical factors for integrating DRM, Climate Adaptation, and Resilience Building
5.4 Building
long-term resilience:
from incremental to
transformational
42 If extreme climate and weather events increase significantly in coming decades, climate change adaptation and DRM are likely to require not only incremental (small, within existing technology and governance systems) changes, but also transformative (large, new systems, new ways in thinking) changes in processes and institutions. This will involve moving away from a focus on issues and events towards a change in culture and overall approach, elaborated in the following areas:Partnerships: among the most successful DRM and adaptation efforts are those that have facilitated the development of partnerships between local leaders and other stakeholders, including extra-local governments. This allows local strengths and priorities to surface, while acknowledging that communities and local governments have limited resources and strategic scope to address the underlying drivers of risk on their own.
Leadership can be critical for DRM and climate change adaptation, particularly in initiating processes and sustaining them over time.
For further information
The Summary for Policy Makers, full report, fact sheet and video is available at:http://ipcc-wg2.gov/srex.
Other useful links including videos and recommended reading are on the CDKN website here:
www.cdkn.org/srex. Change processes are shaped
by the action of individual champions (including those resisting change) and their interactions with organisations, institutional structures and systems. Leadership can be a driver of change, providing direction and motivating others to follow. A number of private sector organisations have demonstrated this at Chair and CEO level enabling transformational change within their organisations.
Identifying the drivers of hazard and vulnerability in ways that empower all stakeholders to take action is key. This is done best where local and scientific knowledge is combined in the generation of risk maps or risk management plans. Greater use of local knowledge and local capacity can initiate enhanced accountability in integrated risk decision-making. There is also need for better co-ordination and accountability within governance hierarchies and across sectors.
International actors can help by providing an institutional framework to support
experimentation, innovation and flexibility, financing risk transfer and supporting funding for adaptation.
Technology is an essential part of responses to climate extremes, at least partly because technology choices
and uses are so often a part of the problem. Enhancing early warning systems is one example where technology can play an important role in DRM, particularly in considering ‘hard’ (engineering) and ‘soft’ (social and administrative) technology. Although technology is an essential part of our response to climate change, responses can also be improved by addressing social vulnerability, rather than focusing exclusively on technological approaches.
Transformation can imply loss of the familiar, creating a sense of disequilibrium and uncertainty. Desirable or not, transformations are occurring at an
unprecedented rate and scale, influenced by globalisation, social and technological development, and environmental change. Climate change itself represents a system-scale transformation that will have widespread consequences on ecology and society, including through changes in climate extremes.
Responses to climate change and changes in disaster risk can be both incremental and transformational. Transformation calls for leadership, both from authority figures who hold positions and power, and from individuals and groups who connect present-day actions with building a sustainable and resilient future.