P-ISSN: 2087-1228 E-ISSN: 2476-9053 Binus Business Review, 9(2), July 2018, 125-132
DOI: 10.21512/bbr.v9i2.4650
Impact of E-Service Quality and Customer Value
on Customer Satisfaction in LocalBrand
Sevenpri Candra
1; Mita Juliani
21,2 Management Department, BINUS Business School Undergraduate Program, Bina Nusantara University
Jln. K. H. Syahdan No. 9, Jakarta Barat 11480, Indonesia 1[email protected]
Received: 9th April 2018/ Revised: 26th April 2018/ Accepted: 30th April 2018
How to Cite: Candra, S., & Juliani, M. (2018). Impact of E-Service Quality and Customer Value on Customer Satisfaction in LocalBrand. Binus Business Review, 9(2), 125-132.
https://doi.org/10.21512/bbr.v9i2.4650
ABSTRACT
This research aimed to investigate the impact of e-service quality and customer value on customer satisfaction. This research was descriptive-associative in which researcher described not only the value of research variables
but also the inluence or relationship between independent variables and the dependent variable. A survey on
e-marketplace of online fashion local brand in Indonesia was conducted. The researcher distributed questionnaires to buyers or customers on the LocalBrand (LB) website and a total 150 questionnaires were analyzed. Partial Least Square (PLS) was a used statistic method for analyzing the research model. The results show that customer value
has a signiicant inluence on the customer satisfaction. However, e-service quality does not have a signiicant inluence on customer satisfaction.
Keywords: e-service quality, customer value, customer satisfaction, e-marketplace
INTRODUCTION
Nowadays, business and technology become one package in the business strategy. Technology, especially the progress of Internet development, changes the business, e-business or e-commerce, and social media (Octavia & Tamerlane, 2017; Sundjaja, Gaol, Abdinagoro, & Abbas, 2017). Online transactions or commonly called as e-commerce in Indonesia is not new. The dotcom era that gave birth to amazon.com and e-bay has revolutionized conventional shopping. In Indonesia, some well-known online shopping sites are to the public are Tokopedia, Bukalapak, Zalora, Lazada, LocalBrand and many more.
To compete in today’s business competition, LocalBrand (LB) or other company can not only rely on product quality but also on the quality of service. It can further encourage customers to re-purchase the products the companies offer. Companies are required to focus on the needs of the customers. It can begin
with changing the mindset regarding proit-oriented to
other potential factors such as customer satisfaction and
loyalty. This is because the customer is an important element for the company. Business competition can mean competing for getting the customers. The winner is not the strongest or the greatest, but it
can satisfy the customers. In this increasingly ierce
business competition, companies need to realize that the customer’s decision to buy the goods is based on good product quality, competitive prices, and service quality. From this service, it will lead to customer assessment and result in customer satisfaction.
Service can be deined as deed, effort, or
performance. Meanwhile, service quality is an attitude that is formed for the long-term and the overall evaluation of the company’s performance. Kotler and
Keller (2015) deined service as any action that a party
could offer to an essentially intangible party and did not result in the ownership of something. Moreover, Blut,
Chowdhry, Mittal, and Brock, (2015) and Zemblytė
(2015) agreed that e-service quality was as the extent to which the website facilitated shopping, purchasing, delivery of products, and services effectively and
eficiently.
In
P
According to Candra (2014b), The researches of service quality and e-service quality have been conducted, and different scales have been developed to measure e-service quality. However, the existing research on e-service quality has been described separately. Usually, it is the research related the service quality with customer value impact.
Customer value describes the exchange
between quality or beneit received by customers and
costs such as money, energy, time. Those encourage the customers to evaluate, obtain, and use the product (Kasiri, Cheng, Sambasivan, and Sidin, 2017). According to Carlos Fandos Roig, Sanchez Garcia, Angel Moliner Tena, and Llorens Monzonis (2006) and Sánchez, Callarisa, Rodríguez, and Moliner (2006), customer value dimension consists of the functional value, emotional value, and social value. Functional
value is deined as the perceived utility of the product
and service attributes. In this research, there are four functional values. First, it is the functional value of establishment (installation). It addresses the available registration page on the website. Second, there is the functional value of personnel (professionalism). The utility is provided by the personnel (staff). Third, it is the functional value of the service purchased (quality). The perceived utility is derived from the service quality provided. Fourth, the functional value of price. It is the perceived utility of the cost level incurred. Meanwhile, emotional value consists of feelings or affective states created through the experience of consumption. Then, social value is acceptance related to the level of individual relationships with their social environment.
Furthermore, customer satisfaction is a level that the needs, wishes, and expectations of the customer can be met and can result in repeat purchase or continued loyalty. The most important factor for obtaining consumer satisfaction is the performance of the agent. It is usually interpreted by the quality of the agent (Nagengast, Evanschitzky, Blut, and Rudolph, 2014).
Bressolles and Durrieu (2011) examined the link between service quality, customer value, and customer satisfaction through the dimensions of the three variables in the online context wine website. The results of this research highlighted the impact of e-service quality (information, ease of use, design, security/ privacy, and reliability) dimensions on customer satisfaction through customer value (transactional, utilitarian, and social value) dimensions. These results ultimately led the researchers to a conclusion that from a managerial point of view and to improve customer value and satisfaction, online wine sellers should focus on different dimensions of e-service quality especially on user convenience; propose user-friendly navigation interface; facilitate internet users by offering several search options based on price, region, type of wine, color, consumption, and others; and provide internal search engine. Then, the reliability in this research indicated the level of inventory in real-time by offering various delivery methods and time ranges. In the design, the company created video regarding the bottle. Finally, in the security/privacy, the company
offered various payment methods and provided information relating to policies in the data protection.
LB is one of the e-commerce sites that was launched at the 66th Indonesia Independence Day. LB has a different concept from other established e-commerce in Indonesia. LB is an online fashion mall that sells local product from Indonesian fashion designer. There are several products from each brand, and it will be a different approach offered by LB. Moreover, the quality is the main key point that LB also offers (LocalBrand, 2011).
Based on the explanation, this research aims to investigate the impact of e-service quality and customer value on customer satisfaction from LB.
The inding can give suggestions for LB and other
e-commerce that have the similar services like LB. In the future, it can be used as a guide to develop strategies to improve customer’s relationships and create customer satisfaction.
METHODS
This type of research is descriptive-associative. The researcher does not only describe the value of
research variables but also deines the inluence or
relationship between independent variables and the dependent variable. A survey is used that the researcher distributes the questionnaires to buyers or customers on the LB website. The used sampling technique is probability sampling with purposive sampling. Purposive sampling is a sampling technique that is restricted to certain types of people who can provide the desired information. It is because they are the only ones who have it or according to some criteria set by the researcher (Sekaran & Bougie, 2016). The analysis technique in this research is Partial Least Square (PLS) method (Candra, 2014a). The measurement indicators for this research can be seen in Table 1 to Table 3.
Table 1 Operational Variable for E-Service Quality
Dimensions Measurement Indicators
Ease of Use It is easy to get information (X01) It is easy to browse the website (X02) The website is user-friendly (X03)
Website Design The user interface has a regular appearance (X04) Page loading is fast (X05)
Reliability Service delivery is accurate (X06) The service order is complete (X07) Order taking service is accurate (X08)
Privacy Customer information is secure (X09) The website does not give any customer information to any party (X10)
It protects information about customers’ credit cards (X11)
Responsiveness It has adequate response time (X12) It has promising service (X13) It has a timely response (X14)
(Source: Candra, 2014b; Li, Liu, & Suomi, 2009; Zehir & Narcıkara, 2016)
In
P
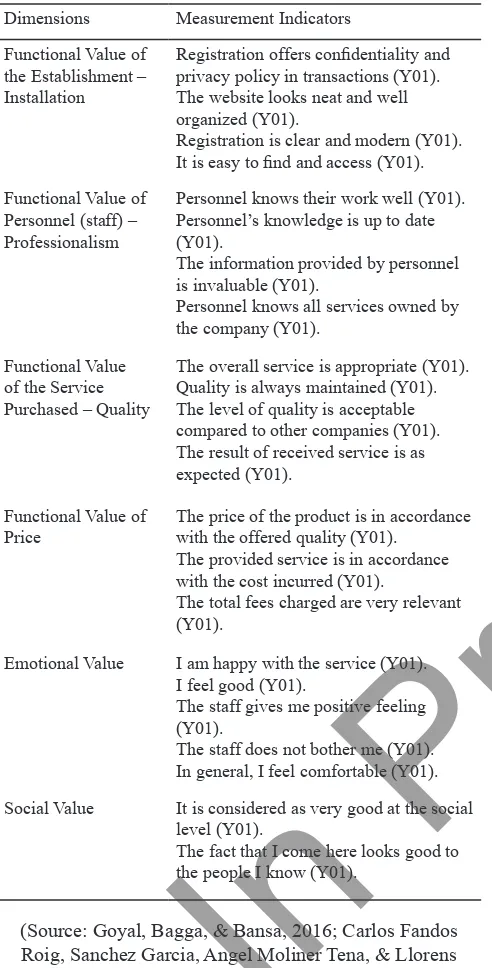
Table 2 Operational Variable for Customer Value
Dimensions Measurement Indicators
Functional Value of the Establishment – Installation
Registration offers conidentiality and
privacy policy in transactions (Y01). The website looks neat and well organized (Y01).
Registration is clear and modern (Y01).
It is easy to ind and access (Y01).
Functional Value of Personnel (staff) – Professionalism
Personnel knows their work well (Y01). Personnel’s knowledge is up to date (Y01).
The information provided by personnel is invaluable (Y01).
Personnel knows all services owned by the company (Y01).
Functional Value of the Service Purchased – Quality
The overall service is appropriate (Y01). Quality is always maintained (Y01). The level of quality is acceptable compared to other companies (Y01). The result of received service is as expected (Y01).
Functional Value of Price
The price of the product is in accordance with the offered quality (Y01).
The provided service is in accordance with the cost incurred (Y01).
The total fees charged are very relevant (Y01).
Emotional Value I am happy with the service (Y01). I feel good (Y01).
The staff gives me positive feeling (Y01).
The staff does not bother me (Y01). In general, I feel comfortable (Y01).
Social Value It is considered as very good at the social level (Y01).
The fact that I come here looks good to the people I know (Y01).
(Source: Goyal, Bagga, & Bansa, 2016; Carlos Fandos Roig, Sanchez Garcia, Angel Moliner Tena, & Llorens Monzonis, 2006; El-Adly & Eid, 2016; Kasiri et al., 2017)
Table 3 Operational Variable for Customer Satisfaction
Measurement Indicators
I am totally satisied with the service (Z01).
I feel very happy with the provided service (Z02). I feel happy (Z03).
(Source: Bressolles & Durrieu, 2011; Candra, 2014b; Nagengast et al., 2014)
RESULTS AND DISCUSSIONS
The researcher begins to spread the questionnaires through social media (twitter) in @ LocalBrandID. It is a twitter of LB. The questionnaire is sent through newsletter with e-mail by LB. The target amount is 344 respondents. The distribution of this questionnaire is conducted for approximately a month. After a month, there are about 195 respondents
who ill out the questionnaires. However, 150
respondents answer that they have shopped on LB before. Meanwhile, 45 respondents say no. It means that only data from 150 respondents can be used or 43,60%. The response rate is acceptable. In the previous researches, the response rate for the online questionnaire is always lower than the result of using a physical questionnaire. The response rate using the online questionnaire in both researches is only 23% and 43 (Saleh & Bista, 2017).
Based on survey results collected from all 150 respondents, the researcher obtains data that the majority of the respondent is female (100 respondents or 67%). Meanwhile, the rest is male (50 respondents or 33%). It can be said that most buyers or customer in LB and the tendency to shop online are dominated by women.
Based on age, the result shows that most respondents are 21-30 years about 104 respondents or 69%. It is followed by <20-year respondents with 40 respondents or 27%. There are 5 respondents with age of 31-40 years or 3%. Meanwhile, the minority of respondents with age of >51 years is only 1 or 1%. It can be concluded that the tendency to shop is more done at the age of 21-30 years that they have a need for fashion.
Moreover, from the education, it shows a various result. About 57 respondents (57%) has high school education. Similarly, with the same number as the previous result, 57 respondents (57%) has a bachelor degree (S1). Then, it is followed by respondents with junior school education about 26 respondents (17%). Meanwhile, in diploma level and others, the number of respondents are 9 (6%) and 1 (1%) respectively.
Next, in status, most of the respondents are students or 99 respondents with the highest percentage of 65%. It is followed by 24 respondents who work as private employees (16%). Then, the respondents who are civil servants are 14 with a percentage of 9%. Meanwhile, the respondents who are self-employed and others are 9 and 6 respondents with the percentage of 6% and 4% respectively.
The experience with the Internet is an important consideration in making purchases online. Inexperienced internet users rarely buy online (Candra, 2015). Based on survey results, most respondents have the experience in online shopping for 1-3 years. It has 75 respondents and 50% percentage. Then it is followed by <1 year of experience with 51 respondents (34%), and 20 respondents (13%) has 3-5 years of experience. Then, 3 respondents have >7 years of experience or 2%. The respondents with 5-7 years of experience are only 1 or 1%.
In
P
To answer the hypothesis, the researcher will evaluate the measurement model. It determines the relationship between the latent variable and its indicator or manifest variable. This measurement is done through three steps: convergent validity, discriminant validity, and composite reliability (Candra & Gunawan, 2017).
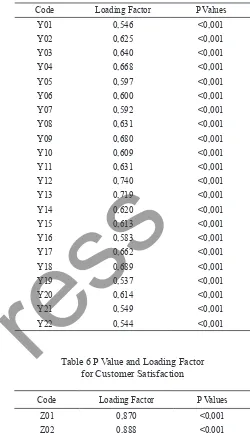
To measure convergent validity, it can be done in combined loadings and cross-loadings table at SEM output. There are two recommended criteria as a basis to determine whether the measurement model has met the convergent validity. P value should be less than 0,05, and the loading factor should be equal to or greater than 0,5 (Candra, 2016b). Based on Table 4 to Table 6, the results of P-value and loading factor for e-service quality, customer value, and customer satisfaction are good. All data can be used for the next analysis. However, X05 and X14 are dropped in the next analysis. It is because the loading factor is under 0,5.
Table 4 P Value and Loading Factor for E-Service Quality
Code Loading Factor P Values
X01 0,689 <0,001
X02 0,762 <0,001
X03 0,575 <0,001
X04 0,623 <0,001
X05 0,458 <0,001
X06 0,671 <0,001
X07 0,625 <0,001
X08 0,656 <0,001
X09 0,591 <0,001
X10 0,551 <0,001
X11 0,646 <0,001
X12 0,596 <0,001
X13 0,522 <0,001
X14 0,439 <0,001
Average Variance Extracted (AVE) describes the variant or diversity of manifest variables that can be contained by latent variables. The criterion is AVE value > 0,5. It means that the variable has met the convergent validity. Based on Table 7, it is known that AVE value for e-service quality variable is 0,368, customer value with 0,390 and customer satisfaction with 0,739. These mean that AVE value generated by customer satisfaction is greater than 0,5. In accordance with the AVE criteria, customer satisfaction variables show a good convergent validity measurement. Meanwhile, the value of AVE on e-service quality and customer value shows that the results are smaller than 0,5. It implies that these two variables do not have a good convergent validity.
Table 5 P Value and Loading Factor for Customer Value
Code Loading Factor P Values
Y01 0,546 <0,001
Y02 0,625 <0,001
Y03 0,640 <0,001
Y04 0,668 <0,001
Y05 0,597 <0,001
Y06 0,600 <0,001
Y07 0,592 <0,001
Y08 0,631 <0,001
Y09 0,680 <0,001
Y10 0,609 <0,001
Y11 0,631 <0,001
Y12 0,740 <0,001
Y13 0,719 <0,001
Y14 0,620 <0,001
Y15 0,613 <0,001
Y16 0,583 <0,001
Y17 0,662 <0,001
Y18 0,689 <0,001
Y19 0,537 <0,001
Y20 0,614 <0,001
Y21 0,549 <0,001
Y22 0,544 <0,001
Table 6 P Value and Loading Factor for Customer Satisfaction
Code Loading Factor P Values
Z01 0,870 <0,001
Z02 0,888 <0,001
Z03 0,820 <0, 001
Table 7 AVE Result
Code AVE
ESQ 0,368
CLV 0,390
CSA 0,739
*E-Service Quality (ESQ); Customer Value (CLV); and Customer Satisfaction (CSA).
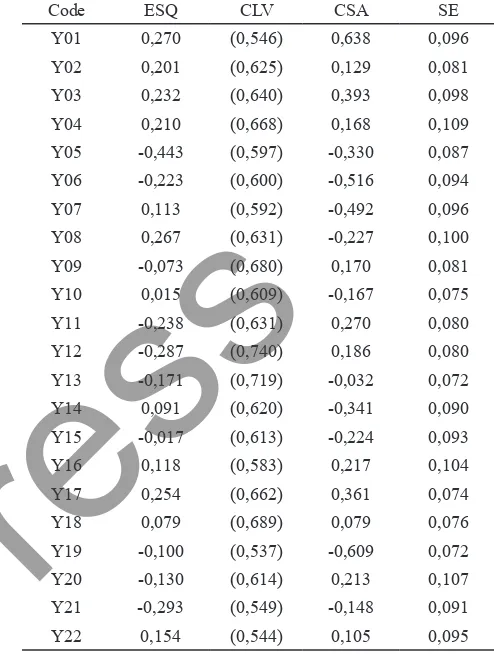
Discriminant validity of the measurement model is assessed based on measurement of cross measurement with variables. If the variable correlation with the principal measurement (each indicator) is greater than the size of the other variable, the latent variable predicts the indicator better than the other variables. From Table 8 to Table 10, it shows the
In
P
inding of discriminant validity. Overall, all variables
meet the discriminant validity criteria. It shows that all latent variables predict indicators on their blocks better than the other blocked indicators.
Table 8 Discriminant Validity for E-Service Quality
Code ESQ CLV CSA SE
X01 (0,689) -0,191 0,279 0,086
X02 (0,762) 0,136 -0,084 0,087
X03 (0,575) 0,100 0,107 0,085
X04 (0,623) -0,004 0,227 0,093
X05 (0,458) 0,601 -0,770 0,137
X06 (0,671) -0,001 -0,320 0,079
X07 (0,625) -0,018 -0,344 0,068
X08 (0,656) 0,218 -0,340 0,086
X09 (0,591) -0,617 0,860 0,095
X10 (0,551) -0,457 0,873 0,118
X11 (0,646) -0,548 0,857 0,101
X12 (0,596) 0,410 -0,440 0,097
X13 (0,522) -0,001 -0,253 0,117
X14 (0,439) 0,668 -1,078 0,125
*E-Service Quality (ESQ); Customer Value (CLV); Customer Satisfaction (CSA); and Standard Error (SE).
Based on the results of PLS output, the e-service quality variables, especially on the loading values X09, X10, X11, and X14, are smaller than the correlation of the e-service quality indicator with other variables. This shows that the loading values of X9, X10, X11, and X14 do not meet the discriminant validity criteria. Then, the correlation of the customer value variable on the value of loading Y01 is smaller than the correlation of the customer value indicator with other variables. It indicates that the loading value of Y01 does not meet the criteria of discriminant validity. Meanwhile, customer satisfaction variable shows bigger correlation variable indicator than correlation indicator of customer satisfaction with another variable.
After testing the validity of variables, the researcher conducts internal consistency reliability test. It is measured by two criteria, namely composite reliability and Cronbach’s alpha. Those are from the indicator block that measures the variables. A variable is considered reliable if the values of composite reliability and Cronbach’s alpha are above 0,7 (Candra, 2016a).
Table 11 shows the satisfactory composite
reliability coeficient of each variable. The result of
each variable is e-service quality (0,889), customer value (0,933), and customer satisfaction (0,895). In addition to these composite reliability results, the
coeficients of Cronbach’s alpha also show good results
for e-service quality (0,864), customer value (0,864),
and customer satisfaction (0,823). Therefore, it can be concluded that each variable has high reliability. It can be seen from the values of composite reliability and Cronbach’s alpha. All variables are greater than 0,7.
Table 9 Discriminant Validity for Customer Value
Code ESQ CLV CSA SE
Y01 0,270 (0,546) 0,638 0,096
Y02 0,201 (0,625) 0,129 0,081
Y03 0,232 (0,640) 0,393 0,098
Y04 0,210 (0,668) 0,168 0,109
Y05 -0,443 (0,597) -0,330 0,087
Y06 -0,223 (0,600) -0,516 0,094
Y07 0,113 (0,592) -0,492 0,096
Y08 0,267 (0,631) -0,227 0,100
Y09 -0,073 (0,680) 0,170 0,081
Y10 0,015 (0,609) -0,167 0,075
Y11 -0,238 (0,631) 0,270 0,080
Y12 -0,287 (0,740) 0,186 0,080
Y13 -0,171 (0,719) -0,032 0,072
Y14 0,091 (0,620) -0,341 0,090
Y15 -0,017 (0,613) -0,224 0,093
Y16 0,118 (0,583) 0,217 0,104
Y17 0,254 (0,662) 0,361 0,074
Y18 0,079 (0,689) 0,079 0,076
Y19 -0,100 (0,537) -0,609 0,072
Y20 -0,130 (0,614) 0,213 0,107
Y21 -0,293 (0,549) -0,148 0,091
Y22 0,154 (0,544) 0,105 0,095
*E-Service Quality (ESQ); Customer Value (CLV); Customer Satisfaction (CSA); and Standard Error (SE).
Table 10 Discriminant Validity for Customer Satisfaction
Code ESQ CLV CSA SE
Z01 0,143 -0,233 (0,870) 0,067
Z02 -0,032 -0,039 (0,888) 0,061
Z03 -0,117 0,290 (0,820) 0,080
*E-Service Quality (ESQ); Customer Value (CLV); Customer Satisfaction (CSA); and Standard Error (SE).
Table 11 Reliability Result
Code Composite Reliability Cronbach’s Alpha
ESQ 0,889 0,864
CLV 0,933 0,864
CSA 0,895 0,823
*E-Service Quality (ESQ); Customer Value (CLV); and Customer Satisfaction (CSA).
In
P
Therefore, it can be concluded that each variable has high reliability. It can be seen from the values of composite reliability and Cronbach’s alpha. All variables are greater than 0,7.
After evaluating the measurement model, the indicators of e-service quality, customer value, and
customer satisfaction have fulilled the requirements
of convergent validity, discriminant validity, and composite reliability. Thus, it can be continued to the next stage such as evaluating the structural model
including model it indices, path coeficient, and R2. Before testing the signiicance of path coeficient and R2, model it indices have to be tested. The test of model it indices is done to know whether the research
model meets the criteria so it can be used for further analysis.
In this model it test as seen in Table 12, there are three indices: Average Path Coeficient (APC),
Average R-Squared (ARS), and Average Variance
Inlation Factor (AVIF). APC and ARS criteria are
accepted when p-value is <0,05. Meanwhile, AVIF is accepted if it is smaller than 5 (Candra, 2016a). It can be seen in Table 12 that the APC and ARS indices have p-value of <0,001. It means that it has met the criteria of APC and ARS. Then, the AVIF also shows p-value of <5 such as 3,454. Thus, it can be concluded that the model meets the criteria and it can be used for further analysis.
Table 12 Model Fit Indices
Model Fit
APC 0,535 P<0,001
ARS 0,643 P<0,001
AVIF 3,454 Good if < 5
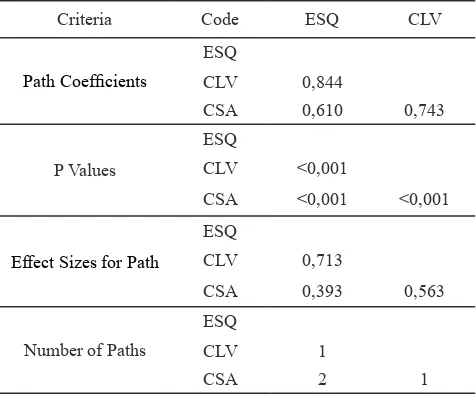
Hypothesis testing of path coeficients between
the variables is used to evaluate the structural relationship between latent variables. It compares the p-value with alpha 0,05. This test is intended to measure the correctness of the alleged research or to answer questions about the effect or relationship as described in research background. Testing all hypotheses will be analyzed based on the results obtained from data processing in Table 13 and Table 14.
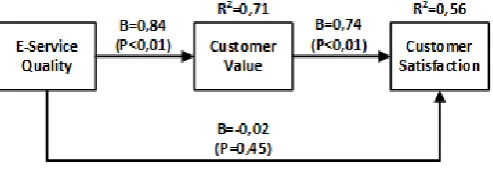
The e-service quality variable has a signiicant and positive inluence on the customer value variable at
LB. It can be observed through the value of the positive
value coeficient of 0,844. This result indicates that
if there is an increase in the assessment of e-service quality of one unit, the assessment of customer value will increase by 0,844 and vice versa. Similarly, if there is any decrease in the assessment of e-service quality of one unit, the assessment of the customer value will decrease by 0,844. Then, the effect size of R2 value of 0,713 can be seen. It means that e-service quality variable affects customer value variable in LB
about 71,3%. The other (28,7%) is inluenced by other
variables that are not used in this research.
Table 13 Path Coeficient
Criteria Code ESQ CLV
Path Coeficients
Effect Sizes for Path
ESQ
CLV 0,713
CSA 0,011 0,563
*E-Service Quality (ESQ); Customer Value (CLV); and Customer Satisfaction (CSA).
The customer value has a signiicant and positive inluence on the customer satisfaction variable
at LB. It can be seen from the value of the positive
value coeficient of 0,743. This indicates that if there
is an increase in the assessment of customer value of one unit, the assessment of customer satisfaction will increase by 0,743 and vice versa. It is similar if there is a decrease in the assessment of customer value of one unit, the assessment of customer satisfaction will decrease by 0,743. Then, the effect size of R2 value of 0,563 can be seen. It implies that customer value variable affects customer satisfaction variable on LB
about 56,3%. The rest (43,7%) is inluenced by other
variables which are beyond this research
Table 14 Total Effect
Criteria Code ESQ CLV
Path Coeficients
Effect Sizes for Path
ESQ
*E-Service Quality (ESQ); Customer Value (CLV); and Customer Satisfaction (CSA).
Based on Figure 1, it can be seen that e-service
quality variable has a signiicant inluence on customer
value variable in LB. (Bressolles & Durrieu, 2011) stated that service quality was an important form of
In
P
customer value. In addition, many researchers have
validated the strong, positive, and signiicant effect
of the product or service quality on customer value perceptions (Bressolles & Durrieu, 2011; El-Adly & Eid, 2016; Kasiri et al., 2017).
Figure 1 Result of Research Model
Based on 71,3% of customer value obtained from e-service quality, it is necessary for LB to continue to pay attention and improve e-service quality. This
inding is in accordance with previous research by Oh
(1999). Oh (1999) stated that customer value was an important variable to be considered in service quality and customer satisfaction.
Customer value also has a signiicant inluence
on customer satisfaction at LB as described in data
processing. This inding is similar to previous research
by Bressolles and Durrieu (2011). They agreed that customer value and customer satisfaction showed a close relationship. It shows that customer value is the beginning of the formation of customer satisfaction.
Moreover, e-service quality has no signiicant inluence on customer satisfaction in LB. This is different from the indings of previous research.
The previous researchers state that e-service quality is related to customer satisfaction (Chang, Cheng, & Wang, 2007; Nicolaou & Bhattacharya, 2006). In this research, it is found that e-service quality has no effect on customer value directly. It must go
through customer value irst. E-service quality and customer value inluence the customer satisfaction
simultaneously in LB. According to Bressolles and Durrieu (2011), e-service quality can lead to an increase in customer value and customer satisfaction. E-service quality affects the dimension of customer value which ultimately affects customer satisfaction in return. This can be seen in Figure 1. The research model describes that customer satisfaction has R2 of 0,57. It means that the relationship between e-service quality and customer value affects customer satisfaction by 57%.
CONCLUSIONS
This Based on the results of the analysis, the researcher recommends completing the service order attribute on the website. Thus, the customer can be easier to order. It is related to the e-service quality. The accuracy of time owned by LB in interacting with its customers is also considered very less. It is stated by
most respondents in the results of the questionnaire. In accordance with this indicator, it is recommended that the service can be done in real-time so that customers feel comfortable shopping in LB. Then, it is also advisable to add staff so that the service time can be done up to 24 hours. Then, for customer value, the performance of personnel or staff in LB is considered as less helpful when customers seek important information. It will be better if the personnel or staff in LB are given knowledge about the job desk and the product to improve the service quality and can be more informative to give positive feelings to LB customers.
REFERENCES
Blut, M., Chowdhry, N., Mittal, V., & Brock, C. (2015). E-service quality: A meta-analytic review. Journal of Retailing, 91(4), 679-700. https://doi.org/10.1016/j. jretai.2015.05.004
Bressolles, G., & Durrieu, F. (2011). Service quality, customer value and satisfaction relationship revisited for online wine websites. In 6th AWBR International
Conference.
Candra, S. (2014a). The impact of enterprise resource planning success in Indonesia company. Advanced Science Letters, 20(1), 184-187. https://doi. org/10.1166/asl.2014.5245
Candra, S. (2014b). The service quality of Internet banking and impact to customer satisfaction: A preliminary inding. International Journal of Applied Engineering Research, 9(22), 17963-17970.
Candra, S. (2015). The use of IPA in bricks and clicks service quality (Lesson learned from ICT shop). Far East Journal of Electronics and Communications, 15(1), 23. https://doi.org/10.17654/FJECSep2015-023-034 Candra, S. (2016a). Knowledge capability and key
stakeholders’ readiness in ERP implementation success. Far East Journal of Electronics and Communications, 16(3), 545. https://doi. org/10.17654/EC016030545
Candra, S. (2016b). The evaluation of e-passport quality using e-government quality measurement (Case study of e-passport in DKI Jakarta). Advanced Science Letters, 22(5-6), 1360-1362. https://doi. org/10.1166/asl.2016.6613
Candra, S., & Gunawan, F. E. (2017). The impact of e-procurement practice in Indonesia government: A preliminary study (The case of electronic procurement service at Bekasi district). Journal of Physics: Conference Series, 801(1), 012023. https:// doi.org/10.1088/1742-6596/801/1/012023
Carlos Fandos Roig, J., Sanchez Garcia, J., Angel Moliner Tena, M., & Llorens Monzonis, J. (2006). Customer perceived value in banking services. International Journal of Bank Marketing, 24(5), 266-283. https:// doi.org/10.1108/02652320610681729
Chang, H. H., Cheng, N., & Wang, H. (2007). The relationships among e-service quality, value, satisfaction and loyalty in online shopping. European Advances in Consumer Research Volume, 8, 10-14.
In
P
El-Adly, M. I., & Eid, R. (2016). An empirical study of the relationship between shopping environment, customer perceived value, satisfaction, and loyalty in the UAE malls context. Journal of Retailing and Consumer Services, 31, 217-227. https://doi. org/10.1016/j.jretconser.2016.04.002
Goyal, A. P., Bagga, T., & Bansa, S. (2016). Impact of increasing trend of online marketing on consumer buying behaviour: FMCG brands in Indian scenario. International Journal of Engineering Technology, Management and Applied Sciences, 4(5), 218-229. Kasiri, L. A., Cheng, K. T. G., Sambasivan, M., & Sidin,
S. M. (2017). Integration of standardization and customization: Impact on service quality, customer satisfaction, and loyalty. Journal of Retailing and Consumer Services, 35, 91-97. https://doi. org/10.1016/J.JRETCONSER.2016.11.007
Kotler, P., & Keller, K. L. (2015). Marketing management (15th ed.). Pearson.
Li, H., Liu, Y., & Suomi, R. (2009). Measurement of e-service quality: An empirical study in online travel service. In ECIS 2009 Proceedings (pp. 1734-1745). LocalBrand. (2011). About us. Retrieved January 2nd, 2018
from http://localbrand.co.id/about
Nagengast, L., Evanschitzky, H., Blut, M., & Rudolph, T. (2014). New insights in the moderating effect of switching costs on the satisfaction-repurchase behavior link. Journal of Retailing, 90(3), 408-427. https://doi.org/10.1016/j.jretai.2014.04.001
Nicolaou, A. I., & Bhattacharya, S. (2006). Organizational performance effects of ERP systems usage: The impact of post-implementation changes. International Journal of Accounting Information Systems, 7(1), 18-35. https://doi.org/10.1016/j. accinf.2005.12.002
Octavia, D., & Tamerlane, A. (2017). The inluence of website quality on online purchase intentions on Agoda.Com with e-trust as a mediator. Binus Business Review, 8(1), 9-14. https://doi.org/10.21512/bbr.v8i1.1680 Oh, H. (1999). Service quality, customer satisfaction, and
customer value: A holistic perspective. International Journal of Hospitality Management, 18(1), 67-82. https://doi.org/10.1016/S0278-4319(98)00047-4 Saleh, A., & Bista, K. (2017). Examining factors impacting
online survey response rates in educational research: Perceptions of graduate students. Journal of MultiDisciplinary Evaluation, 13(29), 63-74.
Sánchez, J., Callarisa, L., Rodríguez, R. M., & Moliner, M. A. (2006). Perceived value of the purchase of a tourism product. Tourism Management, 27(3), 394-409. https://doi.org/10.1016/j.tourman.2004.11.007 Sekaran, & Bougie. (2016). Research methods for business:
A skill-building approach. (7th ed.). Wiley.
Sundjaja, A. M., Gaol, F. L., Abdinagoro, S. B., & Abbas, B. S. (2017). The behavior of online museum visitors on Facebook fan page of the museum in Indonesia. Binus Business Review, 8(3), 237-243. https://doi. org/10.21512/bbr.v8i3.3742
Zehir, C., & Narcıkara, E. (2016). E-service quality and e-recovery service quality: Effects on value perceptions and loyalty intentions. Procedia - Social and Behavioral Sciences, 229, 427-443. https://doi. org/10.1016/j.sbspro.2016.07.153
Zemblytė, J. (2015). The instrument for evaluating e-service quality. Procedia - Social and Behavioral Sciences, 213, 801-806. https://doi.org/10.1016/j. sbspro.2015.11.478