MOMENTUM STRATEGIES AND TRADING VOLUME TURNOVER IN MALAYSIAN STOCK EXCHANGE
Tafdil Husni*
A b s t r a c t
Using daily data on the Main Board of the Malaysian stock market from January 1988 to October 2002 and employing the strategy quite similar to Jegadeesh and Titman (1993) with some modifications, this study provides evidence on momentum strategy. That is strategy of buying stocks with high returns (winners) over the previous two and three months and selling stocks with low returns (losers) over the same period. The average differences between winner portfolios and loser portfolios in test period are 2.1% and 4.65 % in favor of winners, respectively. The result of this study is consistent with prediction of the under reaction hypothesis. This study also analyzes the relationship between momentum strategies and trading volume turnover (number of shares traded divided by the number of shares outstanding). The study reveals that momentum profits are more pronounced among high trading volume turnover stocks.
Keywords : Momentum Strategy, volume turnover stock, Malaysian Stock Exchange
I n t r o d u c t i o n
During the past decade there has been growing literature on the predictability of stock returns based on the information contained in past returns. One popular strategy is the momentum portfolio investment strategy, which recommends buying prior winners and selling prior losers and earns abnormal returns because prior winners will still perform better in the next period and prior losers will still underperform in the next period. Momentum strategy is based on the premise that market underreacts to information. For example, Jegadeesh and Titman (1993) and Rouwenhorst (1999) find evidence of significant profits using the momentum investment strategies. The evidence supports the idea that stock markets under react to information.
From previous studies, the source of the profit and the interpretation of the evidence are also widely debated. One of the theories that explain momentum effect is behavioral or non-risk based. They argue that momentum profits provide strong evidence of market inefficiency, and are due to stock price underreaction to information. Some studies found that the source of profit is related to firm characteristics i.e. size (Hameed and Yuanto, 1999; Chui, et al, 2000), book to market ratio (Hong and Stein 1999; Lewellen, 2002), and trading volume turnover (Rouwenhorst, 1999; Lee and Swaminathan, 2000). Another theory is provided by the efficient market supporters who argue that risk is the main source of momentum profits (Conrad and Kaul; 1998; Grundy and Martin, 2000; Jegadeesh and Titman, 2001; Chordia and Shivakumar, 2002).
In this study, we analyze the relation between momentum and trading volume turnover (number of shares traded divided by the number of shares outstanding) for the Malaysian stock market, as the interaction between momentum and measures of trading volume has attracted attention for various reasons. Momentum and trading volume are simultaneously determined in equilibrium. Technical analyst frequently use price / volume charts and believe that the relation between prices and trading volume provides valuable information about future prices changes (Blume, Easley and O’Hara, 1994). There is a large literature on the relation between price changes and trading volume over short horizons from a few minutes to one month (Karpoff, 1997).
L i t e r a t u r e R e v i e w
Momentum strategy is done by purchasing securities that have performed well in the past and selling of securities that have performed poorly. Buying the “winners” and selling the “losers” will earn positive expected profits in the presence of positive serial correlation because current winners are likely to remain future winners and current losers are likely to continue to be future losers. Therefore, one implication of stock market under-reaction is positive expected profits from a momentum investment rule.
The first paper to test the momentum strategy is Jegadeesh and Titman (1993). Using a U.S. sample of NYSE / AMEX stocks over the period from 1965 to 1989, the relative strength portfolio are constructed by Jegadeesh and Titman . At the end of each month, all stocks with a return history of at least 12 months are ranked into deciles based on their past J-month return (J equals 3,6,9, or 12) and assigned to one of ten relative strength portfolio (1 equals lowest past performance, or “loser”, 10 equals highest past performance, or “winner”). These portfolios are equally weighted at formation, and held for K subsequent months (K equals 3, 6, 9 or 12 months) during which time they are not rebalanced. JT find that the 6 x 6 momentum strategy (the sixth-month ranking, 6 sixth-month holding period) generates returns of about 1% per month. They document that past winners on average continue to outperform past losers, so that there is momentum in stock prices.
The evidence of momentum in stock prices over the medium terms is well accepted and supported for the developed market in the US. For instance, see Chan, et al (1996, 1999), Maskowit and Grinblat (1999), Hong and Stein (1999), O’Neal (2000), Chordia and Shivakumar (2002), Cooper et al (2004) etc. Similar result are found on other stock markets Outside the US as well; see for example, Schiereck, Debondt, and Weber (1999), Rouwenshort (1999), Liu et al (1999), Chan, et al (2000), Glaser and Weber (2001), etc. However, these papers do not cover the same period of time and the methodologies used to detect momentum are not uniformed.
and Swaminathan (2000) find that momentum is stronger for higher turnover stocks in the US stock market. They also find that trading volume turnover predicts the magnitude and persistence of momentum profits over long horizons. Rouwenhorst (1999) uncovers that winners have higher volume turnover measures than losers in 16 out of 20 emerging markets. Chan, et al (2000) analyze momentum strategies implemented on international indices. They reveal that momentum is stronger following an increase in trading volume. Glaser and Weber (2001) also find that momentum is stronger among high volume turnover stocks. They support the hypothesis as high returns make investors overconfident and they will, as a consequence, trade more subsequently.
D a t a a n d M e t h o d o l o g y
Daily prices and trading volume are obtained from Pusat Komputer Professional, a company based in Kuantan, Malaysia. Adjustment is made to take into account of stock splits, rights, and dividends. All companies selected for analysis are from the main board and the period covered is January 1988 to December 2002. The number of companies will increase every year as we add new companies in the sample as they get listed.
To analyze the profitability of contrarian and momentum strategies, this study employs the methodology used by Jegadeesh and Titman (1993). This study will consider ranking periods, of r = 2 and 3 months and subsequent testing (holding) periods of h = 2 and, giving two strategies. Unlike Jegadeesh and Titman’s study, where portfolios involve overlapping periods, this study examines non-overlapping periods. This modification can at least reduce the bias arising from double counting resulting from the use of overlapping periods. In addition, Pan and Hsueh (2001) found that the international momentum effect appears to disappear when the analysis is conducted using non overlapping data. So, they conclude that the result is simply an empirical illusion due to the use of overlapping data.
The profits of contrarian and momentum strategies are calculated for the returns on buy-and hold method for both winner and loser portfolios whose stocks are ranked based on their returns over the past 2 and 3 months, labeled here as the ranking periods (RP). Stocks are divided into 10 equal-weighted portfolios whereby P1 represents the loser portfolio with lowest the returns, and P10 represents the winner portfolio with the highest returns. The study will focus only on the behavior of the two extreme portfolios i.e. loser portfolios (P1) and winner portfolios (P10). Following Jegadeesh and Titman (1993), the two extreme portfolios are used to examine the performance of zero cost contrarian and momentum strategies in the subsequent holding periods.
This study prefers the buy and hold returns instead of cumulative abnormal returns because they accurately reflect the actual return that investors receive from their investment (Barber and Lyon, 1997; and Kothari and Warner, 1997).
/ 1
This study uses logarithmic returns instead of discrete returns, as they are preferable for theoretical and empirical reasons. Theoretically, they are analytically more tractable when linking together sub period returns to form returns over longer interval (simply add up the sub-period returns). Empirically, they are more likely to be normally distributed, and they conform to the assumptions of standard statistical techniques (Strong, 1992). In addition, the use of logarithmic returns is common in contrarian and momentum literature.
Then, buy and hold abnormal return, BHAR, are calculated as follows:
In the following 2 and 3 months, described here as the test period (TP), the BHAR for all stocks in the winner and loser portfolios are calculated. The mean of these BHAR represent the cumulative buy and hold abnormal return for an equal weighted portfolio and is measured as
portfolio, and N is the number of stocks in each portfolio.
This procedure is replicated for each non-overlapping periods. The cumulative buy and hold abnormal return of the loser and winner portfolios are then averaged across all test periods:
where, LBHAR
_
is the average cumulative buy and hold abnormal return of loser portfolios, WBHAR
is the average cumulative buy and hold abnormal return of winner portfolios; and M is the number test period.
The final step of the trading rule is to determine the difference between returns on the average cumulative buy and hold abnormal return of winner portfolios and the loser portfolios that will generate significant abnormal profit.
If the momentum strategy works, assuming zero transaction cost, then the study will find that past winner portfolios outperform past loser portfolios in the test period:
BHAR BHAR
M W L
R _ _ (7)
where, RM is the return of momentum strategy.
A t-test will then be used to determine whether the difference is statistically different from zero.
To analyze the relationship between momentum and trading volume turnover, the sample of the stocks must have available data on volume trading. The daily trading volume turnover is measured as the number of shares traded on a particular day divided by the number of shares outstanding at the end of the day. The procedure for examining how momentum profits in the KLSE relate to volume turnover ratio is as follows. After finding losers and winners portfolios in the ranking period, the study also divides each portfolio of losers and winners from P1 to P10 into three equal sub-portfolios, these are portfolios of largest (30%), medium (40%) and smallest firms (30%). Then stocks are ranked in descending order based on volume trading turnover. This is similar measure as used in Hameed and Ting (2000), Rouwenhorst (1999), Hameed and Yuanto (1999), Hong and Stein (1999), and Glaser and Weber (2001).
R e s u l t s
Table 1
The winner (W), Loser (L), and momentum (W-L) portfolios are constructed based on the past r
month stock returns. The strategy divides all stocks into two groups, i.e. winners and losers, depending on whether the past r month cumulative returns of individual stocks are greater than the past r month returns of the market. For each r x h strategy and portfolio, the table reports average h
month holding period returns (return) over the sample period and t statistics. The t-statistics for W-L indicate whether the returns from momentum strategy of buying past winner and selling past loser to zero-cost trading strategies are significantly different from zero in the test periods. The sample period is January 1988 to October 2002. An asterisk * indicates that the t-value is significant at 5% level.
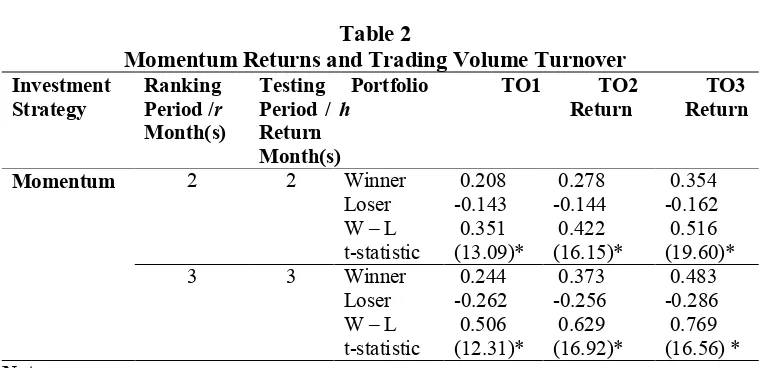
Focusing on the 2x2 momentum strategy, Table 2 shows that momentum profits for high turnover (TO3), the intermediate (TO2) and low turnover (TO1) portfolio are 51.6 %, 42.2 % and 40.1 %, respectively. Similar observations are found for the 3x3 momentum strategy. For example, the lower turnover stock (T01) has a return of 60.6 %, the intermediate turnover returns (TO2) have 62.9 %, whereas higher turnover returns (TO3) have a 76.9 %. All these returns are significant at 5 % level. Moreover, the winner portfolios drive mainly the average performance of the momentum profits among high trading volume turnover stocks.
Table 2
Momentum Returns and Trading Volume Turnover Investment
Strategy Ranking Period /r
Month(s)
The study defines turnover as the number of daily trading volume divided by the number of shares outstanding. Monthly returns for portfolio based on independent two steps sorting procedure on past returns and past average daily turnover were computed. Every month all stocks are sorted independently based on the return in the past r months and grouped into ten portfolios. P10 is the winner portfolio, P1 the loser portfolio. Then, the stocks are independently sorted based on the average daily turnover in the r ranking months. TO1 indicates the portfolio with the lowest 30% turnover stocks, TO2 represents the portfolio with medium 40% turnover stocks and TO3 describes as the portfolio with the highest 30% turnover stocks in the ranking period (r) and then held for h
subsequent months denoted as the test period. The t-statistic is denoted in the parentheses (significant at 5 % level)
C o n c l u s i o n
The success of momentum investment strategies above is a direct test of the weak form efficient market hypothesis. It could give a serious challenge to efficient market hypothesis if we assume that transaction costs do not influence the arbitrage portfolios. These strategies may imply that the markets are not efficient as future price are predictable. The weak form efficiency reveals that an investor cannot use past security price information to consistently earn a portfolio return in excess of returns that is in proper proportion with the portfolio risk. The evidence of this study shows that past winners will perform better in the next period, while past losers will perform worse in the future period.
This result is broadly consistent with prior empirical research on price momentum and turnover. Momentum is stronger among high trading volume turnover. This finding of this study contributes to a better understanding of the momentum effect. In addition, this result evaluates competing explanation for the momentum effect.
R e f e r e n c e s
Barber, Brad M., and Lyon, Jhon D. , 1997, Detecting long-run abnormal stock returns: the empirical power and specification of test statistics. Journal of Financial Economics, 43, 341-372.
Blume, L., D. Easley, and M. Ohara. , 1994, Market statistic and technical analysis: the role of volume. Journal of Finance, 49, 163-181
Chan, Louis K.C., Narashiman Jegadeesh, and Josef Lakonishok., 1996, Momentum strategies, Journal of Finance 51, 1681-1713.
Chan, Louis K.C., Narashiman Jegadeesh, and Josef Lakonishok, 1999, The Profitability of momentum strategies. Financial Analyst Journal, Vol. 55, No. 6 (November/December), 80-90.
Chan, Kalok., Alaudeen Hameed, and Wilson Tong, 2000, Profitability of momentum strategies in the international equity markets. Journal of Financial and Quantitative Analysis 35, 153-172.
Chui, Andy C.W., Sheridan Titman and K.C. Wei., 2000, Momentum, legal system and ownership structure; An analysis of Asian stock markets. Working Paper. The Hong Kong Polytechnic University Kowloon, Hong Kong.
Chordia, T., and L. Shivakumar, 2002, Momentum, business cycle, and time-varying expected returns. Journal of Finance, Vol.57, Issue 2, 1985.
Conrad, J., and Kaul, G, 1998, An anatomy of trading strategies. Review of Financial Studies, 11, 498-519.
Cooper, Michael.,R.C. Gutierrez, and A. Hameed, 2004, Market states and momentum. Journal of Finance, Vol. 59. No.3. 1345-1365.
Glaser, Markus., and Martin Weber, 2001, Momentum and turnover: evidence from the German stock market. Working paper, Universitat Mannheim.
Grundy B. and Martin S, 2001, Understanding the nature of the risk and the source of the rewards to momentum investing. Review of Financial Studies 14, 29-78.
Hameed, A., and Ting, S, 2000, Trading volume and short-horizon contrarian profits: evidence from the Malaysian market. Pacific-Basin Finance Journal ,Vol.8, 67-84
Hong, Harisson., and Jeremy C. Stein, 1999, A unified theory of underreaction, momentum trading and overreaction in assets market. Journal of Finance, Vol.54, 2143-2184
Jegadeesh, and Sheridan Titman, 1993, Returns to buying winners and selling losers: implication for stock market efficiency. Journal of Finance, Vol. 48, 65-91
Jegadeesh, N., and Titman, S, 2001, Profitability of momentum strategies: an evaluation of alternative explanations. Journal of Finance 2, 699-720.
Karpoff, Jonathan M., 1997, The relation between price changes and trading volume: A survey. Journal of Financial and Quantitative Analysis, 22, 109-125
Kothari, S.P, and Warner, Jerold B, 1997, Measuring long-horizon security price performance. Journal of Financial Economics, 43, 301-339.
Lee, Charles M.C. and Bhaskaran Swaminathan. , 2000, Price momentum and trading volume. Journal of Finance, Vol.55, No.5, 2017-2069.
Lewellen, J. , 2002, Momentum and autocorrelation in stock returns. Review of Financial Studies, 15, 533-563.
Liu, W., Strong, N., and Xu, X. , 1999, The Profitability of momentum investing. Journal of Business Finance and Accounting, Vol. 26, No. 9and10, 1043-1091
Moskowitz, T.J. and Mark Grinblatt , 1999, ‘Do Industries Explain Momentum?’, Journal of Finance, Vol. 54, No. 4,. 1249-1290.48.
Odean, T., 1998, Volume, volatility, price, and profit when all traders are above average. Journal of Finance 52, 1887-1934.
ONeal, E.S, 2000, Industry momentum and sector mutual funds. Financial Analysts Journal, July/August, 37-49.
Rouwenhorst, G, 1999, Local return factors and turnover in emerging stock market. Journal of Finance 55. 1439-1464.