Creating an Urban Legend:
A System for Electrophysiology Data Management and Exploration
Anita de Waard
1*, Shawn D. Burton
2,3, Richard C. Gerkin
2,3,
Mark Harviston
1, David Marques
1, Shreejoy J. Tripathy
3,4, Nathaniel N. Urban
2,31
Research Data Services, Elsevier, US, 2Department of Biological Sciences, 3Center for the Neural Basis of Cognition, and 4Program in Neural Computation, Carnegie Mellon University, Pittsburgh, PA; *Correspondence: [email protected]
Abstract
We have created a tool to identify and store experimental metadata during the execution of an electrophysiological experiment, and a semantic architecture to enable access, manipulation and integration of this data to support a collaborative research environment. We discuss possible extensions of this work to aid data sharing and semantic research frameworks.
Motivation
Understanding the electrical activity of the human brain is a leading focus in today’s scientific landscape (Alivisatos et al., 2012; Abbott, 2013; Insel et al., 2013; Pastrana, 2013). Electrophysiological experiments in model systems, such as the rodent brain, are central to these research efforts. At its core, neuronal electrophysiology involves the study of ion channels and the emergent electrical properties that channels imbue neurons and neuronal networks with (Hille, 2001). Understanding each ion channel and electrical property requires years of study. Thus, translating specific data about individual channels, neurons, and networks into knowledge about brain-wide activity and function requires effective sharing and integration of data across a great number of experiments and laboratories. A system capable of complete and effective integration of such data is not currently available. One of the greatest impediments to effective integration of electrophysiological data is that ion channels, and consequently neurons and neuronal networks, are tremendously sensitive to a host of experimental factors.
Such factors – the experimental metadata – include (but
are not limited to) model species (e.g., rat vs. mouse),
strain (e.g., Sprague-Dawley vs. Wistar), and age (e.g.,
perinatal vs. adult); experimental temperature (e.g., room
vs. physiological temperature); solution composition (e.g.,
high vs. low intracellular chloride concentrations); and
experimental equipment (e.g., sharp vs. patch electrodes),
and vary both within a laboratory – from experiment to experiment – and between laboratories. Even if two laboratories are willing to share their electrophysiological data, lack of sufficient and standardized metadata attached to each datum precludes accurate interpretation and effective integration of the shared data. Currently, this metadata is most often logged in laboratory notebooks during or after each electrophysiological experiment, and is therefore not easily compiled or shared. Thus, to apply a new analysis to published data, it is currently easier to repeat the published experiment than to attempt to acquire the published data and associated metadata. This practice is clearly insufficient if we are to achieve the large-scale, effective integration of electrophysiological data needed to map and understand human brain activity (Insel et al., 2013).
To overcome these limitations, we describe the construction of a new system that enables the collection of metadata in a digital, standardized format by the
experimentalist, during the course of an
electrophysiological experiment. This system, dubbed
Urban Legend (after the Urban Lab1 with which it was
co-developed), is an electronic laboratory notebook
application (“App”) that runs on tablet computers and
smartphones, and integrates with established
electrophysiology acquisition software, Igor Pro2 to
automatically synchronize experimental metadata with electrophysiological data on a metadata server. In this paper, we describe the system we have built to date, and our plans for future developments.
This project is a collaboration between Elsevier Research Data Services and the Urban Lab and funded fully by Elsevier. All software and metadata standards developed during the course of the project will be made openly available through GITHUB or open publications.
1https://www.bio.cmu.edu/labs/urban
Our System
Our system consists of five key components, sketched in Figure 1:
• Data Entry App • Metadata Server • Igor Pro Integrator • Ontology Integration • Data Dashboard.
These will now be discussed in turn.
Data Entry App
In building the App to capture the experimental metadata, we had three goals:
1.Make it easier to capture metadata digitally than with
any other means (paper lab notebook, ,web forms), thereby reducing barriers to early and consistent electronic metadata entry;
2.Give value back to the research lab by moving to a
digital-first experimental description and thereby facilitating compilation and sharing of research data;
3.Reduce the effort to create a highly lab-customized
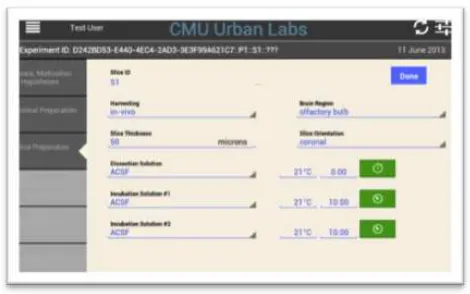
metadata capture system to help more rapid adoption. To achieve these goals, we built a data entry App that runs on any tablet device, and provides multiple mechanisms to create lists and generate automatic layouts for data entry: see the example data entry screen in Figure 2. The App can be customized either through a single data descriptor text file or through the metadata server, and changes to the App are applied instantly and automatically through the server. Because the App is continuously synchronized with the metadata server, the descriptions of all experiments are available to anyone in the laboratory as soon as the experiment is done, providing immediate value to the metadata captured.
Figure 1: Schematic Depiction of the Urban Legend
System Components.
Figure 2: Screenshot of the Data Entry App.
Workflow steps are followed by the left-hand tabs.
Metadata Server
The metadata server is largely invisible to the investigator, but it facilitates interoperability between all components: the electrophysiology acquisition software (written in Igor Pro), the Data Entry App, and the Data Dashboard. The only time a person directly interacts with the server is when they configure drop-down choices for the App or add new investigators to the list. The server provides the investigator list to the App and to Igor Pro, and the active run information to Igor Pro. The most important service provided by the metadata server is to save all experimental data and metadata from both Igor and the App to the cloud, where it can be accessed by the Data Dashboard.
The metadata server consists of 2 pieces: a PostgreSQL3
database and a Django4 web-application. The PostgreSQL
schema is very simple: each entity is identified by a type-4
(randomly generated) UUID5 and a scope string, and stores
the investigator, created and last modified timestamps, and a set of key-value pairs stored using the PostgreSQL
hstore6 extension. Investigators are stored in a second table
with an ORCID7 ID and a display name. (ORCID IDs are
used to uniquely represent investigators throughout the API), A third table stores the choices for drop-downs in the App. The Django web-application is an HTTP API with
simple API key based authentication and JSON8 as the
transport format. API endpoints currently exist to:
• get a list of investigator's ORCID IDs and display names
• get the drop-down choices for a specific investigator
• get experimental metadata,
• save experimental metadata
• activate a run, and
3http://www.postgresql.org/ 4https://www.djangoproject.com/ 5http://tools.ietf.org/html/rfc4122
6http://www.postgresql.org/docs/9.2/static/hstore.html 7http://orcid.org
• get the active run.
Igor Pro and the App can use these endpoints to coordinate efforts (the App activates a run, and Igor Pro gets the active run), as well as store metadata to the cloud. Since metadata is stored in a simple key-value pair format it is up to those programs to keep the data consistent and clean.
Igor Pro Integrator
Although in principle Urban Legend could leverage any software interface between the experimentalist and her
preparation, we demonstrate the project using Igor Pro9, a
program with strong community adoption in neuroscience, as well as in physics, chemistry, geology, and meteorology. It consists of a programmable GUI, a statically-typed scripting language with a compiler and debugger, and low-level extensibility via modules written in C/C++. The latter feature has been used previously to enable Igor Pro to control and acquire data from a wide range of instruments, including digitizers, cameras, and other devices used in electrophysiology. The former features make control of and acquisition with these devices transparent and flexible, as well as enabling data analysis and the production of publication-quality graphics. Within Igor Pro, there is a choice of software packages
implementing electrophysiology-specific requirements
including communication with specific instruments and graphical presentation/control of outputs/inputs meeting the needs of the experimentalist. To enable extraction of data and metadata from saved experiment files, any such package needs to implement an interface to the App and the metadata server.
We define this interface generally, and implement it for two choices of Igor package:
(1) "Recording Artist10", a package developed by one of
us [RG] and used in over a dozen laboratories worldwide; (2) Nathan Urban’s implementation of electrophysiology data acquisition in Igor Pro, a custom package developed by Nathan Urban for use in his laboratory.
For the Urban Legend project, use of Igor Pro is unchanged for the experimentalist, with the exception that a profile must be selected when Igor Pro is first opened to obtain the Urban Legend profile settings and coordinate information about experiment status. Everything else happens "behind the scenes", including the following stages:
(1) Igor Pro periodically obtains information about the
status of the current experiment, as indicated in the
scope under which each object was created (e.g., each
"sweep" was collected) can be determined later.
(3) Optional experimental metadata can be posted by Igor
Pro to the app.
(4) The completed experiment is exported in HDF5
format and uploaded to the server.
Once the HDF5 file is on the server, experimental metadata
is programmatically extracted, using the interface
described above. We chose to use HDF511 to store
electrophysiology data files in part because of its recommended use by electrophysiology data standards
group12.
Since different Igor Pro packages may store acquired data in different locations within the hierarchical Igor Pro file structure (which is inherited precisely by the HDF5 file), the interface must specify where particular pieces of data, and associated metadata, will be found within the file. For example, one interface method is GetSweeps(scope), which returns an array of HDF5 file locations investigator wishing to visualize data matching certain metadata attributes can do so quickly by using the Data Dashboard to constrain the search and explore it.
Ontology Integration
An essential part of the Urban Legend project is ensuring that the collected data remains clear and understandable throughout the research life cycle. This is helpful to scientists when they are reviewing their own data, as well as to other scientists or collaborators who wish to view or reuse this data.
To this end, we plan to semantically mark-up the collected data and metadata, which will serve to provide linked, self-referencing definitions for the entities contained in the database. For example, when denoting information about the specific strain of mouse used in a particular experiment, we will use the unique animal strain identifier and hyperlink provided by Jackson Laboratory, the animal vendor. Similarly, when analyzing the collected electrophysiological data and calculating neuron-specific measurements such as action potential amplitude and width, these measurements will be denoted using identifiers and definitions provided the Ontology for
Experimental Neurophysiology (OEN13).
11http://www.hdfgroup.org/HDF5/
A key advantage to semantically marking up the data (as opposed to informally using strings to denote concepts) is that doing so makes the data much easier to find and reuse by other resources. For example, because we plan to use
unique identifiers provided by NeuroLex14 to refer
recordings made from individual neuron types, aggregators such as the Neuroscience Information Framework (Gardner et al, 2008) will then be able to find and link to these recordings when specific neuron types are queried. Once the system is fully implemented we will make the full data spec for all metadata collected and the corresponding ontology classes and instances in the ontologies described above, publicly available.
Data Dashboard
The final planned outcome of this system is a tool that will help the PI, and everyone in the laboratory, assess the results of the collected experimental results and analyze them to find correlations and connections between different results. Since all metadata will be stored in a server and normalized to a series of ontologies, it will be possible to do this work locally and remotely, and enable collaborations with other groups, and allow integration with other data sources, such as NIF (Gardner et al., 2008)
and Neuroelectro15.
The Data Dashboard is currently in the planning stages, but the plan is to have it contain four different steps:
1.Pick: this step will allow the researcher to select the experiments of interest, using search and browse functionalities working on the metadata collected in the App and the Igor Pro Integrator;
2.Process: this step allows the researcher to analyze the experiments using mathematical tools (such as
MatLab16 or Mathematica17) to find derived wave
properties of interest, and associate them with an experimental data set or collection;
3.Plot: this step allows the researcher to plot, compare, and analyze the processed data and see correlations, overlaps and other connections between different data sets, ordered by metadata;
4.Publish: this step allows export of any of the graphs/plots/data generated above into a publishable format (e.g. PPT/Word images, other image formats, other experimental settings and environments. We will be making all of our software, vocabularies and metadata standards available in open source, so these can be used to build similar systems in other research environments. In particular, we believe that the conceptual system outline – the five components described above – can be a useful architecture for any system used to store, manage and analyze research data. Integration with other tools is an
exciting direction that we are eager to pursue; e.g., we
believe there are great possibilities for integration of these components with laboratory information management systems, workflow tools, institutional data repositories and authoring and editing tools.
A lack of willingness to share data with the world at large is a known inhibitor for use of research data management systems (see e.g. Borgman, 2012). That is why an essential aspect of this system is that, although the architecture and standards used are open and interoperable with current Linked Data models, in our project the researchers themselves stay in total control of the data at all times. It is up to the individual researcher (the Principal Investigator, or head of the laboratory) to decide whether
References
Abbott A (2013). Brain-simulation and graphene projects win billion-euro competition. Nature News, 2013: doi:10.1038/nature.2013.12291
Alivisatos AP, Chun M, Church GM, Greenspan RJ, Roukes ML, Yuste R (2012). The brain activity map project and the challenge of functional connectomics. Neuron 74:970-974.
Borgman, CL (2012). The Conundrum of Sharing Research Data, Journal Of The American Society For Information Science And Technology, 63(6):1059–1078, 2012.
Gardner D, Akil H, Ascoli GA, Bowden DM, Bug W, Donohue DE, Goldberg DH, Grafstein B, Grethe JS, Gupta A, Halavi M, Kennedy DN, Marenco L, Martone ME, Miller PL, Müller HM, Robert A, Shepherd GM, Sternberg PW, Van Essen DC, Williams RW.(2008). The neuroscience information framework:
a data and knowledge environment for neuroscience, Neuroinformatics. 2008 Sep;6(3):149-60. doi: 10.1007/s12021-008-9024-z. Epub 2008 Oct 23.
Hille B (2001). Ion Channels of Excitable Membranes, 3rd Ed. Sinauer Associates: Sunderland, MA.
Holdren, JP (2013). Memorandum re. Increasing Access to the Results of Federally Funded Scientific Research, February 23,
2013, available at
http://www.whitehouse.gov/sites/default/files/microsites/ostp/ostp _public_access_memo_2013.pdf
Insel TR, Landis SC, Collins FS (2013) The NIH BRAIN Initiative. Science. 240:687-688.