Fluxgate Magnetic Sensor
Mitra Djamal
2,
Yulkifli
1,21
Theoretical High Energy Physics and Instrumentation Research Group, Faculty of Mathematics and Natural Sciences
Institut Teknologi Bandung, Jl. Ganesa 10, Bandung, 40132, Indonesia (Tel: +6222 2500834 Fax: +6222 2506452; E-mail:[email protected]) 2
Electronic and Instrumentation Research Group, Faculty of Mathematics and Natural Sciences, Universitas Negeri Padang, Jl. Prof . Dr. Hamka Padang, 25131, Indonesia,
(Tel: +62751 7057420, Fax: +62751 7055628; E-mail: [email protected])
Abstract- The paper explains design, development, and applications of a fluxgate magnetic sensor, which is based on second harmonic Fourier component. The sensor is used to measure an external magnetic DC or low-frequency AC field,
ext
B
. The probe is driven periodically into saturation by asinusoidal current that flows through the premagnetization coil. It can be shown that the amplitude of the second harmonic frequency component will be measured by external magnetic field. Some applications of the fluxgate sensor, e.g. non-contact current measurement, vibrations and displacement measurements, have been developed and tested.
I. INTRODUCTION
Magnetic field strength is measured using variety of different technologies. Each technique has unique properties that make it more suitable for particular applications. Magnetic field is one of the most important physical quantities that has been used in many applications, such as: research of magnetic materials, geophysics, space, navigation system (detecting wafting goods), mapping of earth's magnetic field, electronic compass, determination of object’s position or sensor apart in small order [1-5] and many other applications. These applications can range from simply sensing until precise measurements of a magnetic field.
Based on magnetic field strengths and measurement range, magnetic field sensors can be divided into two categories: sensors that are used to measure low fields (<1 mT) -commonly called magnetometers- and sensors for measuring high fields (>1 mT), are usually called gauss meters [6]. Magnetometer can be divided into vector component and scalar magnitude types. The induction coil, fluxgate, SQUID, magnetoresistive and fiber-optic include into vector component, on the other hand the proton precession and optically pumped are part to scalar.
The heart of a fluxgate magnetometer is the fluxgate. It is the transducer that converts magnetic field into electric voltage. The fluxgate is the most widely used magnetic field vector measuring instrument. It is rugged, reliable and relatively less expensive than the other low-field vector measuring instruments. These characteristics, along with its ability to measure the vector components of magnetic fields over a 0.1 nT to 1 mT range from dc to several kHz, make it a very
versatile instrument. Geologists use them for exploration and geophysicists use them to study the geomagnetic field (about 20 µT to 75 µT on the Earth’s surface). Satellite engineers use them to determine and control the attitude of spacecraft, scientists use them in their research, and the military uses them in many applications, including mine detection, vehicle detection, and target recognition. Some airport security systems use them to detect weapons [5,6].
The paper explains design, development and applications of fluxgate magnetic sensors. It is arranged as follows: section I is introduction, section II describes the theoretical background included basic operation, transfer function and demagnetization factor, section III explains influence parameters of the sensor e.g. effect of pick up coil number and effect of demagnetization, section IV shows some application of the sensors, and finally section V is the conclusion.
II. THEORETICAL BACKGROUND
A. Basic Principle of Operation
The basic functional principle of the fluxgate sensor is as follows. A probe having a probe core of highly saturable material and at least two windings, a premagnetization winding and pick winding, is used to measure an external magnetic DC or low-frequency AC field,
B
ext . The probe core is driven periodically into saturation by sinusoidal premagnetization fieldB
ext produced by a sinusoidal current that flows throughFig. 1. Basic Principle of second harmonic fluxgate sensor [2] .
The curve in the maximum regions become broader and the minimum values will become more sinusoidal, as shown by the dote lines in Fig. 1c and d. A Fourier analysis shows that now odd- and even-frequency components are present (Fig. 1 e, f and g). The second harmonic Fourier component varies with the external magnetic field applied. Hence the amplitude of the second harmonic frequency component will be a measure of the external magnetic field.
B. Transfer Function
The transfer function of a fluxgate magnetometer can be calculated by evaluating the output voltage of the probe by using a polynomial approach and looking for the frequency components which are within the magnetic flux density of the probe core [2,7]. The use of polynomial approach simplifies the subdivision into frequency components. When a triangular approach is used, a more complicated subdivision into Fourier components has to be performed.
Assuming that the probe core is of the linear type, a sinusoidal premagnetization field will saturate it [7]. It will be superposed on the external magnetic field
H
ext. The magnetic field within the probe core will be(
)
where N is the demagnetization factor for a linear probe core. To calculate the flux density within the core, it is more advantageous to normalize the internal magnetic field strength
to
H
0*, which is set tohence, the internal magnetic field strength becomes
t
The magnetization curve itself will be approximated by a normalized polynomial approach of the third order [2]. This approach is used for both the positive and the negative
branches of the magnetization curve. The normalized flux density becomes
It can be seen that the second harmonic component is proportional to the external magnetic field strength. The output voltage of the pick-up coil is proportional to the time derivative of the flux density inside the core. The output voltage of pick-up coil will be reproduced by the normalized output voltage:
0
and A is the cross section of the probe core. The second harmonic component of the output voltage of the pick-up coil is then
as a linear approximation where K is a constant as function of demagnetization factor, the peak value of the premagnetization current, the shape of the core, the polynomial coefficient
a
3, and the saturation flux density of the core. The second harmonic component of the output voltage of the pick-up coil is proportional to the magnetic field which will be measured and the frequency of the premagnetization current.C. Demagnetization factor
The demagnetization factors of ferromagnetic objects have been studied both analytically and experimentally in many publications. According to C. Hinnrichs [8], there are two kinds of demagnetization factor which affect the fluxgate sensor output. The first is the primary demagnetization factor (Dprim), which caused by the primary coil or the excitation coil.
Dprim is affected by excitation current, which theoretically a
closed circuit core which has a very small value (even zero), thus it is neglected. However, in practice it is not zero, due to defective fabrication [9]. The second is demagnetization factor (Dsec), caused by the secondary coil (pick-up coil). Dsec is
responsible for external magnetic field that will be measured, hence it affects the sensor output voltage.
Relationship output voltage and demagnetization factor can be seen in equation (7): relative permeability of the core material of sensor, and
A
is its cross sectional area (We consider the pick-up coil areaA t
( )
is constant). Equation (7) shows clearly the relation between demagnetization factor and sensor output voltage. The highest sensor output voltage obtained for demagnetization factor D is equal to zero. Demagnetization factor of 1 would yield a zero output [1].[11-13]. The effective demagnetization factor measurement was realized by applying the definition of apparent permeability (µa) to self-inductance of sensor core and pick-up coil as shown (8).
_
_
1,
core no core coil a
no core core
L
L
A
L
A
µ
=
⎛
⎜
⎜
−
⎞
⎟
⎟
+
⎝
⎠
(8)
where
A
coil is the average winding area, l is coil length and_
no core
L
is the self inductance of coil without the insertedferromagnetic core,
A
core is average core cross-sectional area andL
core with the inserted core. The apparent permeability value can be obtained from the measurement of the coil self-inductions with and without core as well as from the estimation of the coil and core cross-sectional area. The relation between apparent permeability and demagnetization factor D shown in [11,12] can be rewritten as follow:1 1
r a
r
D
µ µ
µ
− =−
(9)
III. INFLUENCE FACTORSOF FLUXGATE SENSOR
The output voltage of fluxgate sensor the influence are many factors, such as: turn number of excitation and pick-up coil, geometry of sensor element, tape core-layer number, and properties of ferromagnetic as core materials [13-16]
A. The Effect of Pick-up Coils Winding Number
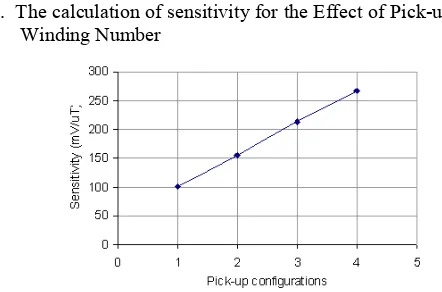
1. The calculation of sensitivity for the Effect of Pick-up Coils Winding Number
Fig. 2. Sensor output signal as function of magnetic field with different pick up coil winding number.
For investigating the effect pick-up coils winding number, experiments have been carried out by varying the number of pick up coils: 20x2, 40x2, 60x2, and 80x2 turns using 4 layer ferromagmetic core, as shown in Fig. 2. The Fig. 2 shows that the increasing of the number of the pick-up coil increases the sensor sensitivity (101.8 mV/µT, 154.9 mV/µT, 212.8 mV/µT, and 266.7 of pick-up coil respectively).
2. Calculation of demagnetization Factor for the Effect of Pick-up Coils Winding Number
The relationship between the number of pick-up coils turn and the demagnetization factor was measured by using fluxgate sensor element as shown in Fig. 3.
Fig. 3. Construction sketch of fluxgate sensor element.
The element of the fluxgate sensor consists of core, pick-up coils and excitation coils. The core uses ferromagnetic material with size: thick 0.025 mm and width 0.75 mm, and ribbon shape from Vitrovac VC 6025Z (Vacuumschmelze GMBH, Hanau) [17], furthermore the coil uses email wire with diameter of 0.09 cm. The dimension of the sensor is : length 23.6 mm, core width 0.75 mm, core thick 4x0.025 mm, coil diameter 2.3mm, so the value of
A
coreis 1.5x10⁻⁷
m2 and
A
coilis 8.31x10⁻⁶ m2. The investigation was carried out by varying the number of pick up coils.
Fig. 4. The apparent permeability factor as function of pick-up configurations
The Hewlett-Packard 4248A precision LCR meter with Kelvin clips was used to measure the coil self-inductance from the frequency of 0.1 to 1000 kHz for coil without inserted core and inserted core.
Fig. 5. The demagnetization factor as function of pick-up configurations
IV. APPLICATIONS OF FLUXGATE SENSOR
In order to understand the performance of fluxgate sensor, some applications, such as non-contact current-, vibrations- and displacement-measurements have been investigated.
A. Fluxgate as current sensor
One of the interesting applications of the fluxgate is to measure current [4].
Fig. 9. Design of current measurement system
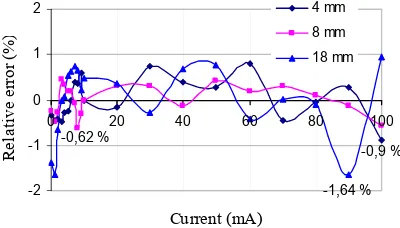
Fig. 9 shows the design of the current measurement system. On the PCB (Printed Circuit Board) a stripe with 20 cm length is made for current flow. The magnetic sensor is put perpendicular to the stripe. Small current from 0 to100 mA is flown on the PCB-stripe. Measurements are carried out for different distances, e.g. 4 mm, 8 mm, and 18 mm.
The sensor characteristic and its relative error are shown in Fig. 10 and 11. Fig. 10 shows that there is a linear relationship between current and output signal. A mathematical model with linear approximation is used for modeling these sensor signals.
Fig. 10. Sensor output signal for small current.
Based on this mathematical model, we found the relative error 0,9%, 0,62%, and 1,64% respectively for distance 4 mm, 8 mm,18 mm (see Fig. 11 ).
-2 -1 0 1 2
0 20 40 60 80 100
Current (mA)
R
e
la
ti
v
e
e
rro
r (%
)
4 mm 8 mm 18 mm
-1,64 % -0,9 % -0,62 %
Fig. 11. The relative error of the sensor for small current
B. Fluxgate for small distance measurement (proximity sensor)
Magnetic sensor offers a very attractive alternative for a non-contact displacement measurement [3,18]. It gives more benefits in terms of cost, eases of deployment and maintenance, and enhanced measurement capabilities. By applying magnetic sensor, smaller displacement can be detected rather than the ordinary sensor. Besides that, this sensor is separated from the object (non contact measurement), so that it can avoid thermal and mechanical influence of object. Fig. 12 shows the measurement system of distance using permanent magnet.
Fig. 12. The measurement system of distance using permanent magnet [3].
The object moves along the detector axis. The material that attached to the micrometer also moves at the same direction. The detector is placed several millimeters from one end of the material.
0 2 4 6 8
15 16 17 18 19 20
d (mm)
V
out
(
V
)
Fig. 13. Curve of distance measurement result.
micrometer. The measurement is done by the interval until ends at 20 mm. So, the range of measurement is about 5 mm. Fig. 13 shows the curve of output vs. distance.
From the Fig. 13 above can be seen that the output voltage is proportional to 1/r. It seems linear, but if it is approximated by a linear function, the curve still has significant errors. When linear function (orde 1) is applied to approach curve in Fig. 13 the distribution of data is very large, we obtained the maximum absolute error that occurred in this approximation is ±250 mV. Polynomial function of 2nd order can be used to reduce significant errors. If we used this equation rather than a linear equation, the maximum error can be reduced. The output error concerning to the equation result is quite small. The absolute error of this approximation is shown in Fig. 14.
-30 -20 -10 0 10 20 30
15 16 17 18 19 20
d (mm)
Vo
u
t (m
V
)
Fig. 14. Significant absolute error using polynomial function
The maximum absolute error that occurred using polynomial function is 28 mV or 19 μm. The maximum relative error from the graph in Fig. 15 is about ±0.5% of full scale output. This error is small enough, but appears a periodically error curve.
-0.50 -0.25 0.00 0.25 0.50
15 16 17 18 19 20
d (mm)
R
e
la
ti
v
e
e
rro
r (%
)
Fig. 15. Relative error using polynomial function
C. Fluxgate as Vibration Sensor.
Based on its measurement range, magnetic sensor is classified in three categories: low field (below 1 µG), medium field (1µG-10µG) and high field (above 10 µG) [19].
With its ability to detect weak magnetic field, fluxgate has high possibility to be applied as a vibration sensor, especially vibration with very small amplitude [20,21]. The benefit of fluxgate sensor is its contactless measurement to the object, so by measurement one should not turn off the engine.
Fig. 16. Working principle of fluxgate vibration sensor
The working principle of vibration measurement based on position-change to time can be seen in Fig. 16. To get the characteristic of the developed vibrating sensor, a measurement system has been built.
Fig. 17. Output amplitude of vibration sensor.
The magnetic material is placed on the vibrating source while the fluxgate sensor is placed at the static holder. The static distance between fluxgate sensor and the rest position of the vibrating object is setting between 15 and 50 mm. The parameters observed are amplitude and frequency. The amplitude is measured using graph HP34401A digital multimeter, it measures signal as an AC signal. These amplitudes and frequencies are plotted in Fig. 17. There are peaks of amplitude in each distance. The peak of the amplitude shows the resonant frequency of the vibrator.
Fig. 18. The output frequency at 30 mm distance
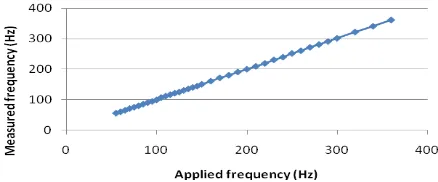
The distance range of fluxgate sensor is laying between 15 mm to 50 mm. The maximum amplitude is obtained at the distance of 30 mm (see Fig. 18), so it is the optimum distance to get maximum amplitude value of the output. Output frequency is displayed using Labview 8.0 software. It displays the real-time signal and the frequency of the output. The analog signal is directly inserted to soundcard of PC, and then the Labview 8.0 software gets the data from the card. The displayed data is recorded for error evaluation.
output frequency within the range is plotted in the graph, it looks linear compared to the input frequency. Fig. 19 shows the graph of the output frequency vs. applied frequency at the distance of 30 mm between the object and the sensor.
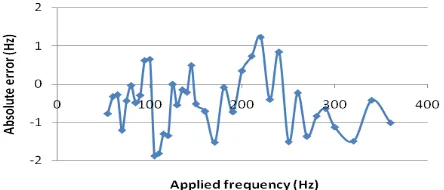
Fig. 19. Absolute error of the developed fluxgate vibration sensor.
Fig. 20. Relative error of the developed fluxgate vibration sensor.
By using linear model, we can find errors. The first error is absolute error, it comes from the comparison of the result of real frequency and the sensor’s output frequency. The absolute error is shown in Fig. 19. We can see that the maximum error within the range is 2 Hz. The second error is the relative error, which comes from comparison of the absolute error and the frequency measurement range, we obtained maximum relative error is still below 0.75% as shown in Fig 20.
V. CONCLUSIONS
The Demagnetization factor is influenced by turn number of pick-up coils The increase of pick-up coil winding number decreases the demagnetization factor of fluxgate sensor. Therefore, it is important to keep the demagnetization factor of the sensor core as low as possible to reduce its influence to the sensor output signal.
The fluxgate magnetometer can be used for current measurement without interrupting the current flow. The choice of the position depends on the current flow. For low current (0 – 100 mA), the distance 4 mm (rel. error <0.9%) shows better result than 8 mm (rel. error <0.62%) or 18 mm (rel. error <1.64%).
Magnetic sensor offers a very attractive alternative for non-contact displacement measurement. The use of the developed fluxgate magnetic sensor for displacement measurement in the
range of 15 until 20 mm shows a good result with accuracy of 19 µm and relative error <0.5%.
The fluxgate can be used for vibration sensor. The developed vibration sensor has optimum distance (between sensor and vibrating source) of 30 mm with relative error under 0.75%. The used vibrating source works in the frequency range between 55 until 360 Hz.
ACKNOWLEDGMENT
This work was supported by Riset KK ITB under contract No. 262/K01.7/PL/2009.
REFERENCES
[1]. P. Ripka, “Mangetic Sensor and Magnetometers,” Artec House, 2001. [2]. W. Göpel, J. Hesse, J. N. Zemel, “Sensors, A Comprehensive Survey,”
Magnetic Sensors, VCH Publishers Inc., Suite, 1989.
[3]. Yulkifli, Rahmondia Nanda S., Suyatno, Mitra Djamal, “Designing and Making of Fluxgate Sensor with Multi-Core Structure for Measuring of Proximity,” Procd. On CSSI, Serpong Tanggerang- Indonesia, 2007 [4]. M. Djamal, Rahmondia, N., S., “Sensor Magnetik Fluxgate dan
Aplkasinya untuk Pengukuran Kuat Arus,” J. Sains dan Teknologi Nuklir Indonesia, III, pp. 51-69, 2007.
[5]. Kaluza, F., Angelika Gruger, Heinrich Gruger, “New and Future Applications Flxgate,” J. Sensors, Sensor and Actuator, 106, pp. 48-51, 2003.
[6]. S. A. Macintyre, “Magnetic Field Measurement,” CRC Press LLC, 1999.
[7]. M. Djamal, R. N. Setiadi, “Pengukuran Medan Magnet Lemah Menggunakan Sensor Magnetik Fluxgate dengan Satu Koil Pick-up,” Jurnal Proceedings ITB 2006.
[8] C. Hinnrichs, J. Stahl, K. Kuchenbrandt, and M. Schilling, “Dependence of Senitivity and noise if Fluxgate Sensors on Racetrack Geometry,” IEEE Trnas. Magn., 37 No. 4 pp 1983-1985, 2001.
[9]. S. Liu, “Study on the low power consumption of racetrack fluxgate,” Sensors and Actuators A 130-131. pp. 124-128, 2006.
[10]. P. Ripka, “Race-track fluxgate with adjustable feedthrough,” Sensors and Actuators A 85, 227–231, 2000.
[11]. J. Kub´ık, “PCB fluxgate sensors, Dissertation thesis,” CTU in Prague, pp. 56–58, 2006.
[12]. F. Primdahl , B. Hernando, O.V. Nielsen and J.R. Petersen, “Demagnetizing factor and noise in the fluxgate ring-core sensor,” J. Phys. E: Sci. Instrum. 22 1004–8, 1989.
[13]. J. Kubik, P. Ripka, “Racetrack fluxgate sensor core demagnetisation factor,” Sensors & actuators A 143, pp, 237-244, 2008.
[14]. F. Primdahl, P. Brauer, J.M.G. Merayo, O.V. Nielsen, “The fluxgate ring-core internal field,” Meas. Sci. Technol. (13), 1248–1258, 2002. [15]. Yulkifli, M. Djamal, R. N. Setiadi, Khairurrijal, D. Kurniadi, “The
Influence of Ferromagnetic core, Pick-up Coil Winding Number and Environmental Temperature to the Output Signal of a Fluxgate Magnetic Sensor,” Indonesian Journal of Physics Vol. 18 No. 3, 2007.
[16]. Baschirotto, A. E. Dallago, P. Malcovati, M. Marchesi, G. Venchi, “Development and Comparative Analysis of Fluxgate Magnetic Sensor Structure in PCB Tecnology,” IEEE Transaction on Mangetics, 42 No. 6 pp. 1670-1680. 2006.
[17]. www. vacuumschmelze.de
[18]. M. Djamal, R. Nanda, “Displacement Sensor based on Fluxgate Magnetometer”, Proc. of APS, Bandung, 2006.
[19]. Caruso, M.J, Tamara B. (1998), “A New Perspective on Magnetic Field Sensing,” Sensor Magazine, Magnetic Sensor, www.ssec.honeywell.com.
[20]. M. Djamal, R.N. Setiadi, Yulkifli, “Preliminary Study of Vibration Sensor Based on fluxgate Magnetic Sensor,” Procd. On ICMNS, 2008. [21]. Hendro, dkk., 2007, “Pembuatan Sensor Getaran Berbasis Fluxgate,”
![Fig. 1. Basic Principle of second harmonic fluxgate sensor [2] .](https://thumb-ap.123doks.com/thumbv2/123dok/4003107.1946527/2.595.79.251.54.237/fig-basic-principle-second-harmonic-fluxgate-sensor.webp)