INTRODUCTION
The new era of regional administration in Indonesia was marked by the enactment of the Law No. 22 of 1999 on Regional Administration, later revised by the Law No. 32 of 2004. Several issues mark this new era. First, the implementation of the so called broad range of regional autonomy in which most of the governmental func-tions are delegated to the cities/regencies and provincial administrations. Second, the direct election of the mayors, regents and provincial governors.
Prasojo et. al. (2006) notes that the new systems on local election could improve the quality of local
admin-istration services as long as the elected officials are adequately qualified, have pro-people vision, and empha -size on regional development as well. There are many
cases where the elected officials are inadequately quali
-fied to perform his/her duties. Under such circumstances, the local services tend to be under-qualified, and at the
same time the regional development is also threatened. In some very rare cases, however, the new direct local
elec-tion could elect a credible partner of officials who could
properly perform their duties to serve the need of soci-ety. Moreover, Prasojo (2011) pointed out the important
role of local government’s leadership. A series of field
research conducted by Prasojo suggest that an innovative-development achievement shown by several local govern-ments were mostly due to the high commitgovern-ments of local leadership to implement local development. However, it is due not only to high commitment and legitimacy,
but also to the strong political will to implement local autonomy in order to serve the need of local community. Certain innovative local leaderships are usually working out of the box, trespassing the boundaries of standard rule of law. Those innovative mayors, regents or governor are conducting many innovative policies that could be
identi-fied as beyond the standard rule of the game.
Sumardi points out several leadership factors, contrib-uting to implementation of local autonomy, i.e.: the abil-ity to manage and to implement the local autonomy that serves people’s interest; the ability to adopt nation-wide regulations into to the local conditions, including inno-vative breakthroughs to develop local potentials, and holding a certain degree of legitimacy either as mayor or member of local council; ability to improve local
compe-tence which is significant in increasing local government
revenues; and ability to develop local human resources, especially those who are adequately capable to handle regional development affairs (Sumardi, 2002).
The important role of local leadership contributing to
the regional development is also identified by Svara et.
al. (1994), who introduced a facilitative leadership model
among mayors and vice mayors in the United State of
America. There are three characters of that leadership: (1) leadership style to encourage their subordinates to opti-mize their duties, (2) type of leadership’s interaction with members of staff, and (3) leadership approach to achieve organizational objectives.
Osborne and Gaebler (1992) stated that one of the prominent characters of a leader in improving the welfare ITA PRIHANTIKA AND SUDARSONO HARDJOSUKARTO
Institute for Sustainable Reform, Indonesia
Department of Sociology, Faculty of Social and Political Science, Universitas Indonesia [email protected] ; [email protected]
Abstract. This paper explores the leadership style of a direct-elected Mayor in the new era of local administration. Solo city, under the leadership of Mayor Joko Widodo, along with his political partner, Vice Mayor F.X. Hadi Rudyatmo, is currently referred to as practicing the best local government. The leadership of the political partner is perceived to be a role model of leadership style in the new era. A step by step guidance of cognitive mapping introduced by Ackerman et. al. (1992) is applied to construct the cognitive map and causal map of the Mayor’s policies on regional competitiveness. Meanwhile, the NUMBER method developed by Kim (2000 and 2005) is used to convert the causal map into a dynamic model system of the City Mayor’s policies. Many pro-people related policies and programs are believed to be important factors in enhancing regional competitiveness during the leadership of Mayor Joko Widodo. This study contributes to provide a role model of regional leaders’ best practice overview in building the area, particularly building the regional competitiveness.
of its people is applying the principles of entrepreneurial leadership of the state apparatus. The principle empha-sizes on the importance of leadership that is intrepid to change the orientation and professionalism of the local
officials to the emergence of innovation to enhance the
region’s autonomy through the creation of local revenue enhancement programs without having to hamper busi-ness opportunities for the private sector. Most of the outstanding regional heads have the courage to change the
authority of the autonomous region to one that is finan -cially less dependent on central government.
Actually, the consolidation of regional democracy, which among others, is done through the direct election of the regional head is expected to generate regional heads that will listen to the voice of the people and encourage the empowerment of its people. The second synergy of
this ability is considered very significant in ensuring the
realization of the objectives of the regional administra-tion which is in accordance with the provisions of Article
27 Sub-Article g of Law No. 32 of 2004, affirming the
obligation of regional heads to promote and develop the region’s competitiveness.
This study uses the concept of competitiveness, which is a broader concept than the concept of productivity or
efficiency. Competitiveness is defined as “the competence of economy,” so it is not merely “the competence of the
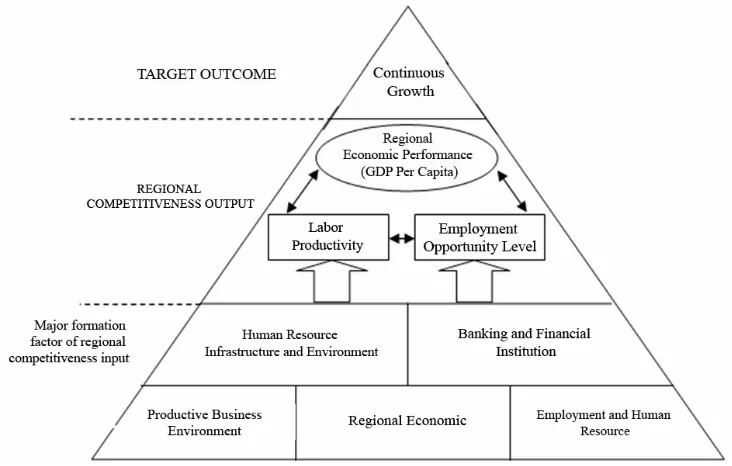
private sector or a company”. The goal of increasing the competitiveness of a particular economy is to increase people’s welfare, which is among others, measured by the increasing income and employment in certain areas. The keyword of increasing regional competitiveness is the openness of the region to both domestic and
international-scaled competitions (Ministry of National Development Planning, 2005). Figure 1 is an illustration of regional
competitiveness reprocessed from UNPAD (2008) and
Gardiner, et. al. (2004).
The European Commission (in Gardiner, et. al., 2004) defines competitiveness as the ability to produce goods
and services that suit the needs of international markets as well as the ability to maintain high and sustainable income. In general, competitiveness is the ability (of a
region) that is reflected on its external competitiveness,
increasing income and employments. Martin (2003)
stated that the concept and definition of competitiveness
of a country or region encompasses several key elements, namely improving the people’s standard of living, and being able to compete with other countries and regions, being able to meet its obligations both domestically and internationally, and providing employment and sustain-able development without putting burden on future
gener-ations. Stopper (1997 in Kitson, 2004) define region’s
competitiveness as a place competitiveness, as well as the ability of the regional economy to attract and retain companies in either a stable or dynamic market activity and at the same time maintain or improve the living stan-dards of each party involved.
One of the factors, that determines whether a region
can win the regional competition or not, is the figure of the
regional head himself. That means the leaders determine the way of the regional head’s models of policy improve the competitiveness of their regions or in other words, how the causal map regional head’s leadership enhances the competitiveness of their regions. Kim (2000) used the
term “causal maps” in describing the mental model of a
source : Gardiner et al, 2004
policy maker. Causal maps can be used for two purposes, namely to formulate a decision (decision assessment) and to diagnose the system (system diagnoses) (Perusich, 2010).
Causal map allows its users to structure certain themes. So that it can provide valuable clues in mapping the perception of the object of the research towards the
key issues (“nub”) in a particular theme. Objectives and targets can be identified and explored, as well as the exist
-ing policy options can be rechecked to find which policies are the most profitable and which need to be elaborated
in detail (Ackermann, et. al., 1992). Causal map consists of a series of interlinked options-outcome. Demands of the surrounding environment can have implications on the organization strategy. This concatenation will often connect the overall goals set by the organization and
policy maker (Eden and Ackermann, 2004).
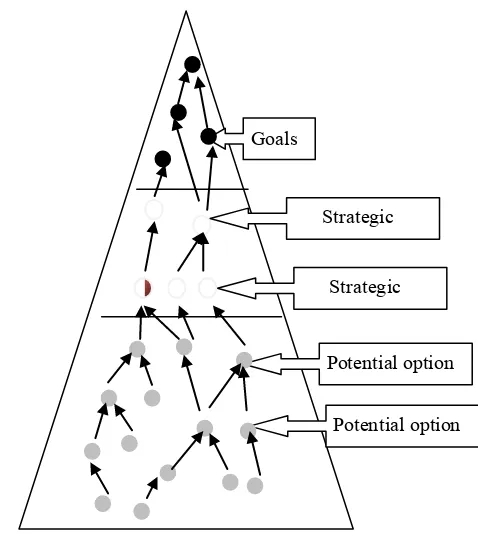
Causal map leadership policy on competitiveness can be developed in stages through the compilation of the cognitive map (Ackermann, et. al. (1992). The cognitive maps which are created manually are then made into a causal map by adding a sign of the causal relationship. The compilation of cognitive maps is carried out to determine the goals (objectives), strategic direction, and potential options. Goals in this hierarchy are the regional competitiveness, while the strategic directions are the factors forming the region’s competitiveness. The strate-gic direction group is comprised of the region economies,
banking and financial institutions, productive business
environments, infrastructures, natural resources and envi-ronments, human resources and employments, innova-tions, and internationalizations and accessibilities.
In relation to the leadership causal map of the regional head in formulating the regional competitiveness policy,
Center of Central Banking Studies and Education (PPSK) of Bank Indonesia in cooperation with the Laboratory of Researches, Community Services and Economic Studies (LP3E) in Faculty of Economics, Universitas Padjadjaran (2007) conducted a study of “Regional Competitiveness: its perspectives, profiles and measurements in the regen
-cies/cities in Indonesia “. The main method in this study
is the Analytic Network Process (ANP), with experts (expert opinion polls) as respondents who answer the
questions in the form of questionnaire. The mapping of regional competitiveness is based on two main forming factors, namely the input and output factors. Input factors consist of: the regional economy; human resources and employment; productive business environment; infra-structure, natural resources and environment; banking
and financial institutions. While the output factors consist
of: labor productivity; GDP per capita; and employment level.
Overall, the results of the competitiveness mapping shows that regions with high competitiveness is gener-ally dominated by the counties/cities whose economic basis is based on the wealth of natural resources and/ or regions whose economic activity is based on indus-trial and service sectors. Counties/cities that have the lowest region competitiveness are generally those with an economic base relying on the primary sector, particularly agriculture.
In addition to the aforementioned research, Rozan
Anwar (2009) examined the “Model Development Pertaining to the Influence of Able People and Agile
Process towards Dynamic Capabilities in the Public
Policy Process (A Case Study on Educational Services in Jembrana District, Bali Province)”. In his research,
the assumptions of able human role and agile processes as the compilers of dynamic capabilities are described, resulting in adaptive policy so that dynamic governance can be constructed. The study also aimed to understand the development process of dynamic capabilities and
the enhancement of models about the influence of able
principles of good governance (accountability, trans-parency and public participation) in education services policy in Jembrana.
One of regional heads who successfully develop his
region is the Solo Mayor Joko Widodo. There are profiles
of ten regional heads as leader of 2008 because they were thought to have innovations and breakthroughs in implementing regional development, one of which is Joko Widodo (Tempo Magazine, December 2008). Joko Widodo, with his partner F.X. Rudihadyatmo, gained absolute victory of 90.09% in regional head elections for second tenure in 2010. This is due to the various innova-tions that have been performed by Mayor Joko Widodo
in the first period of his leadership. Some of innova -tions carried out are removal of street vendors which is performed in a unique way, development in the educa-tion sector through the construceduca-tion Taman Cerdas for underprivileged children enabling them to have access to the library and computers, health sector development through Health Care for Solo Society program (PKMS) implementing the distribution Health Insurance for the Indigents card, State-owned Health Insurance, and other
health insurance financially supported by the regional
budget (Kompas, 2008).
Solo’s achievements under the leadership of Joko Widodo are also shown by improved rankings of Corrup-tion PercepCorrup-tions Index (CPI) which was 5:53 in 2008, improved to 6:00 in 2010 (Indonesian International
Transparency, 2010). This achievement also reflects the
improvement of the management system of Solo gover-nance. The bureaucracy reform led by Joko Widodo, not
only made him won the General Election for a second tenure but also awarded the Bung Hatta Anti Corruption
Award in October 2010. Some of the assessment criteria of this award include the mayor’s credibility and commit-ment to the eradication of corruption and new systems built in local government as well as the impact of it (The Jakarta Post, 2010).
In terms of investment in the region, the World Bank
(2010) writes that Solo is in the second rank in terms of business-starting convenience, the ninth rank in terms of construction licensing convenience, and in the 13th ranks in terms of property registration. The achievement in the ease of licensing is connected to the three reform agen-das carried out by Joko Widodo in delivering best perfor-mances of public service in Solo. These agendas include product management, brand management, and customer management.
It won’t be surprising then if Solo performs best prac-tice in terms of the arrangement of street vendors, the escalation of regional competitiveness, and eco-cultural city. For the year 2011, based on the Local Government
Performance Evaluation (EKPPD) The Ministry of Home Affairs, Solo City is in the first ranked in the category of
best governance performance (Media Indonesia, 2011). There is no doubt that the development is not only run by the mayor but also by all stakeholders. Within this framework, Svara, et. al. (1994) emphasizes that
facilita-tive leadership can improve the performance of officials
working under it. Similar emphasis is also pointed out
by Berg and Roa (2005), revealing that a good political
leadership of a regional head is the ‘heart’ of institutional reform of the local government. We can see clearly that the role of the leader determines the direction of a regional development.
In the context of Indonesia, the role of a directly
elected regional head is very significant in accomplish -ing the objectives of regional government. The research about the leadership form and style of a regional head in the construction of administration and bureaucracy paradigm after the publication of the book Fifth Disci-pline (Senge, 1990) is very limited. Thus, the research pertaining to the leadership of regional heads in the era of direct regional head elections by utilizing the systems thinking paradigm and methodology is very important. Firstly, the research is expected to identify the forms, models and styles of leadership that will be used as a role model of the formation of regional head’s leadership in the era of regional autonomy. Secondly, this study is also expected to enrich the systems thinking-based research in the culture of public administration and bureaucracy.
Therefore, this study aims to describe the causal maps of Joko Widodo’s leadership in formulating poli-cies of regional competitiveness in Solo. In addition, this research is also intended as a way to systematically docu-ment the leadership model that can be used as a reference in the development of regional head leadership and the implementation of regional autonomy in the future.
In fact, the Deputy Mayor plays a significant role in
helping the Mayor to gain the accomplishment described earlier. Although the running of the administration cannot be separated from the figure of the Deputy Mayor, the
object of this study is limited to the figure of Mayor Joko
Widodo. Thus, it does not examine the role of Deputy Mayor Rudyatmo F.X. Hadi.
METHODOLOGY
This study uses a pragmatic paradigm as its frame-work. This study uses the systems thinking approach,
specifically the system dynamics method with the type
phenomenon being studied and are selected based on the criteria agreed by the researcher, thus the subject is limited. Source of data used in this research is second-ary data from the second parties and secondsecond-ary data
directly obtained from the first party. Secondary data are
obtained through the written data in the form of press interview documents and footage, news archival/clip-pings, government documents (regional regulations of Solo, regulations of Mayor of Solo, and other government documents), speeches, interviews of the third parties, and so forth. These secondary sources are the key sources of data used in formulating the causal map of the Mayor of Solo. While the primary data obtained from interviewing the stakeholders are sources used to analyze the aspects of leadership and dynamic capabilities of governance in Solo.
These collected data from primary and secondary sources will be analyzed in two stages, i.e. manually (with guidance from Ackermann) and then by using
the NUMBER method (Normalized Units Modeling by Elementary Relationship), which is introduced by Kim
Dong-Hwan (2000 and 2005). Manual techniques of Ackermann, et. al. will result in cognitive map, by adding a cause-effect relationship the causal map will be generated.
The causal map is then, by implementing the NUMBER
method, will be converted into the system dynamics which are characterized by the presence of feedback loops in the constructed system.
Ackermann, et. al. (1992) in Prihantika (2011), formu-lates eleven guidelines in order to form the map (or in Kim’s term, the abstract simulation). Stage 1: to separate
sentences into different phrases. The mapping would be more effective by grouping the concepts according to their types, which are termed the layer. The simplest layer is goals (objectives) which are on the highest position, followed by strategic direction, and potential options. Phase 2: building a hierarchy to get the right model struc-ture. The goals are positioned on the top of the hierar-chy, and then supported by a concept indicating a strate-gic direction, followed by the existing potential options. Goals are things that are considered ‘good’ by the object.
Defining goals is very helpful to researchers because it is
the integration points and the point distinguishing the
exist-ing concepts. Stage 3: The definition of goals will be the end
of the top of the hierarchy in the maps and is the most super ordinate concept that will alleviate the researcher in writ-ing derivatives of these concepts. Stage 4: The strategic direction is a concept with the following characteristic: it has long term implications, high cost, it is unchange-able, requiring a portfolio to carry it out, and may require cultural changes. Sometimes the hierarchy between the
strategic directions is flat, but it always has a relationship
with the goals or potential option. Stage 5: The research-ers noticed the advresearch-ersative poles of a concept; it aims to clarify concept clarity. Stage 6: Researchers add the meaning of the existing concepts, including actors and their actions, by positing them in an important and possi-ble position. Through this step, the structure will become more dynamic. Stage 7: maintaining the authenticity of the concept, by not abbreviating phrases and words from research object. If it is necessary the actor who owns the concept can be added. Stage 8: Researchers iden-Goals
Strategic direction 1
Strategic direction 2
Potential option 1
Potential option 2
Source : Ackermann et al, 1992
tify the options and the impact of each pair of the exist-ing concepts by addexist-ing arrows connectexist-ing a concept to another. Decide which concepts that can be categorized as
‘means’ and which can be classified as ‘the desired end’. Each concept can be viewed as a choice that leads to the
super ordinate concept which in turn is the purpose of its subordinate concept. Stage 9: Researchers ensure that the more general concept is in super ordinate position to the concepts that form it. The more general concept is marked by more than one way to achieve it. Stage 10: in general, marking the main ideas of the research object is carried out by observing the starting point of the initial sentence of the object. This point can be a starting point to read the entire maps. The consequence could be a positive rela-tionships formed with other concepts, although it is possi-ble to turn it into a negative one. Stage 11: The research-ers conducted a recheck to comprehend the constructed maps and ensure a reason to isolate a concept and then chose to not connect it with the other parts.
Kim (2000) in Prihantika (2011), introduced the
method of ‘NUMBER’ (Normalized Units Modeling By Elementary Relationship) to alter the causal map into the system dynamics conducted in three stages: (1) Some of the variables in the causal map are selected as the variable level (stock ) based on the role of these variables in the map, (2) All variables will be normalized by ‘0 ‘and ‘1’, (3) Variables in the map will be linked with an element connection designed as a constraint that links between the variables.
The NUMBER method has two main assumptions.
Firstly, the whole variable can be represented with values
between 0 and 1. But it is not always fixated on the values
of 0 and 1. There are times when some variables have a gap
and a distance that has a negative value. But even if it is
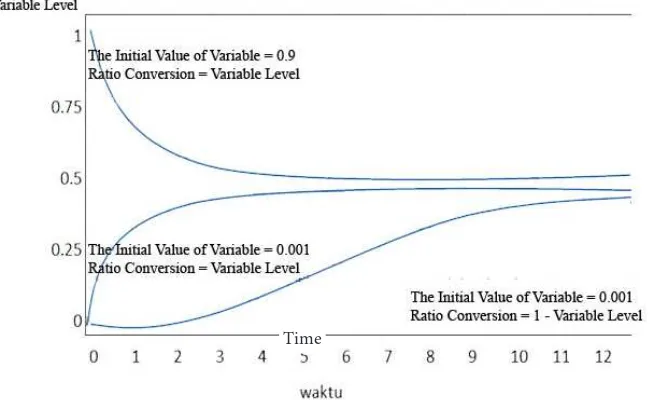
negative, it remains in a scale of 0 and -1. This restriction allows the variables to remain within acceptable limits and keeps a variable from affecting other variables in an extreme degree. Secondly, the basic relationship for each level of the variable will automatically affect the value of the variable level. Figure 3 shows how the equations in variable levels will be maintained at a value between
0 and 1. To ensure this, the increasing rate is defined as
going to 0 as a variable level value which is close to 1. This can be done by multiplying (1 - level variable) in the equation. On the other hand, the descent to zero level
is defined as a variable level value precluding the zero.
This could be conducted by multiplying the equation at the declined level of the variable. Thus, the value of the variable level will stop rising when it approaches 1 and stop decreasing as it moves closer to 0. In this way, the level of the variable will remain within 0 and
The main assumption in the NUMBER method is that
all concepts have a tendency to remain in their respective
balance point (see figure 4). This stability can be justi
-fied by the assumption that all concepts should be able to
maintain its value as long as there is no power that alters it. If there are indeed forces that affect a variable rate, then the value of the variable will change and leave the balance
point. Furthermore, the balance itself is influenced by the
other variables and feedback loops. If the feedback is more dominant than the basic relationship, then the level vari-ables will shift away from the balance point and showed
various reactions such as fluctuations of value, develop -ments and even decompositions. Feedback from the basic Table 1. Operating System for the Fission of Limitation Value of 0 and 1
Formula Meaning
A = 1- B B affects A disproportionately
A = 0 + B B affects A proportionally
A = 0.5 + B/5 B affects A proportionally
A = (B + C)/2 B and C affects A proportionally
A = (B – C)/2 B affects A proportionally and C affects A disproportionately
A = B * C B and C increase A
A = B * (1 – C) B increases A but C decreases A
A = (1 – B) * (1- C) B and C decreases A
relations will be strengthened if it is at the extreme values close to 0 and 1, and the other feedback will dominate dynamic variable levels more easily in normal conditions.
RESULTS AND DISCUSSION
Causal Map of Mayor Policy on Regional Competi-tiveness
The regional competitiveness has become the cogni-tive map goals of Joko Widodo’s leadership. To achieve those goals, there are seven factors that form his regional
competitiveness or strategic direction. The first strategic
direction is the economic competence. Figure 6 shows that Solo’s GDP has increased by almost 100% from 2005 to 2010. In relation to this regional economy, Joko Widodo starts by doing bureaucratic reform policy and the three stages of development, namely product management, brand management, and customer management, which are
followed by the various events held both domestically and internationally. The local and international tourist arrivals are anticipated by the primary service management policy to the customer by providing hospitality and service, so that tourists will come again to Solo.
Solo, as shown in figure 6, has experienced escala -tion in GDP of almost 100% from 2005 to 2010. In the economic policy area, Joko Widodo starts by reforming the bureaucracy and the three stages of development (i.e., product management, brand management, and customer management) which in turn increases domestic and inter-national events. The local and interinter-national tourist arrivals are anticipated by the primary service management policy to the customer by providing hospitality and service, so that tourists will come again to Solo.
In many occasions, the Mayor Joko Widodo asked the
Regional Work Unit (SKPD) of Solo to develop work
program and projects that are not only mere formality or Figure 5. The Time Behavior towards the Basic Relations
Figure 6 . Solo’s GDP in 2005 - 2010 *
Note: * in a trillion dollars, based on current prices
a small budget work program, but the programs should really be focused and sustainable (Joko Widodo, 2010).
Joko Widodo is very confident that local government
spending and investment in the infrastructure sector can be a stimulating factor to increase regional competitive-ness. That is why since 2006 Joko Widodo has allocated a substantial and adequate budget for the infrastructure sector of Solo, such as the construction of traditional markets and the relocation of street vendors.
The physical capital investment is very important to
assist micro, small and medium enterprises in Solo. Until
May 2011, 3711 of 5817street vendors have been success-fully relocated. The availability of this infrastructure not only promotes the progress of local businessmen but also invites businessmen from outside Solo. It is estimated that not less than 40% of street vendors who operate in Solo in 2011 are the settlers of the area around Solo. Revitaliza-tion of tradiRevitaliza-tional markets and the arrangement of street
vendors, have contributed a significant income for Local
Owned Revenue (PAD) of Solo, as seen in the market revenues in 2009 reaching IDR18.6 billion (Joglosemar Daily, 2010).
The second strategic direction is to increase the qual-ity of human resources and employment. The unemploy-ment rate in the city of Solo in the period of 2006-2009 ranged from 8.28% to 8.93%. To solve this unemploy-ment problem, the governunemploy-ment of Solo emphasizes on improving the local investment by provisioning facilities and legal certainty in the licensing services through the implementation of One Stop Service (OSS).
Apart from the unemployment issue, the quality of human resources is also a concern for Mayor Joko Widodo. Quality improvement of human resources in Solo can be seen from the data the Human Development Index
(HDI) which achieved the first rank in Central Java and
17th rank nationally with an index of 77.49 in 2010. HDI is assessed from the four components, namely life expec-tancy, illiteracy-free rate, duration of the school, and the expenditure per capita.
Mayor Joko Widodo also believes that the educa-tion sector is instrumental in improving the quality of human resources and employment. The education sector obtained a large amount of budget allocation, reaching IDR 20 billion by 2010, which came from the Special Allocation Fund of the central government and counter-part funds from the city. The allocation for the education
sector reflects the implementation of one of the missions
in Mayor Joko Widodo’s campaign in 2005 elections in which the education sector is a priority in his leadership.
In the first period of his administration, precisely in
May 2009, Solo Technopark was inaugurated. Solo Tech-nopark is a manifestation of the Mayor Jokowi’s
deter-mination to make Solo a vocation and innovation center
for Small and Medium Enterprises (SMEs). Solo Tech -nopark is intended as a center of education and technol-ogy, research, training and incubation of new products, as well as industrial and trade center. Solo Technopark, which is an integrated area, combines aspects from indus-trial world, universities, research and training, entrepre-neurship, banking, central and local government, which
is full of technology. Besides Solo Technopark, Teach
-ing Factory Build-ing, which is used as a train-ing and
production area by integrating the activities of Vocational Schools in Solo is also built. Through this program new entrepreneurs are expected to be born who in turn will reduce unemployment in Solo. Human resource
develop-ment is also conducted through the provision of Educa -tional Assistance for Surakarta program for elementary school students up to the upper level with a budget alloca-tion of IDR18.88 billion in 2010. Other programs such as
teacher certification, implementation of the School Plus, and ISO 900:2001 certification on some schools are also performed. Education in general is aimed at character
development, etiquette and cultural values of Java. All the policies and education programs are intended to improve the quality of life of people, which also affect the compet-itiveness of the area (Document report of Solo 2010).
The third strategic direction is a productive business environment which is a measurement of how large an area can attract entrepreneurs to conduct business activities in the area by creating conditions ideal for the business
world. According to World Bank report (2010), Doing Bussiness in Indonesia in 2010, Solo was on second rank in terms of convenience in starting a business. World
Bank research team appreciates the existence of the One
Stop Service (OSS), which had integrated three kinds of permission to start a business in one place. Currently, the
OSS program, under the Integrated Services Unit (UPT),
serves 21 kinds of permissions within the turnaround time between 1-6 days.
The OSS program in Solo City Government Integrated
Services Unit began to operate shortly after Joko Widodo was designated as Mayor of Solo for the first period. A
research conducted by Subagyo (2007) found that the existence of OSS in Solo City Government Integrated
Services Unit is capable of generating turnaround time efficiency of licensing arrangements completion from an
also be supported by socio-political conditions of the local communities. Solo in a few decades ago known for its amuk Solo (Khasabu, 2010) as well as the national political barometer (Sumartono Hadinoto, 2011). The stereotype is formed due to the fact that Solo society is sociologically known as a ‘short axis’, as a picture of people who are easily provoked to do mischief, and even riots. However, according to informant Sumartono Hadinoto (2011) Solo society is currently more condu-cive and far from such stereotype. A calm and peaceful socio-economic condition of its society is one of the factors forming a conducive business climate in Solo. The change in the community’s character is a basic strategy in an effort to realize the vision and mission of the Mayor Jokowi’s 2005 campaign, i.e. the renewal of the order of civilized urban life.
A conducive business climate is also formed by good
quality local regulations. Based on the results of the study
of team KPPOD - TAF (2008), Solo in 2007 got an index of 90.7. This index shows that in categories of principle, substance, and juridical reference, the local regulations applied in Solo are of good quality. Regulation is a formal instrument of regional policy that can describe the exis-tence of either incentives or disincentives for economic activity (KPPOD - TAF, 2008). One of the regulations considered to be supportive towards productive business environment in Solo is the Regional Regulation No. 3 of 2008 on the Management of Street Vendors and Regional Regulation No. 1 of 2010 regarding the Management and Protection of Traditional Markets.
Meanwhile, in relation to the public service and the convenience in licensing, since 2007 Mayor of Sura-karta Regulation No. 2 of 2007 has been published as the second amendment of the Mayor of Surakarta Regulation No. 13 of 2005 about the Delegation of the Mayor
Author-ity to the Coordinator of the Integrated Service Unit in
Surakarta. In The amendment of Mayor Regulation, Joko Widodo’s policy commits to create productive business environment by improving public services through
dele-gating the authority of 21 licensing to the UPT of Solo.
The fourth strategic direction is the quality of infra-structure and the environment. Although mining and non-mining natural resources in Solo is very limited, geographically, Solo is located in the hinterland areas and on a fairly busy track in the central part of Java. The geographical location becomes its power in regional competitiveness. It is obvious that the economy of Solo is dominated by trading and services sector (Daily Solo Pos,
sanitation and drainage, the completion of the uninhabit-able house restoration, policing unauthorized occupancy , the development of green open spaces and waste manage-ment.
Infrastructure facilities and their availability and quality, are very important for the economic activity in Solo. That is why Solo allocates 41 billion rupiahs for its infrastructure development budget undertaken by the Public Works Department in 2011 (SKPD budget Report document 2011). Other infrastructure expenditures are constructions of markets and restructuring of uninhabit-able houses which is also one of the priorities in Mayor Joko Widodo’s 2010 campaign.
In the mean time, the relocation of people who live along the river also becomes one of the prominent programs. Jurug Simple Flats I and II were built for the
relocation of residents who live along the Bengawan Solo
River and Gajah Putih River. To manage the environ-ments of the two shabby large rivers because of commu-nity residence, the Government of Solo allocated IDR4.9
billion to its 2011 local budget (APBD). Environmental
conditions are also given attention by restricting the street vendors in public spaces. Mayor Joko Widodo also pays attention to soft infrastructures which are also developed to support regional competitiveness by developing the information technology, including those applied to the One Stop Service.
The fifth strategic direction is a financial system that measures how far the financial system, both banking
and non-banking, can facilitate community’s economic activities in Solo. According to the Head of the Regional
Legislative Council of Solo, Y.F. Soekasno, the economic
activity and the circulation of money in Solo is the highest
in Central Java. This was also confirmed by the Deputy Mayor F.X. Hadi Rudyatmo saying that the daytime population of Solo reaches 2 million, increasing nearly 3
times as many as the official population (Java Post Daily,
2010). According to Sumartono Hadinoto (2011), it is almost certain that national banks that would open their branches in Central Java are going to start them in Solo, not in Semarang, the capital of the province. It shows that
Solo is considered to be more financially attractive than
the other cities in Central Java.
The study conducted by PPSK BI - LP3E UNPAD FE
(2008) shows that based on the four variables of
party funds (rank 16), and total bank credit (rank 50). Thus, nationally, for indicators of banking and financial institutions, Solo is in the 11th rank or the highest among
other indicators.
Mayor Joko Widodo’s interaction with the banking circles is quite well, for example, he is involved in the
opening of a new bank. At the Grand Opening of Bank
Permata in 2010, Mayor Joko Widodo described some of the Government of Solo’s policies and work programs
and encourages Bank Permata to take part in finding a breakthrough by financing small and medium enterprises
which are considered to be not bankable yet.
In early 2010, BNI provided the People’s Enterprise Credit (KUR) disbursements as much as IDR35 billion
for the development of small and medium enterprises
(SMEs) in Solo. This is a significant increase over the previous year which was only IDR12 billion. BNI noted that the collectability of KUR in 2010 reached 99.21%, it
means only 0.79% of total loans are not smooth.
The sixth strategic direction is innovation. Within the framework of regional competitiveness, the innovation performed by the Mayor Joko Widodo, i.e. the policy that regulates street vendors arrangement, has begun since 2006. As we have mentioned earlier, the regional innova-tion in Solo is proclaimed through product management, branding management and customer management.
Innovation in product management performed by the Mayor Joko Widodo is the relocation of street vendors
from the Momumen Juang Banjarsari area to Klitikan
Notoharjo Market done humanely without violence. Inno-vation in the communication of this policy makes Solo a pilot project of spatial arrangement for developing countries in Southeast Asia. Another major project is the renovation of the traditional market which is known to be stale and shabby. During 2005-2010, the Government managed to renovate 12 of 37 existing traditional markets in Solo.
Innovation in the branding management is made by
determining the slogan “Spirit of Java” and “The Future
Solo is the Past Solo” as an icon of cultural development and historical heritage. Javanese culture is re-enabled through the use of Javanese language in the Municipal Government every Friday, the use of Java script on road
signs and places, and themes that characterize Batik Trans Solo (BST). Solo Batik Carnival (SBC) is held annually
in Solo, and even organized in international activities like Pasar Malam Indonesia (PMI) in Den Haag, Netherlands as one of the performers in 2010 (Java Post Daily, 2010).
This innovation can also be made through researches and collaborations with local universities. Mayor Joko Widodo builds Technopark as a business and young inde-pendent entrepreneur incubators. In addition, through the Vocational School (SMK) the invention of product and
Regional
business innovations in the future is expected to emerge. Although it is not yet massively produced, one of the results of the innovation and creativity among vocational
schools in Solo is Esemka car design. As a leader, Mayor
Joko Widodo gave an appreciation to the work of the
vocational students with the intention to be the first user
if the car had received permission from the Directorate General of Land Transportation, Ministry of Transporta-tion (Suara Merdeka Daily, 2010). Hopefully, the innova-tions and inveninnova-tions for the sake of economic develop-ment and prosperity will be more various in Solo with the establishment of Technopark.
The seventh strategic direction is the internationaliza-tion and accessibility of global resources. The openness of Solo towards the external environment, both national and international starts with the addition of both
domes-tic and international flight routes of local airport. Mean -while, in the second period of his administration, Mayor Joko Widodo prioritized the non-physical and mental development. The two prior things are the enhancement of cultural values and the people’s economic devel-opment (Java Post Daily, 2010). Mayor Joko Widodo proposed Solo as members of the Organization of World Heritage Cities, and was accepted in 2006. It may support the development of Solo’s cultural values to be able to compete with other regions. This is included in parts of branding management conducted by Mayor Joko Widodo.
This strategy continues with the success of Solo to host the international conferences.
In 2007, Solo hosted the World Music Festival (FMD)
which was held at the Benteng Vastenburg complex, a
site of heritage threatened to be evicted for business and shopping centers. FMD in 2008 was held in the Istana Mangkunegaran complex. Meanwhile, another activity related to the seventh strategic direction is International Performing Art (SIPA), which took place on July 16 to 18, 2010. This international event is also considered support-ing the existence of Solo as a City of Culture. In addi-tion, Solo also frequently hosts international conferences;
one of them was the Asia Pacific Ministers Conference on Housing and Urban Developement (AMPCHUD) on
June 22, 2010.
For the attractiveness of domestic labor, Solo is a place to earn a living for people from outside Solo. In the daytime, the population of Solo amounted to 2-3 times as large as the one at night (Sumarton, 2011). This condition indicates that Solo is opened in terms of both economy and accessibility to the community outside Solo. This is the impact of traditional markets revitalizing policy and street vendors’ arrangements implemented by Mayor Joko Widodo since 2006.
Stages in compiling the hierarchy of goals, strategic directions and potential options with the step by step method of Ackerman, et. al. (1992) produce the
cogni-Social Welfare
Education
Quality
+ +
Figure 8. Perceptions on the Causes of Regional Competitiveness
Regional Competitiveness
Social Welfare Education
Innovation Entrepreneurship
Unemployment
+
+
-+ +
-Human Resources and Employment Quality
-+
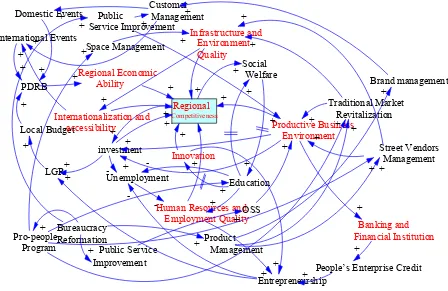
tive map of Mayor Joko Widodo’s policies on regional competitiveness. This cognitive map is further connected
by arrows and given a “+” (increase) and ‘-’ which means
decrease. Thus, Mayor Joko Widodo’s causal map related to the policy on regional competitiveness in Solo is formed. Figure 7 is a causal map of Mayor Joko Widodo’s policies on regional competitiveness.
Mayor Joko Widodo focuses on the efforts to support the progress and the internal growth of Solo. During the 2010-2015 campaign, pro-people development programs
become a priority in the next five years of administra -tion, which is a continuation of the program during the previous administration. These programs form a produc-tive business environment and improve the quality of the infrastructure and the environment. Productive business environment factor as well as the infrastructural and envi-ronmental factor is perceived to be the forming factor of regional competitiveness. Improvements in public welfare are also a priority in the second period of Mayor Joko
Widodo’s administration. It is an affirmation of his belief
that the goal of the regional competitiveness is increasing the welfare of the society. Mayor Joko Widodo’s percep-tion in seeing the ‘Causes’ factor of regional competitive-ness can be seen in Figure 8.
Feedback in the system dynamics is an important factor to analyze the object of study. There are two types of feedback loops, namely the positive feedback loops or
reinforcement and the negative feedback loops or balanc-ing. Positive feedback loops urge the system to continue to change so it tends to make the system unstable. While negative feedback loops tend to reduce the changes, this condition tends to make system more stable.
Figure 9 is the feedback loops that form the causal maps of Joko Widodo’s policies on the regional competitiveness in Solo. Although it is composed of negative and posi-tive feedback loops, basically the main formed feedback is negative. Negative feedback loops formed in Joko Widodo’s causal maps show that the main strategy in formulating the regional competitiveness policy in Solo is internal. This fact is in line with the vision and mission issued by Joko Widodo during the campaign. The empha-sis of the development policy is more focused on inter-nal factors, one of which is the policy in the education sector. The policy on the education sector is intended to reduce unemployment and improve the quality of human resources and labor. The construction of Solo Tech-nopark, educational assistance programs administered on the elementary through high school students, plus high school programs and the strengthening of vocational school as the eminent program are also an indication of the emphasis on internal factors to generate the competi-tiveness of Solo. Mayor Jokowi hopes that the vocational development and Solo Technopark can improve the qual-ity of human resources and labor in the future, and
simul-Regional Comp.
designed to create the innovation, young entrepreneurs and a business incubators, which can strengthen the over-all regional competitiveness. The entrepreneurship then also affects the reduction of unemployment thus improv-ing the quality of human resources and labor.
The policy that formulates the regional competi-tiveness with balancing characteristic as Joko Widodo did has its own record. This is due to the sustainability of this policy type that in the future gets a challenge and cannot be guaranteed to continue because there are fewer stakeholders around Joko Widodo who are willing to adopt the policies that he has been imple-menting. It can actually be understood since the policy innovations that come from a regional head is often not continued in the next period of regional administration.
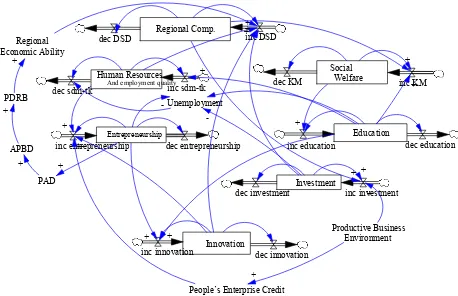
Causal Map Conversion to System Dynamics Model through the ‘NUMBER’ method
From Mayor Joko Widodo’s policy causal maps on regional competitiveness, six feedback loops are
identi-fied, namely the quality of human resources and labor,
social welfare, investment, innovation, education, and entrepreneurship. The overall variable is converted into
stocks (also called level). While the flow (also called rate)
is formed by the elements outside of it that form feed-back loops. Stock is an accumulated element and can
be depleted over the course of time, while the flow is an
element that affects the existence of stock.
Through the NUMBER methods, Mayor Joko Widodo’s
policy on regional competitiveness can be constructed as a system dynamics model as shown in Figure 10. Causal relationship between one variable of policy and a variable in policies is related to the regional competitiveness that becomes more apparent in the system dynamics model.
Based on simulations performed with the help of
software, the results of a wide range of policies in supporting the improvement of regional competi-tiveness in Solo will be visible within a period of 65 months. If the beginning of Mayor Joko Widodo leader-ship in July 2005 is set as a starting point of the calcu-lation, then the results of his regional competitive-ness policies in Solo will be visible in December 2010.
CONCLUSION
The research on regional administration in direct regional head election systems is very important to obtain a description of various ideal forms and styles of
study presents an overview of the visionary leadership of a regional head that can be used as a role model of the regional heads throughout Indonesia. Second, the empha-sis on the various policies and pro-people programs, mostly internal orientation in achieving regional competi-tiveness, can also be used as a reference to the regional heads competitiveness in developing their respective regional competitiveness. Of course, the regional heads may consider the objective conditions of their respective regions.
This study also provides important experience in the application systems thinking paradigms and
methodolo-gies in the field of administration and public policy. Simi -lar administration studies can be conducted for further advancement on various cases of other policies and in other various areas to enrich the study on leadership and public service.
REFERENCES
Ackermann, Frank, et. al. (April 1992). Getting Started with Cognitive Mapping. 7th Young OR Conference,
University of Warwick, 13-15 April 1992.
Banerjee, Biswajit; Jarmuzek, Mariusz, 2010. Economic
Growth and Regional Disparities in The Slovak Republic. Comparative Economic Studies, Vol. 52 No. 3, page 379-403.
Berg, Riekke dan Nirmala Roa (ed) (2005), Transforming Local Political Leadership. New York: Pelgrave McMillan
Checkland, Peter and Scholes, Jim (1990) Soft Systems Methodology in Action, include a 30-year retrospective, John Wiley and Sons, Ltd, Chichester
Druckenmiller, Douglas; Acar, William, 2009. An
Agent-Based Collaborative Approach to Graphing Causal
Maps for Situation Formulation. Journal of the Association for Information Systems, Vol. 10 No. 3, page 221-251.
Eden, Colin, dan Fran Ackermann, (2004). Cognitive Mapping Expert Views for Policy Analysis in the
Public Sector. Europen Journal of Operational Reseacrh (152), h. 615-630.
Fratesi, Ugo, 2010. Regional Innovation and
Competitiveness in A Dynamic Representation. Journal of Evolutionary Economics, Vol 20 No. 4 , page 515-552
across the European Regions (ed rev). Regional Studies Association’s Productivity Forum Seminar, London, Januari 2004.
Huseini, Martani (25 April 2011). Memperkuat Daya Saing Daerah. Seminar Local Governance Watch,
Kampus FISIP Universitas Indonesia, Depok.
Kim, Dong-Hwan (November 2000). A Simulation Method of Cognitive Maps. 1st International Conference on System Thinking in Management,
Deakin University, Australia.
________, (2005) . Cognitive Maps of Policy Makers on Financial Crises of South Korea and Malaysia: A Comparative Study. Internasional Review of Public Administration. Vol. 09, No.2, h.31-38.
_______. A Method for Direct Conversion of Causal Maps into SD Models: Abstrack Simulation with NUMBER. Chung –Ang University, School of Public Affair.
Maani, Kambiz E. and Cavana, Robert Y (2007), Systems Thinking, Systems Dynamics: Managing Change and Complexity, New Zealand: Pearson Education
Martin, Ronald L. (2003). A Study in the Factors of Regionals Competitivenesss (A Final Report for The European Commision DG Regional Policy).
Cambridge: University of Cambridge.
Prasojo, Eko, dkk (2006). Desentralisasi dan Pemerintahan Daerah: Antara Model Demokrasi
Lokal dan Efisiensi Struktural. Depok: Departemen
Ilmu Administrasi FISIP UI.
Svara, James H., et. al., (1994). Facilitative Leadership in Local Government: Lessons from Succesful Mayor and Chairperson. San Francisco: Jossey-Bass Publishers.
World Bank (2010). Doing Business in Indonesia 2010.
Washington: World Bank.
Laporan Keterangan Pertanggungjawaban (LKPJ) Walikota Surakarta 2010
Lundberg, Heléne, 2010. Strategic Networks for Increased Regional Competitiveness: Two Swedish Cases. Competitiveness Review, Vol. 20 No.2, page 152-165. O’Malley, Denis, 2008. Transactions Sector, Innovation
And Competitiveness. Australasian Journal of Regional Studies, Vol 14 No. 3, page 335-356.
Osborne, David and Ted Geabler (1992). Reinventing Government. NJ: Addison-Wesley
Prasojo, Eko. (24 Januari 2011) . Republik Tersandera Korupsi. Koran Kompas.
Khasabu, R. Suryo (2010). Kampanye Politik Calon Kepala Daerah pada Pelaksanaan Pemilihan Umum Kepala Daerah (Studi Analisis Deskriptif terhadap Kampanye Politik Pasangan Calon Ir. H. Joko Widodo – F.X.. Hadi Rudyatmo pada Pelaksanaan Pemilukada Kota Surakarta Tahun 2010). Surakarta: Fakultas Ilmu
Sosial dan Politik Universitas Surakarta (skripsi tidak
diterbitkan).
Senge, Peter M. (1990) The Fifth Discipline: The Art and Practice of The Learning Organization. New York: Currency Doubleday.
PPSK Bank Indonesia-LP3E Unpad (2008). Profil dan
Pemetaan Daya Saing Ekonomi Daerah Kabupaten/ Kota di Indonesia. Jakarta: Rajawali Pers.
Sudibyo, D. Priyo (2007). Reformasi Pelayanan Publik