Perceptions of Online Taxi Utilization In
Bandar Lampung Using UTAUT Model
(Unified Theory Of Acceptance And Use Of
Technology)
Tristiyanto
1, Yushar Fiska
2, Ardiansyah
31,2,3 Computer Science Department, University of Lampung, Bandar Lampung, Indonesia 1[email protected], 2[email protected],
Abstract
The presence of online transport applications that allow transportation services can be booked and paid online has been rife in Indonesia, especially major cities since 2015. One of the transportation that can be ordered online is a taxi. Two major operator s are Go-Jek and Grab. This study aims to determine the factors that affect the acceptance and use of online taxi in Bandar Lampung based on UTAUT and UTAUT2 models. The object of this research is customer and driver from Go-Car and GrabCar. The result of the research indicates that at research on customers using UTAUT2, almost all variables affect the acceptance and use of an online taxi, except price value that does not affect the acceptance and use of online taxi Go-Car. Furthermore, the research of the driver using UTAUT, the variable of performance expectancy, effort expectancy, and social influence have a positive effect to acceptance and use of Go-Car online taxi application, while the facilitating condition variable has no effect. On the other side, only social influence variables that affect the use and acceptance of the GrabCar, while the other three variables have no effect. So in general, Although both companies are rival, they have their own customer segmentation.
Keywords:
UTAUT, UTAUT2, acceptance, go-car, grabcar, online taxi1 Introduction
Along with the advance of technology and science, it becomes easier to obtain public transportation. In its current development, there is transportation that can be ordered and paid online. Happening and rifing in Indonesia, the phenomenon of online public transport starts since 2015 is, especially in big cities one of which is an online taxi. Online Taxi is now also have started operating in the region of Bandar Lampung. Timbel launched by PT. Trans Indonesia Mobile Lampung is said to be the first online transport service application in Lampung, however the online taxi phenomenon was gained attention in Bandar Lampung in the early of 2017 since the entry of several online transport service providers such as Gojek, Grab and Uber.
UTAUT as the approach used in this study is a combination of eight models that have been successfully developed previously [1]. This study will discuss on the influence of the variables contained in UTAUT2, that performance expectancy, effort expectancy, social influence, facilitating condition, hedonic motivation, price value, and the habit of the behavioral intention to use based on the perception of the customer. Then the UTAUT model will determine what factors affect the acceptance and use of online taxi based on driver perceptions. The variables contained in UTAUT, among others: performance expectancy, effort expectancy, social influence, and facilitating condition.
1.1 Unified Theory of Acceptance and Use of Technology (UTAUT)
Model
Venkatesh, et al. [1] developed the UTAUT model by combining eight other technology acceptance models: TRA ( Theory of Reasoned Action) , TAM ( Technology Acceptance Model) , TPB ( Theory of Planned Behavior ), C-TAM- TPB ( Combined TAM and TPB ), MM ( Motivational Model ), SCT ( Social Cognitive Theory ), IDT ( Innovation Diffusion Theory ) and MPCU ( Model of PC Utilization ) as a technological acceptance model [2]. The UTAUT mainly use to assist the organization to cognize how users will respond to the new technologies introduction [3].
The UTAUT model have been widely applied and have mixed findings [4]. Some research topics have been conducted, such as Internet Banking [5], E-Government [6], [7], Mobile Commerce [8], Academic Information System [4], Online Transportation Application [9], Online Shopping System [10], and so forth.
Figure 1. UTAUT Model [1]
Four significant variables become direct contributing factor to the acceptable behavior and use of technology In UTAUT model namely:
1. Performance Expectancy
Performance Expectancy (PE) the beliefs extent of an individu that a system will help in gaining performance.
Effort Expectanc
y
Social Influence
Facilitating Conditions
Behavioral
Intention BehaviorUse
Gender Age Experience Voluntariness of Use Performan
ce
2. Effort Expectancy
Effort Expectancy (EE) is the level simplicity in using a system. More simple, less effort. More complex, high effort.
3. Social Influence
Social Influence (SI) is the extent of an individual perception on his/her own importance may trigger him to use the new system.
4. Facilitating Condition
Facilitating Condition (FC) is defined as the degree to which a person believes that organizational and technical infrastructure is available to support the system.
In addition to these four variables, there are four other mediators that serve as mediators that reinforce the influence of the four main variables on the acceptance and use of technology. The mediator fourth is Gender, Age, Experience, and Voluntariness of use. Figure 1 shows the linkage of UTAUT variables and mediators.
Figure 2. UTAUT2 Model [11]
Then in [11], Venkatesh et al developed the UTAUT model into UTAUT2 to identify the behavior and acceptance of Mobile Internet technology in Hong Kong and found that Hedonic Motivation, Price Value, and Habit have a positive and significant influence. Hedonic Motivation (HM) is a pleasure motivation derived from the use of a system or
Performance Expectancy
Effort Expectancy
Social Influence
Facilitating Conditions
Behavioral
Intention Use Behavior
Age Gender Experience
Hedonic Motivation
Price Value
technology [11], [12]. Price Value (PV) is a trade-off between fees paid and benefits derived from the use of technology [11],[12]. Habit (HT) describes how a person uses a system in his daily life [11],[12]. This model describes the acceptance of a technology based on the user side better with the percentage of improvement from 56% to 74% for acceptance in the form of behavioral intentions of use and improvement on the acceptance of use behavior with a percentage from 40% to 52% [11]. Unlike the contextual UTAUT1 is organizational, UTAUT2 is able to explain the acceptance of technology whose context is consumer use [11]. Figure 2 is a model of UTAUT2 developed by [11].
1.2 Spearman’s Rank
Spearman rank correlation is a nonparametric statistic used to describe the strength of a relationship between two variables X and Y [13]. Spearman's Rank is better able to answer questions on research with ordinal data than with more conventional parametric statistics [13]. To see the value of the Spearman rank, the following formula is used:
N
rs = Spearman rank correlation coefficient
N = Number of respondents
di 2
= Difference between rank X and rank Y squared.
As for if there are twin numbers in the variable X or Y, then used the formula as follows:
rs = Spearman rank correlation coefficient
X = Number of equal rank on variable X
Y = Number of equal rank on variable Y
T = The number of values is equal
di 2
= Difference between rank X and rank Y squared.
Furthermore, to test the level of significance of Spearman rank value, the comparison between tvalue with ttable with criteria if tvalue > ttable, then H0 rejected and if tvalue < ttable, then H0 accepted. Here is a formula to find the value of tvalue:
2 1
2
rs N rs t
(6)
Information:
t = level of significance
rs = Spearman rank correlation value
N = Number of respondents
2 Data and Methods
This study uses a model of the theoretical framework of UTAUT and UTAUT2 in an online taxi environment. UTAUT2 is used to identify the use of online taxi receipt from the customer, while UTAUT is used to identify the use and acceptance of the online taxi receipt from the driver. The UTAUT2 model is not used in the study of drivers because the hedonic motivation, price value, and habit variables are less suitable to identify acceptance and use of online taxi applications by drivers. A Model UTAUT used in this study did not identify the existing moderators in the UTAUT model due to the condition of the amount of data by gender and age that the number is far adrift. The UTAUT research model of the driver can be seen in Figure 3.
Performance Expectancy
(PE)
Effort Expectancy
(EE)
Social Influence (SI)
Facilitating Conditions
(FC)
Behavioral Intention to Use
Figure 3.Driver Research Model
From Figure 3 above, it can be seen that this study aims to find out whether there is a positive relationship between performance expectancy (PE) variable, effort expectancy (EE), social influence (SI) variable, and facilitating condition (FC) variable with the behavioral intention to use (BI) variable.
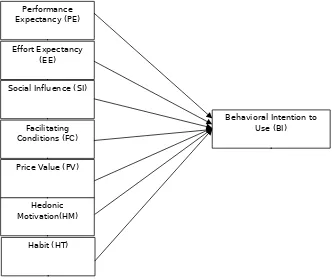
Then the UTAUT2 model used in this study did not identify the moderators present in UTAUT2. This is because the demographic condition of the respondents from the data obtained by the researchers is not possible to identify the moderators. The research model on the customer can be seen in Figure 4.
Figure 4. Model Research on theCustomer
From Figure 4 above, it can be seen that this study aims to determine whether there is a positive relationship between the variables of performance expectancy (PE), effort expectancy (EE), social influence (SI), facilitating condition (FC), price value (PV), hedonic motivation (HM), habit (HT) to behavioral intention to use (BI) variable .
We use explanatory research to find explaination of why and how the relationship between two aspects of a situation or phenomena [14]. Because the main reason for explanatory research is to know the cause and effect relationship of a situation, it is hoped that this research can explain the relationship and influence of the variables.
Then the method used in this research is survey method. A survey is a common tool for assessing public opinion, perceptions, attitudes, and behavior for analysis in many social disciplines [15]. In this case, the survey is done by making question list which is visualized in the form of questionnaires that will be filled by respondents. To conduct
Performance Expectancy (PE)
Effort Expectancy (EE)
Social Influence (SI)
Facilitating Conditions (FC)
Behavioral Intention to Use (BI)
Hedonic Motivation(HM)
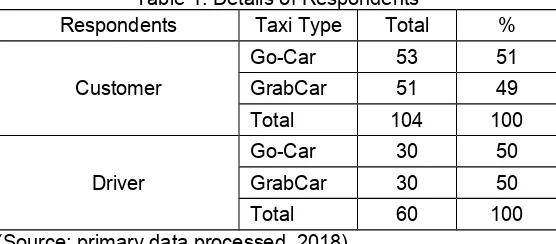
this research, the population criteria taken by the authors are the customers and drivers of Go-Car and GrabCar Bandar Lampung. Based on the results of data collection through questionnaires distributed to respondents who are customers and also drivers Go-Car and GrabCar operating in Bandar Lampung, then obtained 164 data, with details of 104 data from users and 60 data from the driver. For more weld can be seen in Table 1 following.
Table 1. Details of Respondents
Respondents Taxi Type Total %
Go-Car 53 51
Customer GrabCar 51 49 Total 104 100
Go-Car 30 50
Driver GrabCar 30 50
Total 60 100
(Source: primary data processed, 2018)
From the table 1 can be seen that as much as 51% of user data is a customer of Go-Car transport services and 49% comes from GrabGo-Car customers. As for the driver data, as many as 30 people are drivers Go-Car and 30 others are drivers GrabCar.
4.1
Research Hypothesis
Based on the research model, hypothesis is proposed about the relationship between independent constructs consisting of PE (Performance Expectancy) construct, EE (Effort Expectancy) construct, SI (Social Influence) construct, FC (Facilitating Condition) construct, HM (Hedonic Motivation), PV (Price Value), and HT (Habit) to the dependent construct of BI construct (Behavioral Intention to Use). The hypothesis proposed in this study can be seen in Table 2 and Table 3.
Table 2. Research Hypothesis on Drivers
Hypothesis
H1 Performance Expectancy (PE) has a positive influence on interest utilizationand application usage online taxi (Behavioral Intention to Use)
H2 Effort Expectancy (EE) has a positive influence on interest utilization andapplication usage online taxi (Behavioral Intention to Use)
H3 Social Influence (SI) has a positive influence on the interest of utilizationand use of online taxi applications (Behavioral Intention to Use).
H4 Facilitating Conditions (FC) has a positive influence on the behavior of theutilization and application usage online taxi (Behavioral Intention to Use).
Table 3. Research Hypothesis on Customer
Hypothesis
H1 Performance Expectancy (PE) has a positive influence on interest utilizationand application usage online taxi (Behavioral Intention to Use)
H2 Effort Expectancy (EE) has a positive influence on interest utilization andapplication usage online taxi (Behavioral Intention to Use)
H3 Social Influence (SI) has a positive influence on the interest of utilizationand use of online taxi applications (Behavioral Intention to Use).
H5 Hedonic Motivation (HM) has a positive effect on behavior and the use oftaxi online utilization (Behavioral Intention to Use).
H6 Price Value (PV) has a positive effect on behavior and the use of taxi onlineutilization (Behavioral Intention to Use).
H7 Habit (HT) has a positive influence on the behavior of utilization and use ofonline taxi ( Behavioral Intention to Use ).
3 Results and Discussion.
3.1 Validity Test
Validity is often defined as a measure of the accuracy of an instrument able to measure the object under investigation. The test technique used is product moment correlation technique. The ordinal score of each question item tested for its validity is correlated with the overall ordinal score of the item. A questionnaire is said to be valid if the question on the questionnaire is able to reveal something to be measured by the questionnaire. The significance test is done by comparing the value of rvalue with rtable. By criterion, if rvalue is bigger than rtable, then an item of question is valid, while if rvalue smaller than rtable, the question of an item is invalid.
In testing of the customer, the number of samples used (n) = 30 and alpha = 0.05 was obtained rtable = 0.361. The question or indicator is said to be valid if the value of rvalue is greater than the value of rtable. The results of validity testing using PASW Statistics 18 program on the instrument of this study indicates that all the questions from the research variables, namely performance expectancy, effort expectancy, social influence, facilitating condition, hedonic motivation, price value, habit, and behavioral intention show the correlation value greater than rtable. Therefore, it can be said that the whole item of question or statement to the customer is valid and feasible to be used.
Then on the research of the driver, the number of samples used for this validity test as many as 60 people with the alpha value 0.05, so that the value of rtable = 0.254. Based on test results using the program PASW Statistics 18, shows that all the questions of the study variables performance expectancy, effort expectancy, social influence, facilitating condition, and behavioral intention has a value of rvalue is greater than the value of rtable, so it can be said that the research instrument valid and worth using.
3.2 Reliability Test
In a general sense, reliability is defined as consisting of measurement [16]. In this study, we used Alpha Cronbach Coefficient using PASW Statistics 18 application to test the reliability of each item. A variable is said to be reliable if it gives Cronbach Alpha value > 0,70 [17].
way, only used three indicator variable facilitating condition to be analyzed to know the relation of the variable to acceptance and use of online taxi.
3.3 Hypothesis Testing
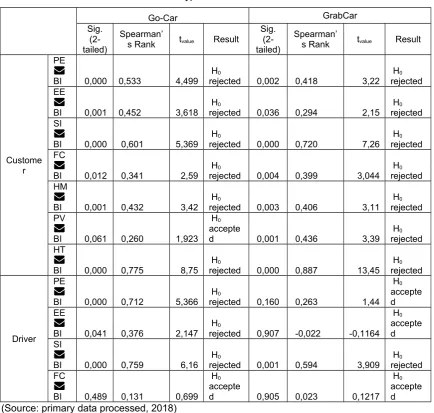
Data analysis technique used in this research is by Spearman's rank correlation test to test the relationship of two variables studied. The determination of a hypothesis is accepted or cannot be seen from the sig value (2-tailed) and also to find the value of Spearman's rank correlation, then searched the tvalue, and then compared with the ttable value. The results of this hypothesis testing can be seen in Table 4.
Table 4. Hypothesis Test Results
rejected 0,002 0,418 3,22
H0
rejected 0,036 0,294 2,15
H0
rejected 0,003 0,406 3,11
H0
rejected 0,160 0,263 1,44
Go-Car customers do not place importance on pricing or cost, whereas GrabCar customers are concerned with or take into account the costs to be paid.
Then from the research of the driver using UTAUT method, it can be seen in Table 5 that in the Go-Car driver, the performance variable expectancy (PE) affect the acceptance and use of an online taxi, while the GrabCar driver has no effect. This means that online taxi apps are useful for Go-Car drivers and to be one of the factors that affect the usage of this application. Then the variable effort expectancy (EE), H0 in the study of Go-Car was rejected, but in GrabCar H0 accepted. Therefore, it can be said that according to the Go-Car driver Go- Jek online taxi application is easy to use for them, whereas according to GrabCar driver GrabCar online application is quite complicated. Then for the variable social influence (SI), H0 of both the research object, namely driver Go-Car and driver GrabCar equally rejected, so it can be said that social influence is a factor that encourages them to use the application and be driver online taxi while facilitating condition (FC) does not affect the Go-Car driver or GrabCar to use the application and become an online taxi driver.
4 Conclusions
Based on the results of research and discussion, it can be concluded as follows:
1. Based on the results of hypothesis testing on research on the customer, it is known that the variable performance expectancy (PE), effort expectancy (EE), social influence (SI), facilitating condition (FC), hedonic motivation (HM), and habit (HT) effect on behavioral intention to use (BI), while the variable price value (PV) only affects the customer GrabCar, while the customer Go-Car has no effect. 2. Based on the results of hypothesis testing on the research on the driver, it is
known that the variable performance expectancy (PE), effort expectancy (EE), and social influence (SI) effect on the use of online taxi Go-Car application, but the facilitating condition (FC) variable has no effect. While the GrabCar driver is known only variable social influence (SI) which affects the use of online taxi application GrabCar, while the other three variables, performance expectancy (PE), effort expectancy (EE), and facilitating condition (FC) have no effect.
References
[1] Venkatesh, V., et. Al., <<User Acceptance of Information Technology: Toward a Unified Views>>, MIS Quarterly, Vol. 27 No. 3, 2003.
[2] AlQeisi, Koloud, Al-Abdallah, Ghaith, <<Internet Banking Adoption in Jordan: A Behavioral Approach>> International Journal of Marketing Studies, Vol. 5, No. 6, 2013, ISSN 1918-719X, E-ISSN 1918-7203, Published by Canadian Center of Science and Education.
[3] Wang HI, Yang HL, <<The role of personality traits in UTAUT model under online stocking>>, Contemporary Management Research, 1(1):69-82, 2005.
[5] Abu Shanab, Pearson, <<Internet Banking in Jordan: The unified theory of acceptance and use of technology (UTAUT) Perspective>> Journal of Systems and Information Technology, Vol. 9 No. 1, 2007.
[6] Alshehri, Mohammed., et. Al, 2012. <<The Effects of Website Quality on Adoption of E-Government Service: An Empirical Study Applying UTAUT Model Using SEM>> 23rd Australian Conference on Information Systems, 2012.
[7] S. AlAwadhi, A. Morris, <<The Use of the UTAUT Model in the Adoption of E-Government Services in Kuwait>>, Proceedings of the 41st Hawaii International Conference on System Sciences, 2008.
[8] A. Alkhunaizan, S. Love, <<What drives mobile commerce? An empirical evaluation of the revised UTAUT model>>, International Journal of Management and Marketing Academy, Vol. 2, No. 1, 2012.
[9] Isradila, Andarwati, <<Analysis of User Acceptance Towards Online Transportation Technology Using UTAUT2 Model: A Case Study in Uber, Grab, and Go-Jek in Indonesia>>, International Journal of Science and Research (IJSR), ISSN (Online): 2319-7064, 2015.
[10] R. Yeganegi, N.F. Elias, <<Measuring the User Acceptence on Online Hypermarket Shopping System Based on UTAUT Model>>, International Journal of Management and Applied Science, ISSN: 2394-7926 Vol-2, Issue-2, 2016. [11] Venkatesh, V., et. al.,<<Consumer Acceptance and Use of Information
Technology: Extending the Unified Theory of Acceptance and Use of Technology>>, MIS Quarterly, Vol. 36 No. 1, 2012.
[12] Gayatrie, Mega S., et. al., <<Analisis Penerimaan Os Windows 10 dengan Unified Theory of Acceptance and Use of Technology (UTAUT2)>>, Jurnal Pengembangan Teknologi Informasi dan Ilmu Komputer, Vol. 1 No.6., 2017. [13] J. Ruscio, <<Constructing Confidence Intervals for Spearman’s Rank Correlation
with Ordinal Data: A Simulation Study Comparing Analytic and Bootstrap Methods>>, Journal of Modern Applied Statistical Methods: Vol. 7 : Iss. 2 , Article 7, 2008.
[14] R. Kumar, 2011 <<Research Methodology: a step-by-step guide for beginners>>, 3rd edition, Sage Publications Inc, 2011.
[15] Johnson, Timothy P., et. al. <<Survey Methods in Public Administration Research: A Content Analysis of Journal Publications>> Prepared for the 10th National Public Management Research Conference, Ohio State University, Columbus, OH, October 1-3, 2009.
[16] R. Rosaroso, <<Using Reliability Measures In Test Validation>> European Scientific Journal, vol.11, No.18, ISSN: 1857 – 7881 (Print) e - ISSN 1857- 7431, June, 2015.
![Figure 1. UTAUT Model [1]](https://thumb-ap.123doks.com/thumbv2/123dok/3993842.1937262/2.595.130.501.404.665/figure-utaut-model.webp)
![Figure 2. UTAUT2 Model [11]](https://thumb-ap.123doks.com/thumbv2/123dok/3993842.1937262/3.595.131.503.271.687/figure-utaut-model.webp)