CHAPTER IV
RESULT OF THE STUDY AND DISCUSSION
A. Description of the Data
This section consists of the measurement of central tendency (Mean, median and mode of each group score), the measurement of variability (standard deviation and standard error of the mean), some figures and tables of each group score and the discussion of the study.
1. The Result of Pre Test Score of Class Experiment and Class Control The writer gave pre test to the experiment class and control class. The first, pre test was conducted to the experiment class. It was conducted on Saturday, August 15th, 2015, at 07.50-09.10 am: in the class VIII.B with the number of student were 25 students. Than for pre test was conducted to control class. It was conducted on Tuesday, August 18th, 2015, at 10.10-11.50 am; in the class VIII.C with the number of student were 26 students.
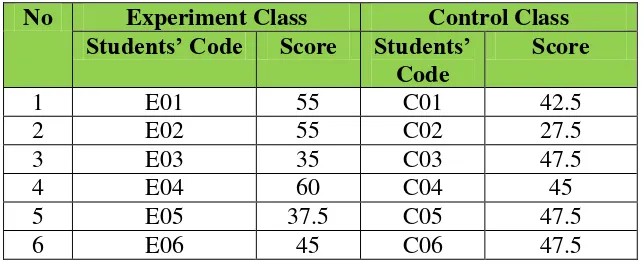
Table 4.1 the Description of Pre Test Score of
Experimental Class and Control Class
No Experiment Class Control Class
Students’ Code Score Students’
Code
Score
1 E01 55 C01 42.5
2 E02 55 C02 27.5
3 E03 35 C03 47.5
4 E04 60 C04 45
5 E05 37.5 C05 47.5
6 E06 45 C06 47.5
7 E07 50 C07 30
8 E08 55 C08 32.5
9 E09 42.5 C09 51.5
10 E10 57.5 C10 42.5
11 E11 65 C11 42.5
12 E12 52.5 C12 30
13 E13 68.5 C13 35
14 E14 45 C14 37.5
15 E15 20 C15 50
16 E16 62.5 C16 27.5
17 E17 25 C17 40
18 E18 52.5 C18 50
19 E19 45 C19 47.5
20 E20 52.5 C20 37.5
21 E21 32.5 C21 30
22 E22 40 C22 -
23 E23 67.5 C23 -
24 E24 35 C24 -
25 E25 47.5 C25 -
26 - - C26 -
Highest Score 68.5 51.5
Lowest Score 20 27.5
Mean 48.24 39.28
Standard Deviation 22.695 7.886
Standard Error of Mean 4.633 1.762
Based on the result of research in class VIIIB as experiment class before was taught
by Authentic materials as media, the highest pre test score was 68.5 and the lowest pre test
score was 20, the mean of experiment class was 48.24 and the standard deviation of
experiment class was 22.695.
In addition, the result of research in class VIIIC as control class before was taught by
of control class was 39.28 and the standard deviation of control class was 7.886. (See detail
in appendix 2.1).
2. The Result of Post-Test Score of Experiment Class and Control Class
The writer gave post-test to the experiment class and control class. The first, post-test was conducted to the experiment class. It was conducted on Saturday, August, 29st, 2015, at 07.50-09.10 am: in the class VIII.B with the number of student were 25 students. Than for post-test was conducted to control class. It was conducted on Tuesday, September 3th, 2015, at 10.10-11.50 am; in the class VIIIC with the number of student were 26 students.
Table 4.2 The Description of Post Test Score of
Experimental Class and Control Class
No Experiment Class Control Class
Students’
Code
Score Students’ Code
Score
1 E01 55 C01 55
2 E02 47.5 C02 57.5
3 E03 80 C03 74.5
4 E04 70 C04 52.5
5 E05 70 C05 62.5
6 E06 80 C06 70
7 E07 70 C07 57.5
8 E08 72.5 C08 65
9 E09 87.5 C09 65
10 E10 72.5 C10 65
11 E11 60 C11 70
12 E12 77.5 C12 62.5
13 E13 60 C13 57.5
15 E15 62.5 C15 65
16 E16 62.5 C16 55
17 E17 87,5 C17 67.5
18 E18 72.5 C18 57.5
19 E19 62.5 C19 67.5
20 E20 65 C20 62.5
21 E21 72.5 C21 62.5
22 E22 77.5 C22 50
23 E23 70 C23 67.5
24 E24 65 C24 45
25 E25 57.5 C25 52.5
26 - - C26 70
Highest Score 87,5 74.5
Lowest Score 47.5 45
Mean 68.8 60.69
Standard Deviation 9.251 6.965
Standard Error of Mean
1.888 1.393
Based on the result of research in class VIII.B as experiment class after was taught
by using Authentic materials as media, the highest post- test score was 87.5 and the lowest
post- test score was 47.5, the mean of experiment class was 68.8, the standard deviation of
experiment class was 9.251 and the standard error of post-test experiment class was 1.888.
In addition, the result of research in class VIII.C as control class after was taught by
using textbook, the highest post test score was 74.5 and the lowest post test score was 45,
the mean of control class was 60.69, the standard deviation of class control was 6.965, the
standard error of class control was 1.393. (See detail in appendix 2.1).
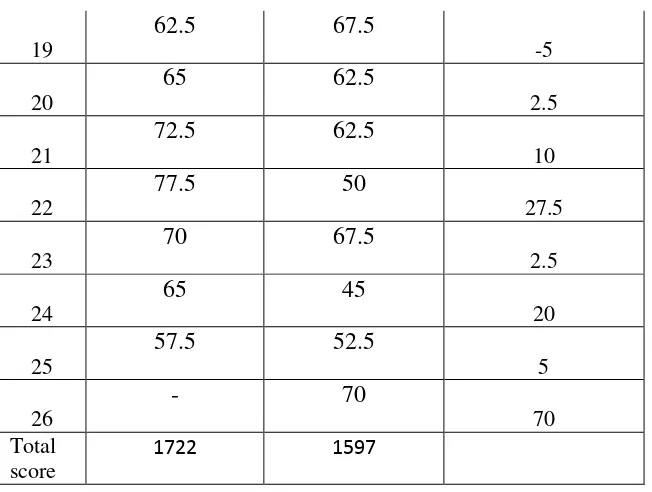
The writer concluded the comparison of post-test score of experiment and control class. Here, the calculation of the result in table 4.3:
No
The Post-Test Score
Experiment Control Increased
1
55 55
0
2
47.5 57.5
-10
3
80 74.5
4.5
4
70 52.5
17.5
5
70 62.5
7.5
6
80 70
10
7
70 57.5
12.5
8
72.5 65
7.5
9
82 65
17
10
72.5 65
7.5
11
60 70
-10
12
77.5 62.5
15
13
60 57.5
2.5
14
75 60
5
15
62.5 65
-2.5
16
62.5 55
7.5
17
87.5 67.5
19.5
18
72.5 57.5
19
62.5 67.5
-5
20
65 62.5
2.5
21
72.5 62.5
10
22
77.5 50
27.5
23
70 67.5
2.5
24
65 45
20
25
57.5 52.5
5
26
- 70
70 Total
score
1722 1597
B. Result of Data Analysis
1. Testing Hypothesis Using Manual Calculation
To test the hypothesis of the study, the writer used t-test statistical calculation. The first, the writer calculated the standard deviation and the standard error of X1 and X2. It was found the standard deviation and the standard error of post-test of X1 and X2 at the previous data presentation. It could be seen on this following table 3.7:
Table 4.4 the standard deviation and standard error of X1 and X2
Variable The Standard Deviation The Standard Error
X1 9.2519 1.888
X2 6.965 1.393
X1 = Experiment Class X2 = Control Class
The table showed the result of the standard deviation calculation of X1 was 9.2519 and the result of the standard error mean calculation was 1.888. The result of the standard deviation calculation of X2 was 6.965 and the result of the standard error mean calculation was 1.393.
The next step, the writer calculated the standard error of the differences mean between X1 and X2 as follows:
Standard Error of mean of score difference between variable 1 and variable II:
𝑆𝐸𝑚1− 𝑆𝐸𝑚2 = 𝑆𝐸𝑚12+𝑆𝐸𝑚22
= 1.8882 + 1.3932
= 3.564544 + 1.940449
= 5.504993
= 3.423
Then, to examine the hypothesis, the writer used the formula as follow:
=68.8−60.29 2.346
= 3.495
Next, the writer accounted degree of freedom (df) with the formula as follow:
𝑑𝑓 = (𝑁1 +𝑁2−2)
= 25 + 26−2
= 49
ttable at df 49 at 5% significant level =3.495
The writer chose the significant level on 5%, it means the significant level of refusal of null hypothesis typed stated on non-directional (two- tailed test). It meant
that the hypothesis can’t direct the prediction of alternative hypothesis.
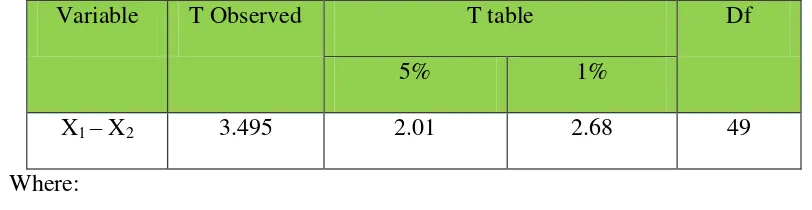
The calculation above showed the result of t- test calculation as in the table follows:
Table 4.5 the result of T-test
Variable T Observed T table Df
5% 1%
X1 – X2 3.495 2.01 2.68 49
Where:
Tobserve : The Calculated Value Ttable : The Distribution of t value
Df : Degree of Freedom
Based on the result of hypothesis test calculation, it was found that the value of tobserved at significance level or 2.01<3.495>2.68. It meant Ha was accepted and HO was rejected.
It could be interpreted based on the result of calculation that Ha stating the students taught by used authentic materials as media have better vocabulary mastery that taught using handout was accepted and Ho stating that the students taught by used authentic materials as media not have better vocabulary mastery than those taught used textbook was rejected. Therefore teaching using authentic material as media gave significant effect on English vocabulary mastery of the eighth grade students MTs Darul Amin palangka raya.
2. Testing Hypothesis Using SPSS Program
Table 4.6 the Standard Deviation and the Standard Error of X1 and X2
Group Statistics
Class N Mean Std. Deviation Std. Error Mean
SCORE 1.00 25 69.060 9.308 1.86
2.00 26 61.423 7.110 1.39
The table showed the result of the standard deviation calculation of X1 was 9.308 and the result of the standard error mean calculation was 1.86. The result of the standard deviation calculation of X2 was 61.423 and the standard error mean calculation was 1.39.
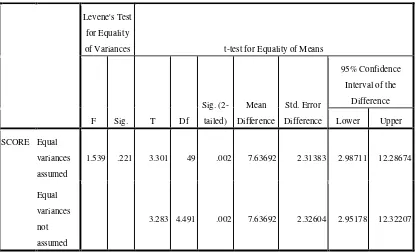
Table 4.7 the Calculation T-test Using SPSS 16 Program Independent Sample Test
Levene's Test
for Equality
of Variances t-test for Equality of Means
F Sig. T Df
Sig.
(2-tailed)
Mean
Difference
Std. Error
Difference
95% Confidence
Interval of the
Difference
Lower Upper
SCORE Equal
variances
assumed
1.539 .221 3.301 49 .002 7.63692 2.31383 2.98711 12.28674
Equal
variances
not
assumed
Based on the result of t-value using SPSS 16 program, since the result of the post-test between experimental and control group had difference score of variance, it found that result of tobserved was 3.301, the result of mean differences between experiment and control group was 7.63692.
To examine the truth or the Ho stating that there is no significant difference between English vocabulary mastery using authentic material as media and without authentic material as media on English vocabulary mastery at the eighth grade student MTs Darul Amin Palangka Raya was rejected, the result of post-test was interpreted on the result of degree freedom to get t-table.the result degree freedom (df) was 49. The following table was the result of tobserved and ttable from 49 df at 5% and 1% significance level.
Table 4.8 the Result of T-Test
Variable T Observed T table df
5% 1%
X1 – X2 3.301 2.01 2.68 49
Where:
X1 : Experiment class X2 : Control class
Tobserve : The Calculated Value Ttable : The Distribution of t value
3. Interpretation
The interpretation of using SPSS16 program also supported the result of manual calculation. From the result of t-value using SPSS16 above was found that Ho was rejected. It was found tobserved 3.301 was higher than ttable 2.01 in the significance level of 5% and higher in the significance level of 1% 2.68. It could be interpreted that alternative hypothesis Ha was accepted. Therefore teaching using authentic material as media gave significant effect on English vocabulary mastery of the eighth grade students MTs Darul Amin palangka raya.
C. Discussion
The result of the analysis showed that authentic materials as media gave significance effect to the English vocabulary mastery. It could be proved from the
students’ score the student taught used authentic materials as media reached higher
score than those used textbook. It was found the mean of experiment class the score (X1) was 68.8 and the mean of control class (X2) was 60.69. Then, those results were compared using T-test and it was found tobserved computation used manual was 3.495 and ttable was 2.01. It meant, from the computation was found tobserved > ttable.
increased after was conducted treatment. It supported the previous study by Zoghi stated in chapter II page 13 for this result, the results show that most of the student’ attitude towards the use authentic English of authentic English language material are positive and they enjoy learning.1
Second, teaching vocabulary by using authentic material can effect on
students’ motivation and increases student’ vocabulary at the students of eighth grade
students of MTs darul amin Palangka Raya. This supported by Chavez stated in chapter II page 25, the main advantages of using authentic materials are as follows:2
It has a positive effect on students’ motivation, it gives authentic cultural information,
it exposes students to the real language, it relates more closely to students need, it supports a more creative approach to teach, and it increases students’ vocabularies.
The tried, the students were preferred study English vocabulary through authentic materials so that they could really used such materials in the real situations. Although learning vocabulary through authentic materials were very active and had more comfort as well as self confidence when they attended and participated in the class. Nonetheless, they seemed not to have difficulty in understanding the lesson using authentic materials since most of them had certain background knowledge about the class materials.
1
Masoud Zoghi, Ftemeh moradiyan zardak, seyyed ali kazemi, The Effects of Authentic Materials On Vocabulary Development, Journal International: IJLLALW, 2014. P.157. URL :
http://www.ijllalw.org/finalversion5413.pdf (acsessed on April 22, 2015 at 10:23 am)
2
The fourth, using authentic material, the students were enjoyed to learned English vocabulary. Students get greatly motivated again for reading by using authentic material in the foreign language classroom, deference between non authentic materials, the students were boring to learn English vocabulary because they were used text book there is no other media.
Besides, the students in control class were bored to learn English. It is caused they were taught using non-authentic materials. Non-authentic material does not have varied vocabulary and it does not give students authentic information about the
culture. It can be said that this is the factor why the students’ scores of experimental
class are higher than the students’ scores of control class.
In order to know there is significant difference or no between students’ scores
who taught using authentic materials and those who taught using non-authentic materials in students of eighth grade students of MTs Darul Amin Palanga Raya, the writer had conducted pre-test and post-test to both classes (experimental and control class). From the result, the writer known that teaching students by using authentic materials can improve students’ skill in learning English especially in English
vocabulary mastery. It is known from data that collected from students’ scores in pre
-test and post--test of both classes that had been calculated by the writer.
The data showed that students’ scores in post-test of experimental class were
higher than the students’ scores in post-test of control class. So, it proves that Ha that
stating there is significant difference between students’ scores who taught using
and Ho that stating there is no significant difference between students’ scores who
taught using authentic materials and those who taught using non-authentic materials is rejected.
So, using authentic material gave effect for English vocabulary mastery, for