108 JURNAL MANAJEMEN BISNIS DAN INOVASI VOL.5 NO.2.JULI 2018, HAL.108-117
FACTORS AFFECTING OPERATING CASH FLOW TO STOCK RETURN
THROUGH STOCK PRICE
financing of production activities, pay employees, pay other expenses related to the operation of the company. One way to obtain these funds is to attract investors to invest in companies in the form of stock, but in making this investment is certainly not easy for investors, because investors need consideration beforehand to find out how the company's performance. The purpose of this study was to examine and analyze the effect of operating cash flow to stock return through stock price at companies listed on the Stock Exchange Year 2012-2015. The data used in this study dala are secondary data from the financial statements of companies listed on the Indonesia Stock Exchange period 2012 - 2015. The data are in the form of financial statements can be obtained from the Indonesian Capital Market Directory (ICMD), the IDX website www.idx.co. id as well as from various other sources to support this research. The population in this research is manufacturing companies listed on the Stock Exchange the period 2012 - 2015. The samples taken by the sampling technique used purposive sampling.From the test results and analysis of the data it can be concluded that operating cash flow directly and indirectly has no effect on stock returns through stock prices showed no significant results.Abstrak: Perusahaan perlu dana untuk melaksanakan operasi seperti
109 JURNAL MANAJEMEN BISNIS DAN INOVASI competitive environment marked by the emergence of many new companies, then that goal is not easy to achieve. Where the management company is required to be able to improve the company's performance to be better, and improve the quality of corporate financial information to be used for decision making that support the achievement of the company.
Companies need funds in order to carry out operations such as the financing of production activities, pay employees, pay other expenses related to the operation of the company. One way to obtain these funds is to attract investors to invest in companies in the form of stock, but in making this investment is certainly not easy for investors, because investors need consideration beforehand to find out how the company's performance.
According to Weston and Brigham (2001), the factors that affect stock prices are Earning Per Share (EPS_), the interest rate, the amount of cash dividends distributed, the amount of profits from the company, the level of risk and return, the marketing strategy (New Product Development, supply Chain Management, Market Based Management).
Husnan (2001) also explained that the fundamental analysis based mindset stock price behavior is determined by changes in the variation changes the behavior of the variables the basic performance of the company. To be able to know how the performance of the company's investors need information, one of which is information regarding the company's financial statements. SFAS (Statement of Financial Accounting Standards) No. 1 (2007) explained the purpose of the financial statements for the general purpose is to provide information about the financial position, performance and cash flows of companies that benefit the majority of the users reports in order to make economic decisions and demonstrate accountability (stewardship) management on the use of resources power entrusted to them.
One measure (parameters) that can be used to measure the financial performance is that accounting profit as contained in the statement of income, which is a measure of corporate performance of the key considerations for investors in investment decisions. The importance of accounting earnings information are clearly stated in PSAK No. 25 (IAI, 2007) that the income statement is the main report to report the performance of a company for a specific period. Information on the performance of a company, especially about profitability, it needs to make decisions on economic resources will be managed by a company in the future.
Besides information accounting earnings, investors also need the information in the form of cash flows as a measure of corporate performance. Because the cash flow statement can provide a clear picture of the company's cash flow to investors, and cash flow statement can also predict future cash flow and the impact of price changes. As stated in PSAK No. 2 (IAI, 2007) on a cash flow statement which recommends companies must submit a cash flow statement as an integral part of these financial statements. Historical cash flow information is often used as an indicator of the amount, timing and certainty of future cash flows. In addition, the cash flow information is also useful in checking the accuracy of the estimated future cash flows that have been made previously and in determining the relationship between probabilitias and net cash flow and the impact of price changes. In PSAK No. 2 (IAI, 2007) describes the presentation of the cash flow statement is divided into three components (activity), which is operating cash flow, cash flow investing and financing cash flows. The distinction components of cash flow is important because each component is considered to have a different effect on stock prices.
Previous research conducted by Rohman (2005), which examines the direct and indirect effects of cash flow to the volume of stock trading on the Jakarta Stock Exchange listed companies. His research concluded that the size of the operating cash flow did not affect (not significant) on the level of stock trading volume. The research Sinaga (2010) entitled the analysis Effect of total cash flow on stock returns, explaining that the total cash flow, investing cash flows, cash flow financing, no significant effect on stock returns, while operating cash flow have a significant effect negative stock returns.
110 JURNAL MANAJEMEN BISNIS DAN INOVASI VOL.5 NO.2.JULI 2018, HAL.108-117 increasingly rapid and modern, this can be seen from the type of manufacturing include chemical and basic industry sectors, the various sectors of industrial and consumer goods industry sector. Based on the inconsistencies that occurred in previous studies, it encourages researchers interested in conducting further research.
THEORETICAL FRAMEWORK AND HYPOTHESIS DEVELOPMENT
Investors in general are always risk averter (avoiding risk) and a rational person. Thus the investor in making an investment decision (to sell or buy shares) will be based on information either fundamental or technical. One of the fundamental factors of the most commonly used is the operating cash flow and the accounting profit. Operating cash flow can be used to determine the strengths and weaknesses of the company. Operating cash flow can also be used as an early warning signal to the deterioration of financial conditions by comparing with the previous year.
Based on the report that contains the contents of information that is important for investment decisions an investor, where if a company has operating cash flows are adequate, the financial condition of these companies can be said to be good so it will be a good response as well by investors. The influence of each of these variables on stock prices and stock returns can be described in the model as shown in the following figure:
Figure.1 Research Framework Source: Journal of developed
Sugiyono (2014), understanding the research hypothesis is a temporary answer to the formula research problem, therefore the formulation of research problems are usually arranged in the form of a question sentence. Based on the above framework, the authors formulate the hypothesis that the tentative conclusions of the study as follows:
H1 : Operating Cash Flow effect on Stock Return H2 : Operating Cash Flow effect on Stock Price H3 : Stock Price effect on Stock Return
RESEARCH METHOD
In this study, the data used are secondary data from the financial statements of companies listed on the Indonesia Stock Exchange period 2012 - 2015. The data are in the form of financial statements can be obtained from the Indonesian Capital Market Directory (ICMD), the IDX website www.idx.co. id as well as from various other sources to support this research.
The population in this research is manufacturing companies listed on the Stock Exchange the period 2012 - 2015. The samples taken by the sampling technique used purposive sampling.
Data collection methods used in this research is the method of documentation, in the form of a manufacturing company's financial statements are derived from Indonesian Capital Market Directory (ICMD), the IDX website: www.idx.co.id as well as from various other sources to support research this.
111 JURNAL MANAJEMEN BISNIS DAN INOVASI VOL.5 NO.2.JULI 2018, HAL.108-117 Analysis of the use of the data that has been described, by using qualitative analysis and quantitative analysis. Qualitative analysis is used to illustrate how net income, free cash wear and cash dividends on mining companies listed on the Indonesia Stock Exchange period 2012 - 2015.
In the quantitative analysis testing process consists of several steps being taken with the help of a computer softwere named SPSS , The stages are as follows: (1) Descriptive Statistics. (2) Classical Assumption Test (Normality Test, Test Multicollinearity, Test Heterokedastis). (3) Hypothesis.
RESULT AND DISCUSSION Result
This study is researching on the influence of operating cash flow to stock return through the stock price. It is intended to test how much influence operating cash flow to stock return through stock price. Object of research used in this research is manufacturing companies listed in Indonesia Stock Exchange during the period of 2012 - 2015. The method used to obtain the sample is purposive sampling method. Samples accordance with the criteria specified there are 19 companies that could be used as a sample. The data used in this study were taken from the Financial Statements of Manufacturing a sample of a study. Period of this research is for 4 years from 2012 to 2015 with a sample of the study determined that 76 samples. The information required in this study such as financial statements sample of companies listed on the Stock Exchange from 2012 until 2015 outlined in the form of statistics.
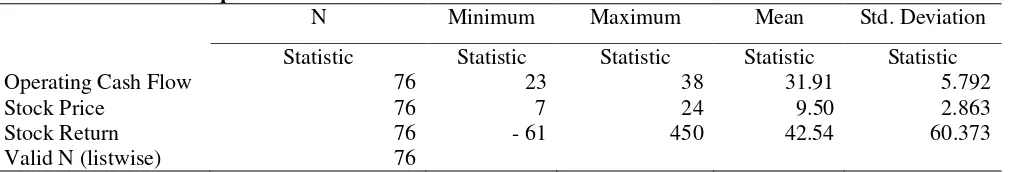
The variables of this study consisted of operating cash flow as independent variables. Stock return as dependent variable and the stock price as an intervening variable. Descriptive statistics of the variables of the sample of manufacturing firms during the period 2012 to 2015 are presented in the table below:
Table 1.Statistic Description
N Minimum Maximum Mean Std. Deviation
Statistic Statistic Statistic Statistic Statistic
Operating Cash Flow 76 23 38 31.91 5.792
Stock Price 76 7 24 9.50 2.863
Stock Return 76 - 61 450 42.54 60.373
Valid N (listwise) 76
Based on the above table can be explained as follows Operating Cash Flow are a total sample of results obtained minimum 76 23 38 value of the maximum value of an average of 31.91 and a standard deviation of 5.792; Stock Prices are the total sample of the results obtained minimum 76 7 24 value of the maximum average value of 9.50 and a standard deviation of 2.863; Return Stocks are a total sample of results obtained minimum 76 -61 450 value of the maximum value by an average of 42.54 and a standard deviation of 60.373.
Classic Assumption Test Normality Test
112 JURNAL MANAJEMEN BISNIS DAN INOVASI
Most Extreme Differences Absolute .297 .280 .317
Positive .241 .280 .317
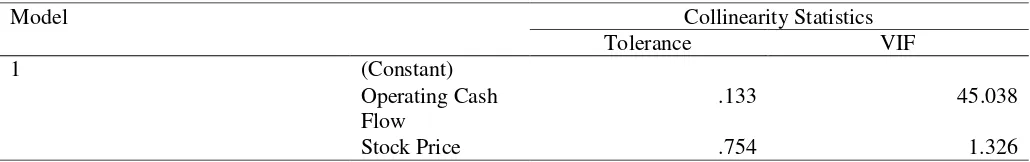
Multicolinearity test aims to test whether the regression model found a correlation between the independent variables. A good regression model should not happen correlation between the independent variables or free (Ghozali, 2011). To detect the presence or absence of multicollinearity in the regression model is to look at the values of tolerance and Variance Inflation Factor (VIF). Multicolinearity can be seen with the value of Tolerance and Variance Inflation factor (VIF), a regression model that does not have a problem multicollinearity if VIF (Variance Inflation factor) under number 10 and have a number of Tolerance above 0.10. If a regression model having problems multikolinieritas if having VIF (Variance Inflation factor) over 10 and have a number of Tolerance under 0.10. Based on the results it can be seen that all the VIF on the results that the regression model did not happen multicoliniearity.
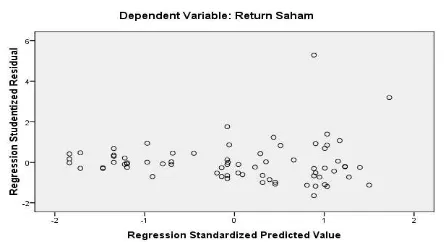
Heterokidastity Test
113 JURNAL MANAJEMEN BISNIS DAN INOVASI VOL.5 NO.2.JULI 2018, HAL.108-117 Figure 2. Heterokidasitity Test
Results of regression that heterokidastity problem does not occur. This is evidenced by dots spread randomly and high spread above or below the number 0 on the Y axis is irregular and does not form a specific pattern, so it was concluded that this test does not happen heterokedastisitas problem.
Test Results Hypothesis I
Hypothesis I examines the effect of operating cash flow to return stock either directly or indirectly through the stock price. Hypothesis testing is done using a multiple linear regression path analysis through the coefficient determination test, a statistical test F and test t statistic.
Effect Operating Cash Flow To Stock Return
Table 4.Test results R2 Operating Cash Flow to Stock Return
According to the table 4, figures R Square is 0.199 (is squaring the correlation coefficient or 0.446 x 0.446 = 0.199). The coefficient of determination of 19,9 % that the stock price can be explained by the variable operating cash flow. While the remaining 80,1 % is explained by other causes beyond the independent variables used in the study, because R Square are likely to be small, the relationship between both variables is weak. Thus, small R Square which means the ability of independent variables in explaining the dependent variable is very limited.
Tabel 5.Test Result t Operating Cash Flow to Stock Return
Model R R Square
1 .446a .199
Model
Unstandardized Coefficients
t Sig.
B Std. Error
1 (Constant) 22.214 .912 12.326 .000
Operating Cash Flow .236 .153 -2.976 .005
114 JURNAL MANAJEMEN BISNIS DAN INOVASI VOL.5 NO.2.JULI 2018, HAL.108-117 According to the table 5 can be made the first equation to calculate path coefficients, ie the regression equation showing the relationship hypothesized. In this case the equation is as follows:
M = a + b1.X + e1
M = 22,214 + 0,236. X + 0,642...(1) ***Value e1 = (1-0,199)2 = (0,801)2 = 0,642
Standardized coefficient beta operating cash flow in equation (1) positive at 0.236 and significantly (p <0.05) is 005, which means the operating cash flow could affect stock prices. Standardized beta coefficient value 0.236 is the value Ataur path p1 track.
Effect of Operating Cash Flow to Stock Return through Stock Price
Tabel 6. Test Result R2 Operating cash Flow to Stock Return through Stock Price
Model R R Square
1 .334a .161
According to the table 6, figures R Square is 0.161 means the ability variable operating cash flow and stock price variables in explaining stock return of 16,1 % while the remaining 83,9 % is explained by other variables outside independent variables used in this study, because of the numbers mentioned above R Square 0.05 then the two variables are strong.
Table 7. Test Result F Operating cash Flow to Stock Return through Stock Price
Based on test results obtained table ANOVA or F F count was 2.916 with a significance level of 0.283, because the probability of 0.283 is much greater than 0.05, then the regression model can not be used to predict stock returns or operating cash flow and share price together not effect on stock returns.
Table 8.Test Result t Operating cash Flow to Stock Return through Stock Price
Model
Unstandardized Coefficients
Sig. B
Std. Error
1 (Constant) -39.386 56.533 .742
Operating Cash
Flow 3.926 1.574 .189
Stock Price -.127 4.213 .998
a. Dependent Variable: Stock Return
Based on the results in the table 8 above can be made calculate path coefficients are the regression equations that show the relationship hypothesized. Following equation:
Y = a + b2.X + M+ e
Y = - 39,386 + 3,926. X – 0,127. M + 0,704
Model F Sig.
1 Regressio
n 2.916 .283
a
115 JURNAL MANAJEMEN BISNIS DAN INOVASI VOL.5 NO.2.JULI 2018, HAL.108-117 ***Value e = (1 – 0,161)2 = ( 0,839 )2 = 0,704
Unstandardized beta coefficient value Operating Cash Flow of 3,926 and stock prices with a significance level of 0.000 respectively 0.189 and 0.998. The value of unstandardized beta coefficient is 3,926 lane path p3 value and the value of unstandardized beta coefficient of - 0.127is the value p2 path.
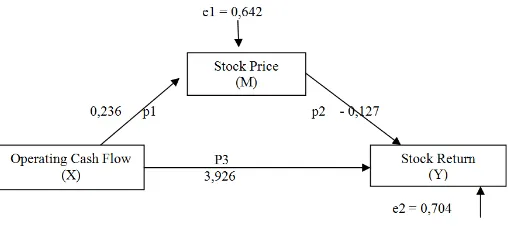
Figure 3. Path Analysis Result Operating cash Flow to Stock Return through Stock Price
Based on the results of the path analysis and Figure 3 and Table 8 shows that the direct effect of operating cash flow to stock return is positive and significant 3,926 by 0.189 (above 0.05), so it can be concluded that the operating cash flow does not directly influence stock returns. While the indirect effect of operating cash flow to return stock with stock prices showed no significant effect due to above 0.05 is 0.189.
The total effect of accounting profit on stock returns as follows:
The direct effect of accounting profit to the stock return (p3) = 3,926 The indirect effect of accounting profit to the stock return (p1 x p2) = -2,030 The total effect of accounting earnings correlation to stock returns (p3 + (p1xp2) = 0.896
The results of path analysis on a hypothesis showed no direct influence operating cash flow on stock returns through stock price. The relationship is not directly supported by empirical evidence. This is because multiplication unstandardized beta coefficient value p1 and p2 smaller than the unstandardized beta coefficient p3.
There are several possibilities to explain these results. First, the results of the model in this study proved to be less good, because if in the analysis based on the comparison of the value of R Square with estimated standard error greater results mistakes. Second, an error in the data structure in the study include: (1) there is the possibility of errors in recording or inputting dat to the computer; (2) the number and characteristics of the samples used by researchers only 19 companies are relatively small and the characteristics of the data obtained from the website of Indonesia Stock Exchange (BEI) is very limited means have limited data to be processed to make lower quality. Conditions such as inimenurut researchers because there are some companies that do not include a summary of its financial performance in a timely manner, so that the result does not correspond to actual reality.
The results of the study hypothesis as a whole show that the operating cash flow can not directly affect stock return. While the stock price does not affect significantly between operating cash flow to stock return. Based on the results obtained so Ha rejected.
CONCLUSION, IMPLICATION AND LIMITATION
Conclusion
116 JURNAL MANAJEMEN BISNIS DAN INOVASI VOL.5 NO.2.JULI 2018, HAL.108-117 listed in Indonesia Stock Exchange. This test uses the program path analysis using SPSS. From the results of the testing and analysis of data can be summarized as follows: The operating cash flow directly and indirectly has no effect on stock returns through stock prices showed no significant results, while operating cash flow has no direct influence on stock returns.
The Theoretical Implication
The implication of this research is theoretically as empirical support how operating cash flow effect on stock returns through stock price. Based on the analysis, the theoretical implications of this research are as follows:
Research on the effect of operating cash flow to stock return through stock price of manufacturing companies listed in Indonesia Stock Exchange can be proved and has significant influence, the results of this study support Sinaga (2010) but the results of this study differ from research Hariono (2010). Research on operating cash flow to stock return through share price of manufacturing companies listed in Indonesia Stock Exchange can be proved and has significant influence. The results of this study support Daniati and Suhairi (2006) entitled Effect of Content Components Information Cash Flow Statements, Gross Profit and size of the company against the Expected Return explained that the investment cash flow, cash flow financing, gross profit and company size significantly influence the expected return, while operating cash flow does not affect the expected return.
The Managerial Implication
The dependent variable in this study is that stock returns are influenced by independent variables operating cash flow through stock price. There are measures of the performance of the company's accounting is the total cash flow. Managerial implications of this research for manufacturing companies listed in Indonesia Stock Exchange: Cash flows from activities are primarily derived from the principal revenue-producing activities of corporate profits, therefore the cash flows are generally derived from transactions and other events that affect the determination of net profit or loss. Beasal amount of cash flows from operating activities is an indicator of its operations to determine whether the company can generate sufficient cash flows to repay loans, maintain the operating capability, pay dividends and make new investments without relying on external sources of financing.
Limitation
There are limitations to this study that the results can not be digeneralisation on manufacturing companies listed in Indonesia Stock Exchange because not many companies that produced positive cash flow so that the samples obtained are limited.
Suggestions for Future Research
Given the limitations of the research, further research needs to add independent variables other than those used in this study.
REFERENCES
Agus Harjito and Martono. 2007. Financial Management. Yogyakarta. Ekonosia
Brigham, et al. 1999. Intermediate Financial and Management. The Dyden. Press: Fourth Edition
Belkaoui, Ahmed Riahi. 2000. Accounting Theory, First Edition, Interpreting Marwata S.E., Akt. Salemba Four, Jakarta.
Harahap, Sofian Safri. 2010. Critical Analysis On Financial reports. Jakarta: Rajawali Persada
117 JURNAL MANAJEMEN BISNIS DAN INOVASI VOL.5 NO.2.JULI 2018, HAL.108-117 Masyhuri and M. Zainudin. 2009. Methods: A Practical Approach and Applicative. PT. Refika Aditama:
Bandung.
Pradhono and Julius Jogi Christiawan. (2004). Effect of Economic Value added, Residual Income, Earnings and operating cash flows to the return received by shareholders (Study on manufacturing companies listed in Jakarta Stock Exchange). Journal of Accounting and Finance Vol. 6, No. 2 November 2004: 140-166. Rohman Abdul .2005. Effect of Direct and Indirect Cash Flow and Profit Of Trading Volume in Shares on the
Jakarta Stock Exchange Issuers. Journal of Accounting & Auditing Volume 01 / No. 02 / May 2005: 95-11196
Sugiyono. 2014. Quantitative Research Methods, Qualitative, and Combination (Mixed Methods). Bandung: Alfabeta
Suad Husnan. 2001. Fundamentals of Theory and Analysis Portfolio Securities. Yogyakarta. Publisher UPP AMP YKPN
Siegel and Shim. 1999. Dictionary of Terms Accounting: Kurdish interpreter by Muh. Jakarta. Gramedia
Sawidji, Widoatmodjo 2005. The Healthy Way of Investment in Capital Markets, PT Elex Media Komputindo, Jakarta.
Sinaga, Hariono Hardian 2010. Influence Analysis Total Cash Flow, Cash Flow Components, Accounting Earnings Return Against Manufacktur Shares in the Company in the Indonesia Stock Exchange Period 2008-2010. Petra Christian University, Surabaya.
Tulung, Joy Elly, and Dendi Ramdani. 2018. Independence, Size and Performance of the Board: An Emerging Market Research. Corporate Ownership & Control, Volume 15, Issue 2, Winter 2018.
Van Horne, James C. and John M. Wachowicz, Jr., 1998. Principles of Financial Management, Interpretation: Heru Sutojo, Book Two, Ninth Edition, Salemba Four, Jakarta.