1-
r--
L-r-al
L-fEdlL-
r-.-
L-
r--
L-r
.--
L-
r,--
L-rr
fr-
L-tr
g
Proceedinq
MfE#IMf,ERNAM
@NffiRENGEffi@M
lssN
2302-108X
VOLUME
5
E
$
ESYO
U
c{o
N
sll
=l
r,
M
RGE
G@GRGINq$
L-f---a
L]
l--a
l_
L.-a
I
f-r-al_
l-Il_
l-a
l_
r-a
t_
l-Il_
t{a
lj
L{t--L
.L
6) q fs
tr E'
o
\J)L
4o,
February
12
-
13,
2014
Batu, East Java, lndonesia
Faculty
of
Mathematics and Natural Science
The sih lnternational Confelence on Global Reoutre
Gonservatbn
I
February
12-B"l2Ol4
MESSAGE
TROM
RECTOR OF
BRAWIJAYA
UMYERSITY
Honorable Keynote Speaker
Prof.
Dn
ltdasrshiKrto,
Dep. of Applied Biological Chemistry, Meiio University NagoyaPrcf. Dr. rcr.
NatHelmut
Erdmann, Flesnburg University of Applied Science Pnof.Dn Maketrb
Mohamed, Malaysian Nature Society, Malaysia"Er.tr'arah
Atnt Abdullth,
School of Mathematical Sciences, Universiti Sains Malaysia Prof.Dn
Chow Son Chen, School of Earth Science, National Central University, TaiwanDean Facutty of Mathematics and Natural Sciences And
All
participantsAssalamualaikurn Warahmatullahl Wabarahatahu
First of all let us pray to Allah
ttrc
Almighty for His blessings bestowed to all of usfiat
todaylve o8n all be here to attend the The 4th annual Basic Scionce International Conference and the Sft Interndional Conference of Global Resources Conservation.
It
is
indeed an honormd
privilegcfor
mcto
welcome youwarrrly
atftis
Conference.My
great appreciationto
all
of you the distinguished participanbof
&is
important event, andtrust tlnt this conferencb
will
be an valuable input to the earpowermentof
Applying scienceto conserue our nature.
I
would like to take this opporhmlty to offer my appreciation to DeanFaculty
of
ldathematics andNatural
Sciences, and committeefrom Biology
DeparfrnentUnivcrsity of Brawijaya who have otganizedthis Seminar.
Dlsfrngulshed Gues&, Itdtcs and Gentlenun,
University
of
Brawiiaya(UB)
as oneof the leading university in Indonesiawith
its missionof
lVorld Class University, should take actions to participate in conserving our nature where we are tiving inside through innovation of science. We encourage all of academician here, as thebackbone
of nation
building for
oontinuous leamingto
save our planetfor
best interestof
- human being andliving
thing
Thereforg We shouldwort
togedrcr, across institrtions and aoross discipline. We should start thinking howto
be leader and conhot the worldwith
our resources, knowledgs and technoloryto achieve an equitable welfare.Dlstiagutshed
Gurstr,,ry
and
Gentlemcn,UB
wi&
combination betrreen International standard and local culture has been educatingcommunities
wto
have made positive impactsin their
Communities-throughout Indonesia Hencewe warmly
welcomes collaborativeworts
of mutual parhership
with many other
institutions; especially universities, industry, govetnnrent and otherin*itution; botr
at nationalmd
internationallevel
Moreover{rB
has dedicatditselfto
be a world class uriversity. Basedon spirit we
belief
ftat
only
with
intemationalpartnenhip
able
pursue multinationalFebruary
12.13d2014
.,1fn"
5m lnternatlonal Gonfelenoeor
Gbbel
RerourceGonsewdion
connectivity on business, established in the higher education institution, for future generations.
In this case, this occasion is really necessary to initiate cooperation beyond national border to
supply comprehensive knowledge to be a winner in the global competition.
DWingulshed
Gucs*, Ladies and Gentlenun,Science, technology and education
will
determine the well-being of people and nations in thefuture.
Therefore, academician and scientist as Scholar whowill
bear the future of ftris nation haveto
worlchar4
andthe
ability
to
createbrilliant
innovationto
supply environmentaltechnolory
to
solve
human problem.UB rely
onand
encourage increased international parfirenhip,'aswell
as greaterstaff mobility. The
parhership,it
will
be
ableto
supportseconomic and social developurbnt.
In
Anothcr word, whatever challerrges thatwill
arise,it
should be challe,nges for all of us, and it should be solved with partrership.
As a conclusion, I,propose
to
stneng$ren our collaborationto
crEate synergism at any levels,espocially all stakeholders,
localln
regionally, as well as intenrstionally. By working togedierall
over tlre world tbrough straring information and resources, we can make the bright future. Finally, letushopetrat
fte
frrdtful poina
aimd
from this confereircewill
developtre
newconcept and networking bas€d on science and technolory to save our nature.
'
'During the organization and execrfion
of
this confer€nce, and the dneI
am currently opening *The 4th annual Basic Science International Conference and the 5th Internafional Conferenceof Global Resources Conservation".
Ladies and ge,nflemen,I hereby wish you a
fruitful
Confer,ence.Vabfltalrto&roolhiloyah
WosatmualathunnwruhnffiullolttroofuaWuh
Thank you for your attention. Malang Fobnrary l5m, 2014
February
12-13ttl2014
I
*"
56lnternatlonal confercnce
on Globet ReeourceGomenrrtion
PREtr'ACE
All
praises are dueto
Allatu God Almighty, Who made this annual eventof
successfulof
"
The *4fr
Annuel
Basic SchnceIntemstional
Confercnce 2014tn conjandlon
r,ffIr The SftIntcrnational
Conference onGlobal
ResourceConsenation2Ol4, both
annual scientificevents organized by the Faculty of Mathematics and Natural Sciences, Brawiiaya University.
In
this year, the conference took a themeof
'Applying
*l"rr""
lo
"oo.u*
neture".
lh"r"
conferences are concerned about our current challenge on how
to
explore,utilize
andapplyour
knowledge
and
scienceto
consewewater,
soil,
earth,
air,
plants, animals
and microorganisms that involved multi disciplines. As a oonjunctive conferences, these covered awide range oftopics on basic sciences: physicq
biolory,
ohemistry, mathematics and statisticsas well as conserryation
biolory
and applied science.The confercnce in 2014 was the continuation of the
precding
conferences initiated in20ll
asthe Internati,onal Confenence
on
Baslc Sclencc OCBS) andIntemstionel
Conference onGlobal Rcsource Conscmatl,on inidnde in 2010. Thercforc the proceeding was also divided
into two bool6, each wittU each with a different ISSN. The proceedings were also published
in
electronic forms &at can be rccessed from BaSIC website.
I
am glad that for the first time both typesof
publication can be realized. These internationalconferences
ale
heldto to
increase disseminationof
applying scienceto
conserve naturalresourc€s, to present new rcsearch findings, ideas and informations and to discuss topic related
to conference theme and to develop collaboration among
multi
discipline sciences and tofind
pote'ntial
young
researchers.This
is in
line with
university
vision as
a
World
ClassEntrepreneurial University
I
am grateful to all the members of the program committee who confributed for the successin
farrring
the program.I
alsotrunk
atl
ttre delegates wtro contributedto
the successof
thisconfenence by accesing our invitation and submitting paper for presentation
in
thescienffic
prograrn.
I
am also indebtedto
PT. Fajarmas, PT. Makmur Sejati, KPRI,CV.
Gamma, PT.Tata Bumi Raya and CV. Enscval Medica Prima for their sup,port in sponsoring this event.
I
hope that you enjoy in this seminar. We wish for allof
us a grand success in our scientmclife and forthe coming conferences and even
better.
!Thank you,
Amin Setyo Lelrsonq Ph.D.
E
tr
tr
€
l-H
l-€
Tlro 5o lnternatlonal Gonferunce on
Gbb.l
Recourcecomervauon
I
February12"8i{2014
PrrydnC.ommittee
Stcerftgcmmittce
Rect6, University of Brawiiaya
Deq
Faadty ofltde&ematicsedNdural
SciemceqAssociato Deam
l,
2 and 3, Faculty of lvlatherretics and Natural ScicncesChairperson
AminSetyoLeksouo,S.Si.,M.Si.Jh.D.
(Deputy-Ctsir
Lukman HakirL S.Si.,MSc.Dr. Sc.
Secrdary
D.
SriRatra:/rtM.Kes.Treasurtrs
TriArdpti,MAgr.fh.D.
Mrs. Sri Punrqini
Mrs. Rusikri Adiningrum
Publication & nooscaings
Muhaimin
Rifa'i
Ph-D.Md.Sc
Luchmm Hakino, MAgr.,Ph.D
Secrctariats
andrqifidion
jIUrs. SriAsrinin lvlrs. Trivira Meirany
I\,Is.
fuikArubil
IvIr.Elsan
Scientific sections
ud
progrmDr.k
MocL SamitoDjt,
trtS.Dr. Suharjono fur.
Pori"s"noilo
Transportatioq cxcursion & social Evmt
D.
AguB Prameaf,rrih
!6aha&a, M.Si.Dr. Nunungllarijati
Dr.
SriWidfrti
Brian Rahadi, S.Si., lvlSc.
lvfrs.
Arnawati
'ee'Veirue
Dr. Soff Permanq lv[.Sc, D.Sc. Drs. Ads Socrvmdo,
I[Si.
Ifr.I(ar1,adi BkaPutra Mr. AggnsKumiawan Mr. Ifasan Muhajir
Cmnmpions
Dra. Gu$iniEkowui
G
Februirry
t2-t3ld:mle
I
nrc
sotntcnrrttonet Confecnce
on GloDel RecourcaConaervdion
t-
--IE
l
I
tE
Prof. Dr. rer. Nat Helmut Erdmann, Flesnburg Universiry of Applied
Science
"
iProf. Dr. Maketab Mohame4 MalaysianNatire
Society,ltalaysia
.#
Prof. Dr. Chow Son CherU School of Earth Scicncg National Central University, Taiwan
Prof.
)
Fatchiyalu M.Kes., Ph.D, Deparfinentof
Biolqry,
BrawijayaUniversity
g
B.Farah Aini Abdullah, School of Mathemdical Sciences, Universiti Sains
Malaysia
)
Dr.h. Estri laras, MSt Sc.,
DepartnentofBiologr,
BrawliayaUniversity
't;'.'|
Dr. Sasmito Djati, Deparbnent of Biology, University of Brawiiaya,
Indonesia
)
Dr. Setijono Samino, Department of
Biolory,
UniversityofBraw[iayg
Indonesia
g''i
Dr. Chomsin S. Wldodo, Department of Ptrysic, Unlverslty of Brawljaya,
lndonesia
)
-r
\7i
)
Fr
\Y.)
-r
v.r
)
H
)
-r
=/
II
:/
H
J
-a
'yTJ
H
=T
I.{
YIJ
-{
:I
-=1
-!?r)
Fl
I
lt
:I
trl
vt
)
E
)
-l Vr
)
H
V/t)
Qrr,l
)
-i
-, 1)
h
")
--:/
/
7
krternational Scientific Committee and Editors
Prof
Dr. Masashi Kato, Faculty of Agriculture, Departnent of Applied Biological Chemistry, Me[io University NagoyaDr. Endang Arisoesilanlngslh, Department of Biology, University of Brawljaya, lndonesia
Dr. Retno Mastuti, Department of Biology, Univerclty of Brawijaya, lndonesia
Dr. Suklr Maryanto, Department of Physlc, Unlversfi of Srauriiaya, lndonesia
Dr. Didlk R Santoso, Department of Ptrysk, Unhrenlty of Erawijaya, lndonesia
Dr. Ratno Bagus, Department of Mathematics, Unlvercity of Brawijaya, lndonesla
Dr. Wurpnsari Muharini
(,
Oepartment of Mathematks, University of Braudjaya, lndonesiaDr. Barlah Rumhayati, Department of Chemistry, Universlty of BrawUaya, lndonesia
Dr. Elvina, Department of Chemlstry Unlverclty of Brawljaya, lndonesia
Dr. Masrurl Department of Chemistry Univercfi of BrawUaya, lndonesia
Dr. Amln Setyo Lekono, Department of Birclogy, Unfuercfi of Brawliaya, lndonesia
=,
TABLE OF CONTENTS
VOLUME 5
Relationship Model Anomaly Harvested Rice With a Weighted Rainfall Index
in Buru Maluku Using Bootstrap Aggregating Mars Methods To Predict The
Forecast Error Rates Harvested Area And Rice Production
……….
Kondo Lembang, Loupatty, and Talakua. M.
1
Sequential Pattern Discovery Of Deoxyribonucleic Acid (DNA) For Cancer
Patients Using Prefixspan Algorithm
………
Lailil Muflikhah,
Ilham Y Uliantoro,
and Widodo
7
Investigation on
Leaves’ Response
of
Putri Malu
(Mimosa
Pudica
L.) Respects
to Light Intensity
………...
Bagus Haryadi, Pramudhita A. Nugraha, Danu Taspyanto, and Hariyadi
Soetedjo
13
Productivity and Stability of Cassava Promising Clone ………
Sholihin
21
Shoot Multiplication and Rooting Induction in
Carica Pubescens
Lenne & K.
Koch (Mountain Papaja)
………
Enni S. Rahayu Noor A. Habibah
Mufidah H. Noviana
24
SODIUM CARBOXYMETHYL CELLULOSE (Na-CMC) FROM CORN
COB
………...…
Sirin Fairus, Dyah. S. Pertiwi, Dony Aryandi, and Wildan Priyogo
29
Automation Systems for Regeneration Process of Demin Water to Maintain
Quality Control Using Programmable Logic Controller
………...
Syahril Ardi, Sirin Fairus, Vionita Kartika Putri
34
Development of Somatic Embryos and Secondary Somatic Embryos of Cassava
……….
Surya Diantina, Darda Efendi, Ika Mariska
38
The Effect of CO2 Concentration in Modified Atmosphere Package and Storage
Length on Meat Quality of Broiler
………...……….
Herawati
43
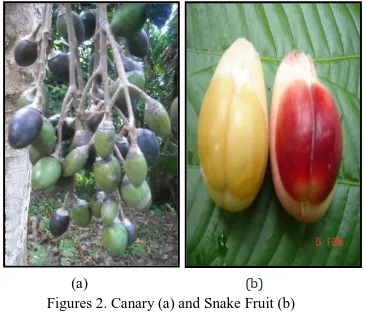
RESOURCE POTENTIAL OF SNAKE FRUIT (Salacca
Zalacca
Var
Amboinensis) AND CANARY (Canarium
Amboinense)
IN THE LIFE OF
SERAM ISLAND SOCIETY, MOLUCCAS
………
Marcus J. Pattinama1, Aryanto Boreel, Jane K. J. Laisina, And Handy E.P.
Leimena
51
Inventorization of Edible Macrofungi From the Tropical Rainforest Ecosystem
of Meru Betiri National Park East Java
………
Arif Nur Muhammad Ansori, Laifa Fusvita,
Nastiti Trikurniadewi, Fadilatur
Rahmaniyah,
Elvin Haris Arizal, and
Ni’matuzahroh
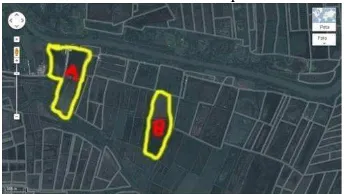
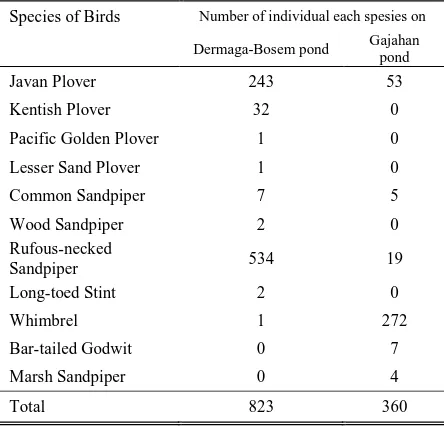
COMPARATIVE STUDIES OF THE WATERBIRD DIVERSITY FROM
FAMILY SCOLOPACIDAE AND CHARADRIIDAE ON WONOREJO
CONSERVATION AREA IN SURABAYA
………
Alexander K. S. Putera
Nurul A. Dianti, Elvin H. Arizal, Riris Damayanti,
Robbyke Ogistyawan F., And Bambang Irawan
58
Willingness to Pay to Avoid Deforestation and Forest Degradation:
Evidence
from Berau District Indonesia
………
Akhmad Solikin
61
Identification of Vegetation Diversity for Keeping the Quality of Slope Around
Dengkeng Watershed in Klaten Central Java
………
Maridi ,
Marjono,
Alanindra Saputra,
Putri Agustina
65
DIVERSITY INDEX OF HOLOTHUROIDEA (ECHINODERMATA) AT
CASED TRADITIONAL GOLD MINING AREA, LAMPON BANYUWANGI
DISTRIC
………
Susintowati, Nurchayati. N
70
Diversity of Ophiuroids in Intertidal Zone of Porok and Kukup Beach Gunung
Kidul Yogyakarta
………...
Fibra Nuraeni, Donan Satria Yudha
75
Increasing of Soil Enzyme Activities by Addition of Yeast Extracted from
Semi-Solid Waste of Alcohol Industry
………
V. Irene Meitiniarti, Rully Adi Nugroho, And E. Maskito
79
Population Dynamic of Parasitic Plant
Viscum
Articulatum
Burm.F. in
Purwodadi Botanic Garden
………
Solikin
82
The Influence of Explant Sterilization Method and 2,4-Dichlorophenoxy Acetic
Acid (2,4-D) on The Callus Formation of Various Explants of Red Betel
(Piper
Crocatum)
………
Junairiah, Ni’matuzahroh,
Hery Suwito
87
“BORNEO PRIMA”, MANDARIN CULTIVAR FOR LOW A
ND WET AREA
FROM KALIMANTAN INDONESIA
……….
Titiek Purbiati, Arry Supriyanto
91
PUERARIN INHIBIT VASCULAR CELLULAR ADHESION MOLECULE-
1(VCAM-1) AND TUMOR NECROSIS FACTOR-
Α (TNF
-
Α) EXPRESSION
ON HUMAN UMBILICAL VEIN ENDOTHELIAL CELLS (HUVECS)
AFTER INDUCED BY LEPTIN
IN VITRO
………
M. Sasmito Djati, Retty Ratnawati,Satuman, Erly N. Aisyah, Ratna Semestiari,
Rasyad Indra
Sea Holy (Acanthus
Ilicifolius)
Viability Test on Heavy Metal: Lead (Pb) and
Cadmium (Cd)
………...
Rony Irawanto
February 12-13
2014
The 5 International Conference on Global Resource ConservationBatu, East Java, Indonesia
|
1
Abstract— Seasonal climate variations is one of the maincauses of the diversity of crop production in Indonesia. Long drought and drought causing crop failures and food shortages that could affect agricultural production and food security. The indicator is a decline in acreage, harvested area and production declined sharply when climate irregularities. The magnitude of the impact caused by climatic irregularities cause we need a model that connects the harvested area with indicators of climate anomalies that can do the proper planning and anticipation measures early in order to avoid the risk of crop failure. Buru as the largest rice -producing areas in the provinces of Maluku course is expected to avoid the risk of crop failure in order not to disrupt the supply of rice. Data Collection and forecast rice production annually conducted by the Central Statistics Agency (BPS). BPS forecast model but has not entered a climatic factor, while the climate affect rice production. This research used the bootstrap aggregating MARS method to model anomaly rice harvested area with a weighted rainfall index to predict the error rate forecast harvested area and rice production. From the analysis using the best models of replication bagging MARS 150 times in the first period (January-April) and 200 times in second period (May-August) and third period (September-December) obtained an error rate forecast harvested area and rice production respectively by 5.72 % and 6.81 % .
Keywords— Anomaly Area harvested, weighted rainfall index, MARS, Boostrap Aggregating, rice production
I. INTRODUCTION
ice is the main food for the people of Indonesia, which provides seasonal income and employment for rural communities. Rice production has increased since 1970, but the harvest is particularly vulnerable to climate variability of extreme events: El-Nino and La-Nina. In the event of the El - El-Nino rice production has decreased quite dramatically, as in 1991, 1994, and 1997. Similarly, in the La-Nina (1995) also decreased rice production [8].When the national rice supply is insufficient and a decline in production, the import policy is often done. The problem is the need to
forecast future production decline (extreme weather events), so the anticipation can be done. That requires models that accurately forecast rice production in order to support national food security. Data Collection and forecast national rice production every year conducted by the Central Statistics Agency and the Ministry of Agriculture. Forecasts made by the province were calculated based on time series data and the provinces are not based on the sum of the forecast district/city level. Production per province is obtained by multiplying the harvested area clean with a yield per hectare per unit of harvested area clean for every sub round (4 monthly: sub round 1 (January-April), sub round 2 (May-August), and sub round 3 (September-December) [5]. production and harvested area in a year (January to December) is obtained from the sum of production and harvested area for three sub round. Yield to each hectare is the yield each hectare in the form of tile results each unit of harvested area.
II. REVIEW OF LITERATURE
2.1 . MARS
MARS is an implementation technique popularized by [4] for solving regression problems with the aim of predicting the response variable values of a number of predictor variables. MARS is an approach to the development of Recursive Partitioning Regression (RPR) which still has the drawback that the resulting model is not continuous at the knots. MARS model is used to overcome weaknesses in the model generate the RPR is continuous at knots. In spline modeling, the first step is to determine the points of data or a change in the pattern of behavior is called the point knots. The selection of knots in MARS using forward and backward algorithms. The selection of the model using a forward step taken to get the maximum number of base functions with base selection criteria function is to minimize Average Sum of Square Residual. To parsimony concept (simple model) performed a backward step is selecting base functions of forward
Relationship Model Anomaly Harvested Rice
With a Weighted Rainfall Index in Buru Maluku
Using Bootstrap Aggregating Mars Methods to
Predict the Forecast Error Rates Harvested Area
and Rice Production
R
Kondo Lembang. F1), Loupatty. G2), and Talakua. M.W3)
1), 3)
lecture of Mathematic Department, Faculty of Mathematics and Natural Sciences,Pattimura University
2
The 5th International Conference on Global Resource Conservation
February 12-13
rd2014
2
|
Batu, East Java, Indonesia
stage by minimizing the value of the Generalized Cross - Validation or GCV [4].
The minimum GCV as a criterion for determining knots are as follows:
( )
(
( )
)
( )
2 1 21
ˆ
1
−
−
=
∑
=N
M
C
x
f
y
N
M
GCV
N i i M i whereM
: The number of base functions( )
M
C
: The number of parameters in the model =trace (B(BTB)-1BT)+1B : matrix of base function
N
: The number of datai
y
: Value of the response variable( )
i Mx
fˆ
: Estimated value of the response variable onM
base functions.From forward and backward, MARS models obtained as follows:
( )
∑
∏
[
(
( ))
]
= = +−
+
=
M m K k km m k v km m mt
x
s
a
a
x
f
1 1 , 0ˆ
where 0a
: main of base functionm
a
: coefficients of m-base functionsM
: maximum of base functionm
K
: degree of interactionkm
s
: ± 1(km)
v
x
, : independent variableskm
t
: Point knots of independent variables(km)
v
x
,Algorithms for MARS models are as follows:
1. Starting with a simple model involving only constant base functions.
2. Finding space of base functions, for each variable and for all knots are possible, and add it to minimize the prediction error.
3. Repeat steps 2 to obtain a model that has maximum complexity.
Finally, in the last stage, the trimming procedure is applied in which the base functions are not significantly removed to obtain the minimum GCV.
2.2. Bagging Mars
Bagging method was first used by Breiman (1994). Bagging is used as a tool to form a more stable classifier. Bagging predictors is a method to generate multiple versions of a predictor and use it to aggregate predictors. Multiple versions of the bootstrap replication is formed by a set of data.
Defined a set data £ consists of
(
y
n,
x
n)
,
n
=
1
,
K
,
N
wherey
a numerical responseor a class label. If x the input is then
y
predicted byϕ
(x,£), whereϕ
(x,£) is a predictor. To gain a better predictor performed bootstrap replication {£k} isthen called {
ϕ
(x,£k) }. Performed totally B-times ofbootstrap replication so that {£(B)} from £ where {£(B)} resampling with replacement and established predictors of {
ϕ
(x,£(B)}.Bagging MARS algorithm is as follows.
1. Taking bootstrap n samples of set data £ with n- repetitions to each aggregate variables in each observation.
2. MARS modeling sets data £B bootstrap sample results.
3. Test the model generated in step 2.
4. Repeating steps 1-3 as much as B-times (bootstrap replication).
5. Obtain the best model.
6. Forming bagging MARS models of the average of each parameter at each sampling to B-times.
To obtain better results then the bootstrap replication is done as much as possible.
2.3. Weighted rainfall index and anomalies Harvested Rice
Weighted rainfall index (weighted rainfall index: WRI) developed in Australia by Stephen, et al (1994). This index is compiled based on monthly rainfall data is weighted. WRI which can be used in the modeling is that the WRI weighted system has been modified by Sutikno (2008). The modification is written as follows.
dard s t D t D t
L
LT
R
WRI
tan * , ,=
where,∑
==
m j j j D tR
A
A
R
1 * , ,∑
==
m j jA
A
1 Description: * ,D tR
: Area weighted rainfall Regional weatherforecast region (DPM) / DPM revision in the region/district/city
m : a large area of DPM
j
A
: Total area of j- DPMt
LT
: Plant area at t-monthdard s
L
tan : standard area for rice crops in the regionalj : DPM regional (1,2,3, ..., m)
t : Months (1, 2, ..., 12)
D : Regional
Model anomalies rice harvested area to each period (AnLPp)
with a weighted rainfall index (WRI) is as follows. AnLPpi = WRI1i + WRI2i + WRI3i + WRI4i
From the equation above three equations obtained for each of the following.
AnLP1i = WRI1i + WRI2i + WRI3i + WRI4i
AnLP2i = WRI5i + WRI6i + WRI7i + WRI8i
AnLP3i = WRI9i + WRI10i + WRI11i + WRI12i
February 12-13
2014
The 5 International Conference on Global Resource ConservationBatu, East Java, Indonesia
|
3
i
= 1, 2, 3,..., n (n is the number of observations)p = 1, 2, 3 (Period)
AnLP1 = harvested area Anomaly in first period
(January to April)
AnLP2 = harvested area Anomaly in second period
(May to August)
AnLP3 = harvested area Anomaly in third period
(September to December)
WRI1, ..., WRI4 indicates a weighted rainfall index first
until the fourth month in a first period (WRI1 = in
January, WRI2 = in February, WRI3 = in March, WRI4
= in April).
WRI5, ..., WRI8 indicates a weighted rainfall index first
to fourth month in a second period (WRI5 = in May,
WRI6 = in June, WRI7 = in July, WRI8 = in August).
WRI9, ..., WRI12 indicates a weighted rainfall index first
to fourth month in a third period (WRI9 = in September,
WRI10 = in October, WRI11 = in November, WRI12 = in
December).
III. METHOD OF ANALYSIS
Methods of data analysis performed in this study can be explained as follows.
1 . Identification of data include the identification and the relationship between WRI and AnLPp that can
be shown on the scatter plot.
2 . To model based anomaly harvested area weighted rainfall index for the data in- sample using the bagging MARS method with the following stages.
In MARS models for the first sets data
- Determine the maximum base functions
- Determine the maximum number of
interactions
- Determine the minimum number of
observations between knots
- Determine the number of degrees of freedom
Getting the best MARS models for the initial set of data based on the value of the smallest MSE and GCV.
Getting the significant variables of the best MARS models for the initial set of data. Perform bagging of the pair response variable and the predictor variables were significant from the best MARS models for data sets beginning with 50, 100, 200, and 250 bootstrap replication.
Perform MARS modeling on each sample-B bootstrap replication with the maximum number of base functions, the maximum amount of interaction and the minimum number of observations between knots is equal to the maximum number of base functions, the maximum amount of interaction and the minimum number of observations between knots at best MARS models for data sets beginning.
Getting MSE at each sampling B bootstrap replication.
Getting MSE bagging of the average MSE at each sampling to B
Bagging MARS model obtained is the best MARS models for the initial data sets. This is
because the value of changing each knots for each replication so that the estimated parameters can not be averaged.
3. Counting rice production forecast for the year to out -sample of data as follows.
Calculating forecast rice harvested area forecast results by adding the anomalous area harvested to each period results of MARS best modeling with an average area harvested during a certain period (2002 to 2008).
Suspect productivity to each period using the average productivity of the last five years (2007 to 2011).
Calculating forecast rice production to each period.
Pp = Prop x LPp dengan p = 1,2,3
Pp : forecast of production in the
p-period
Prop : forecast of productivity in the
p-period
LPp : forecast of harvested area in the
p-period
Getting forecast of rice production for the year which is the sum of the third period of the forecast.
Comparing rice production forecast results have been obtained with the MARS method with the actual value of rice production from BPS issued last three years (2009 to 2011).
IV. DISCUSSION
4.1. Identification Data
To model the relationship between the anomalous area harvested and predictor variables weighted rainfall index first identified patterns of relationship between the two. Identification of relationship pattern is very necessary to know the exact model in modeling the relationship between the two variables.
The 5th International Conference on Global Resource Conservation
February 12-13
rd2014
4
|
Batu, East Java, Indonesia
4.2. Relationship between the model anomaly rice
harvested to each Period (AnLPp) and weighted rainfall index (WRI) using Bagging MARS method.
In this study bagging MARS method is applied in modeling the anomalous area harvested per period as the response variable and weighted rainfall index as a predictor variable. The data used for modeling can be quite small, namely 10 years since year 2002 to year 2011, so it needs to be done in preparing the model resampling methods. Resampling method used is that a bagging sampling with replacement for a data set consisting of the response variable and the predictor variables (significant base functions).
4.2.1. Relationship between the model anomaly rice
harvested area (AnLP) and the weighted rainfall index (WRI) in first period using bagging MARS method.
A. MARS Model
Initial step of MARS modeling done by trial and error on the maximum base function (BF), maximum interaction (MI), minimum number of observations between knots or minimum observation (MO), and the number of degrees of freedom (DB) until an optimal model is obtained with the MSE and GCV minimum. [4] suggest a maximum number of basis functions of two to fourth times the number of predictor variables. Maximum interaction one, two, or three with a consideration if more than three will result in a very complex model. As well as the minimum distance between knots or knots as the minimum observation between 0, 10, 20, 50, and 100.
Table 1. Trial and Error Model MARS a first period in Buru
Table 1 shows the value of R2, MSE, and GCV in combination BF, MI, MO, and DB. based on the criteria of goodness of the model, selected models with minimum MSE and GCV. From the above results it can be concluded the model with a combination of BF = 8, MI = 1, MO = 0, and DB = 1 is the best model. The best MARS model is as shown below.
( )
1031
,
325
985
,
757
19439
,
66
4ˆ
x
BF
BF
f
=
+
−
where
From the best MARS models can be interpreted that each increase of one unit of the base functions 1 (BF1)
can increase rice yields broad anomalies in the period 1 at 985.757 if weighted rainfall index in January (WRI1)
more than 0.088 mm, with a base of other functions that go assumed to be constant in the model. Meanwhile, for each increase of one unit of the base function 4 (BF4)
can reduce anomalies rice harvested area of 9439.66 a
first period if the weighted rainfall index in February (WRI2) of less than 0.251 mm with base other functions
are included in the model held constant. The next best model obtained from two predictor variables were entered into the model, which is a weighted index of rainfall in February (WRI2) and weighted rainfall index
in January (WRI1) based on the relative variable
importance table. Percentage of contribution weighted rainfall index in February (WRI2) and weighted rainfall
index in January (WRI1) are shown in Table 2 below.
Table 2. Percentage of contributions of each variable in the first period
Variable Contribution
WRI2 100 %
WRI1 57,711 %
B. MSE calculations on models of bagging MARS
MARS modeling of the data sets obtained MSE Value in the first period is 544,216.122. To minimize the error variance performed on the data resampling. Table 3 below shows the results for the first period bagging MARS in Buru.
Table 3. Results of bagging MARS in first period
Bootstrap replication
average value of MSE
Decrease in the value of MSE
25 times 19511,6 524704, 522
50 times 3566,25 540649,872
100 times 3993,14 540222, 982
150 times 1538,90 542677, 222
200 times 2413,91 541802,212
Table 3 gives the smallest MSE value of the information obtained during the boostrap replicate as much as 150 times. thus it can be concluded that the best results obtained in the replication boostrap bagging as many as 150 times. Bagging models can lower the MSE value of the data model that is equal to the initial set of 544216.122 be 1538.90 or in other words bagging can reduce the value of MSE of 542677.222 of the initial data sets.
4.2.2. Relationship between the model anomaly rice harvested area (AnLP) and the weighted rainfall index (WRI) in second period using bagging MARS method.
A. MARS Model
Trial and error to BF, MI, MO, and DB MARS modeling in second period are shown in Table 4. Table 4. Trial and Error Model MARS a second period in Buru
BF MI MO DB R2
MSE GCV 8 1 0 1 0.261 637497.059 1147494.92
8 1 0 2 0.088 637497.059 1416660.57 8 1 0 3 0.088 637497.059 1416660.57 12 1 0 1 0.261 637497.059 1147494.92 12 1 0 2 0.088 637497.059 1416660.57 12 1 0 3 0.088 637497.059 1416660.57 16 1 0 1 0.261 637497.059 1147494.92 16 1 0 2 0.088 637497.059 1416660.57 16 1 0 3 0.088 637497.059 1416660.57 From Table 4 it is seen that the best MARS model is a combination of BF = 8, MI = 1, MO = 0, and DB = 1. It can be seen from the MSE and the smallest GCV among others, are respectively 637497.059 and 1147494.92 so the best MARS model is as shown below.
( )
566
,
237
1654
,
87
1ˆ
x
BF
f
=
−
+
where
BF MI MO DB R2 MSE GCV
8 1 0 1 0.507 544216.122 1523805.55
February 12-13
2014
The 5 International Conference on Global Resource ConservationBatu, East Java, Indonesia
|
5
This model can be interpreted that each increase of oneunit of the base functions 1 (BF1) can increase rice
yields broad anomaly in second period for 1654.87 if weighted rainfall index in August (WRI8) more than
0.22 x 10⁻⁷ mm, on the base of other functions in the model are held constant. Furthermore, Table 5 looks only variable weighted rainfall index in August (WRI8)
are included in the model. So important variable scores for weighted rainfall index in August (WRI8) worth
100%, which means the variable weighted rainfall index in August has a dominant influence on anomalous rice harvested area in second period (May-August).
Table 5. Percentage of contributions of each variable in the second period
Variable Contribution
WRI8 100 %
B. MSE calculations on models of bagging MARS
The best MARS models between anomalous rice harvested area weighted rainfall index in second period provide information that model has a MSE is 637,497.059, with a significant predictor variables are weighted rainfall index in August (WRI8). Table 6
below shows the average MSE in second period. Table 6. Results of bagging MARS in second period
Bootstrap replication
average value of MSE
Decrease in the value of MSE 25 kali 13521,9 623975,159 50 kali 15068,9 622428,159 100 kali 7378,52 630118,539 150 kali 4284,14 633212,919 200 kali 3017,05 634480,009 Table 6 provides information that bootstrap replication earned 200 times average value of the smallest MSE is 3017.05, So based on the above results it can be concluded that the results obtained by bagging the best with an average value of the smallest MSE is a bootstrap replicate as much as 200 times. With replication as much as 200 times, bagging can reduce MSE of the initial set of data models is 637497.059 be 3017.05 or in other words bagging can reduce the value of MSE of 634480.009 from the initial set of data models.
4.2.3. Relationship between the model anomaly rice
harvested area (AnLP) and the weighted rainfall index (WRI) in third period using bagging MARS method.
A. MARS Model
Table 7 gives information based on that value the smallest MSE and GCV is combination of BF=8, MI=1, MO=0, and DB=1. So that model with the combination is the best model. This model is shown below.
( )
2355
,
804
24391
,
732
2ˆ
x
BF
f
=
−
Where
(
) (
)
< − ≥ = − = 141 , 0 , 141 , 0 141 , 0 , 0 141 , 0 , 0 max 9 9 9 9 2 WRI if WRI WRI if WRI BFTable 7. Trial and Error Model MARS a third period in Buru
BF MI MO DB R2
MSE GCV
8 1 0 1 0.761 453362.558 816052.711
8 2 0 1 0.749 453362.558 858437.928 8 3 0 1 0.749 453362.558 858437.928 12 1 0 1 0.761 453362.558 816052.711 12 2 0 1 0.749 453362.558 858437.928 12 3 0 1 0.749 453362.558 858437.928 16 1 0 1 0.761 453362.558 816052.711 16 2 0 1 0.749 453362.558 858437.928 16 3 0 1 0.749 453362.558 858437.928 From the best model can be interpreted that each increase of one unit of the base function 2 (BF2) can
reduce anomalies rice harvested area in the period 3 of 24391.732 if weighted rainfall index in September (WRI9) of less than 0.141 mm, with bases other
functions assumed to be constant in the model. Later in the third period, based on table 8 weighted rainfall index in September (WRI9) contributes 100%, which means
the variable weighted rainfall index in September to have a dominant influence on anomalous rice harvested area in the third period.
Table 8. Percentage of contributions of each variable in the third period
Variable Contribution
WRI9 100 %
B. MSE calculations on models of bagging MARS
The best MARS models between anomalous rice harvested area weighted rainfall index for the third period provides information that the model has a MSE is 453362.558 significant predictor variables are weighted rainfall index in September (WRI9). Table 9 below shows the average MSE results of bagging MARS in third period.
Table 9. Results of bagging MARS in third period
Bootstrap replication
average value of MSE
Decrease in the value of
MSE
25 kali 11418,2 441944,358
50 kali 9452,84 443909,718
100 kali 3224,57 450137,988
150 kali 1213,38 452149,178
200 kali 961,970 452400,588
Table 9 provides information that the bootstrap replication earned 200 times the average of the smallest MSE value is 961.970, so it can be concluded that the results obtained by bagging the best with an average value of the smallest MSE is a bootstrap replicate as much as 200 times . With replication as much as 200 times, bagging can reduce MSE of the initial set of data models for 453362.558 be 961.970 or in other words bagging can reduce the value of MSE is 452,400.588 from the initial set of data models.
4.3. Rice Production forecast
The 5th International Conference on Global Resource Conservation
February 12-13
rd2014
6
|
Batu, East Java, Indonesia
area was obtained from the sum of the forecast anomalies rice harvested area with average area of rice crop. Of the best MARS models which have been obtained from the previous analysis can be calculated models forecast values for harvested area and production of rice to each period as shown in Table 10. Table 10. forecast Value of harvested area and rice
production to each period (using models MARS)
∆ = Actually – forecast
Table 10 provides information based on the results of the forecast error for the harvested area and rice production to each period look distinctly average prediction error rate is at least third periods respectively 14.61% and 14.36%, followed by a period of 2 each by 20.01% and 18.97%, as well as period 1 respectively 26.53% and 26.52%. BPS and the Ministry of Agriculture every year to data collection and forecast rice production in Indonesia is divided into three periods, namely from January to April, May to August, and September to December. Harvested area of each period obtained from the amount of harvested area in the first month until the fourth month in a period. Production and harvested area in one year (January to December) is obtained from the sum of production and harvested area for three periods. So the forecast results for the year and harvested area of rice production MARS models as shown in Table 11 below.
Table 11. Forecast value of harvested area and rice Production Harvested to each year
Based on the results of table 11 forecasts to each year for harvested area and rice production of MARS models can be calculated the average error rate forecast harvested area of rice by 5.72 % while the average error rate for rice production forecast is 6.81 %. Average error rate of rice production forecast issued BPS to each province ranged from 5% to 10 %.
V.CONCLUSIONS
Results of rice harvested area forecast MARS model in Buru has an error rate forecast is 5.72 %. As for rice production forecast results have an error rate of 6.81 %. In accordance with an error rate forecast of rice production issued BPS ranging between 5 %-10 %, it can be said rice production forecast errors in Buru is in accordance with the rate specified BPS.
REFERENCES
[1] Breiman. L, Bagging Predictor. Technical report 421. Statistics department of the University of California, 1994.
[2] Efron. B. and Tibshirani. R.J, An Introduction to the Bootstrap, Chapman & Hall, Inc.,New York, 1993.
[3] Eubank. R. L, Spline Smoothing and Nonparametric Regression, Mercel Dekker, New York, 1988.
[4] Friedman. J. H, Multivariate Adaptive Regression Splines , Rev Tech Report 102, Department of Statistics Stanford University Stanford , California, 1990.
[5] Kartini. A. Y, Bagging MARS for Developing forecast Models of Anomalies Area Rice Harvested of Weighted Rainfall Index in Ngawi [ thesis ], Graduate Program, Sepuluh Nopember Institute of Technology, Surabaya, 2010.
[6] Sutikno, Statistical Downscaling GCM Outcomes and Utilization for Rice Production Forecasting (Disertation), Bogor, Graduate Program, Bogor Agricultural University, 2008.
February 12-13
2014
The 5 International Conference on Global Resource ConservationBatu, East Java, Indonesia
|
7
Abstract— The high rate of mortality is caused of cancerdisease due to it is effect of uncontrolled growth of cells and mutations. It effects many research to be conducted for early detection of the desease. One of them is a study and analysis of the molecular level is done by combining molecular biology, mathematics and informatics which is known as bioinformatics. A method in the field of informatics that can be used to find the pattern of Deoxyribonucleic Acid (DNA) sequence databases as a constituent amino acids of the p53 gene is called Sequential Patterns Mining Discovery. This method is a process of extracting data to generate knowledge about the series of events that has the appearance of a certain frequency. This research is proposed PrefixSpan algorithm to discovery the patterns due to it has a high performance in computation time. The test is implemented using several threshold, such as minimum support (minimum frequent of sequence in the whole transaction) and sequence length in each transaction database. It takes from DNA sequence databases of cancer patients in each the same exon. The test result is obtained patterns or motifs of DNA sequences for the patients. The performance measure shows that the average support is high and stable in the range of 0.8. This number means that the frequent of thus pattern is high. Another performance measure is lift ratio which has average value more than 1 . This value shows that the generated patterns have high relationship and dependency.
Keywords— cancer, bioinformatics, DNA, sequential
pattern, PrefixSpan
I. INTRODUCTION
ANCER is classifed as mallignant and deadly disease. Generally, it is caused of gene mutation, i.e. p53 and it effects to change of p53 protein sequence [1]. This protein consists of a combination of 20 amino acids which are synthesized by ribosomes are
formed based on the genetic code of the
Deoxyribonucleic Acid (DNA). If the DNA is mutated, then the protein composition will be incorrect. Continuously, it is effect to variety of diseases and disorders such as cancer. Therefore, early detection can be conducted by analizing of protein sequence in the blood test. The most frequently altered gene of P53 or TP53 mutations is found in human cancers. There are 30,000 somatic mutations of various cancer types in TP53 database which is collected over 20 years. Recently, the methodology of sequencing cancer genome impacts on the healing and data management
[2]. According Soussi, p53 mutation analysis of the pattern has become essential to investigate the cause of cancer. His test result shows that infrequent of gene mutation is associated with the normal activity of the p53 protein [2].
The high rate of mortality which is caused by cancer, it makes early detection of this disease. A field that is expected to provide his role is bioinformatics. This field is a knowledge discipline that combines the study of molecular biology, mathematics and information technology (IT). It is defined as the application of computational tools and analysis to capture and interpret molecular biology data . Molecular biology itself is also an interdisciplinary field in molecular level of life sciences [3]. Bioinformatics has a very important role, including the data management for molecular biology, especially DNA sequences and has huge volume of genetic information. One of IT field that is used to find the DNA patterns of cancer patiens is Sequential
Pattern Discovery. Sequential pattern discovery is a part
of data mining task that generates knowledge about the series of events that have a frequency of occurrence that exceeds a specified threshold value [4]. The pattern is expected to use as biomaker of cancer disease. This research is proposed PrefixSpan algorithm to discovery its pattern of DNA sequence database. This algorithm is a method of Sequential Pattern Discovery which has high performance of computational time [5].
II. SEQUENCING GENOME
DNA sequencing is a process of determining three million nucleotide bases order which consist of adenine, guanine, cytosine and thymine (A, T, G ,C) in a DNA molecule. However, sequencing genome is the determination of the nucleotide sequence of DNA bases in the genome or in the body of an organism . Sequencing results are expressed in the form of a sequence of letters nucleotide bases in particular DNA, for example AGTCCGCAGGCTCGGT. Sequencing genome is always compared to coding process, whereas the sequencing process is not only defining a code, but also analogous genome sequence of letters from a mysterious language. It has an important and specific meaning.
Sequential Pattern Discovery of
Deoxyribonucleic Acid (DNA) for Cancer
Patients Using PrefixSpan Algorithm
Lailil Muflikhah 1*), Ilham Yuliantoro 1), and Widodo 2)
1)
Program of Information Technology and Computer Sciences
2)
Faculty of Mathematics and Natural Sciences
1, 2)
Brawijaya University, Malang, Indonesia
*)
The 5th International Conference on G
Furthermore, the sequence alignment is of setting two or more sequences so that the similarities can be detected. Sequence align interpolated (usually with the sign "-") s columns contain characters that are identic between the sequences. Here is an exa alignment of short sequences of DNA different DNA, "ccatcaac" and "caatgggc indicates a match or matches betwee sequences) are shown in Fig. 1.
Fig. 1. Matching two sequences
The mismatch in alignment is assoc mutation, but the gap (the sign "-") is asso insertion or deletion. In addition, sequence also used to find similarity in sequence data
III. DATA MINING
Data mining is a method of multiplying obtain the hidden information. Defining a w data mining [7]:
• It is an untrivial decomposition of potential information implicitly. • It is mining and analysis by an
semi-automatic utility from huge patterns that have meaning. • Data mining is also part of the
discovery in databases (KDD) Briefly, there are two methods of da implement the role, include [6]:
• Prediction Method
It is using some variables to pred values or future values of other var
• Method Description
It seeks human-interpretable patte explain certain data.
3.1. Sequential Pattern Discovery
Sequential pattern mining is a data mining generates knowledge about the sequence o have an occurence frequency that exceeds value [4]. Sequential pattern is a derived pa association rules, because both indicate the between events. The difference is that the pattern of events focused on finding patter that appear after another event, but associat pattern of events that occurently appear events.
3.2. PrefixSpan Algorithm
PrefixSpan (Prefix-Projected Sequent
Growth) is a development approach th algorithm to search for sequential patter PrefixSpan will seek frequent sequences of and then develop the sequences by adding by one. As a result, the additional sequenc
n Global Resource Conservation
February 12
is the process the sequences lignment line is such that the tical or similar xample of the NA from two gcaac" (the "|" een the two
ces
sociated to the ssociated to the ce alignment is databases.
ng the data to a wide range of
on of dataset into
n automatic or ge data to find
the knowledge
data mining to
predict unknown variables.
attern that can
ing process that of events that ds the threshold patten from the the relationship the sequential tterns of evennt iation rules is a ppear with other
uential Pattern that uses an tern sequences. of the elements elements one uence is still the
previous sequence. This way is not generate and test for candidates. The PrefixSpan algorithm is shown in Fig. 2
Fig. 2. Pseudocode of PrefixSpan Alg
3.3. Evaluation
In order to know the performance of syat some measurements such as support, conf ratio and accuration rate.
• Support
It is probability of frequent itemset transaction. It is ratio of transaction of an itemset as shown in Eq. 1[4].
∩
(1)
• Confidence
It is measurement which shows rela two items conditionally. Confidenc 2.[4].
! "!, → %
Where:
• & ∪ = the number of transactions
• & = the number of transaction
• Lift ratio
Lift ratio is a measure to know constructed rule of sequential algorithm. The value of lift ratio is unlimited. It can be defiined as below
- If lift ratio value is less means that rule antacedent negative of rule consequent. - If lift ratio value is equal to is frequent but it is independ - The others, if lift ratio value then it means that the rule
Input: sequence database, minimum Output: A complete set of sequent Method: Call prefixspan({},(),S). Subroutine: Prefixspan(α,l, S|α)
Parameter: α: suatu seqential pat
length α,
S|α: projected database, if α ≠()
then sequence database is S
Method:
1. Scan S|αonce, find set frequ
so that:
a. b can be combined to las
α to construct sequentia
b. <b> can be added to α fo squential pattern
2. For each item b is appear, a
constructing a sequential pa
output α’;
3. For each α’, construct α‘ pr
database S|α’, and call Prefi
l+1, S|α’).
uary 12-13
rd2014
not necessary to he pseudocode of 2 [5].
lgorithm
yatem, there are confidence, lift
et in whole ion which consists
].
( ) * +
elation between nce is stated is Eq
% )∪+ % ) (2)
of itemset in all
of antacedent in
w the strength of l pattern mining is between 0 and elow: [8]
s than 1, then it nt will be effect to
nt.
to 1, then the rule ndent.
lue is more than 1, le antacedent will
m support tial pattern .
ttern, l:
(); if it is not
uent itemset,
st element from al pattern; or or constructing
add to α for
attern α’, and
rojected
February 12-13
2014
The 5 International Conference on Global Resource ConservationBatu, East Java, Indonesia
|
9
be effect to positive of rule consequent. It isrecommended value.
The formula of lift ratio is stated in Eq. 3 and Eq. 4.
,- !" ! ! "!, , → % +( (3)
. 123/ 0 ** / 0 * (4) where:
& = the number of consequent in transaction m = the number of transaction
IV. METHODOLOGY
The research is conducted to find the pattern of DNA sequence for breast cancer patients. In the inial state, it is required to prepare data set of DNA sequences database, including some threshold, such as sequence length and the minimum support. Then, it is applied PrefixSpan algorithm to find the sequence pattern. In order to know the strength of pattern, it is evaluated by finding support, confidence and lift ratio values.
The sequence pattern procedure using Prefix Span algorithm is shown in Fig. 3. The initial step is the sequence numbering, which is based on transaction id and sorted by length of string. The next step is reading the database. Get the DNA sequence patterns and calculate how long a frequency of occurrence that satisfies the minimum support. The next step, the search space is based on its prefix and to find the projected database as well as the sequence pattern. Find a subset of the sequence pattern and to count its frequency. If the frequency of occurrence is greater than or equal to the minimum support, then it is added a postfix to the previous prefix. Repeat these steps recursively until there is no longer a subset of pattern sequences found.
The 5th International Conference on Global Resource Conservation
February 12-13
rd2014
10
|
Batu, East Java, Indonesia
V. Experimental Result and Analysis
In the experiment, it is used DNA sequence database which is taken from 7th exon of ten humans as is shown in Table 1. The Exon is a subset of DNA sequence.
Table 1. Ilustration of DNA sequence database (Homo sapiens breast cancer anti-estrogen resistance 3 (BCAR3),
transcript variant 4, mRNA
Furthermore, the interface of application program is shown as in Fig. 4.
Fig. 4. Interface of Sequential Pattern Discovery Aplication Program of DNA Sequence of Cancer Patients
5.1. Experimental Result
There are several thresholds which are used such as minimum support and sequence length. As a result, it is found various patterns. As illustration, it is given minimum support count=7 and sequence length=10
which is applied to 7th exon of human#1, then the resul is as shown in Fig. 5.
<aac><gtt><ggt><ggc><gct><ctt><cgt><cgc><cct><gtac><agtc><gt gc><ctac><actc><ctgc><atcc><gatc>
<agcc><accc><catc><gacc><gtcc><cacc><ctcc> Fig. 5. A sequencial pattern result of DNA patients
A pattern is <aac> or a a c which is shown in Fig.5. It means that there is pattern which is composed from sequence a is followed by a and the latest is c. This pattern is occured at least seven times in each ten sequences or transactions of the DNA sequence.
5.2. Dicussion and Analysis
In order to know performance of the system, it is evaluated based on measurement of support, confidence, and lift ratio. First, the test is applied to the training data which results several DNA sequential patterns of 7th exon for human #1, human #2, human #3, human #4, and human #5. There are two evaluation scenario of data training patterns, such as various minimum support and sequence length.
Fig.6. Performance measure of DNA sequence for human #1 (by various minimum supports)
Fig 7. Performance measure of DNA sequence for human #2 (by various minimum supports)
Fig. 8. Performance measure of DNA sequence for human #3(by various minimum supports)
0 0,2 0,4 0,6 0,8 1 1,2
2 3 4 5 6 7 8 9 10 11 12
P e rf o rm a n ce m e a su re Minimum support
Lift ratio Support confidence
0 0,2 0,4 0,6 0,8 1 1,2
2 3 4 5 6 7 8 9 10 11 12
P e rf o rm a n ce m e a su re Minimum support
lift ratio support confidence
0 0,2 0,4 0,6 0,8 1 1,2
2 3 4 5 6 7 8 9 10 11 12
P e rf o rm a n ce m e a su re Minimum support
lift ratio support confidence
Human
# DNA sequences
February 12-13
2014
The 5 International Conference on Global Resource ConservationBatu, East Java, Indonesia
|
11
Fig. 9. Performance measure of DNA sequence for human #4 (byvarious minimum supports)
Fig. 10. Performance measure of DNA sequence for human #5 (by various minimum supports)
The five graphs in Fig. 6 up to Fig. 10 show that the performance measurement including lift ratio and support of the constructed pattern tends to be stable and the best at minimum support in the range 6 and 11 on the sequence length 10. The both measurements almost close to 1. Also, for the confidence is always at 1. It means the resulted paterns have highly strength and corrrectness
Then, the second test is using various sequence length with the same minimum support = 7. After it is applied this scenario to five humans, the various patterns are obtain with the performance results as shown in Fig. 11 up to Fig. 15. Almost all graphs on the Fig. Show that lift ratio and support is stable and the best performance at the sequence length in the range 6 up to 12. However, the confidence value is not depend on the sequence length. It is always at 1.
Fig 11. Performance measure of DNA sequence for human #1 (by various sequence length)
Fig.12. Performance measure of DNA sequence for human #2 (by various sequence length)
Fig. 13. Performance measure of DNA sequence for human #3 (by various sequence length)
Fig. 14. . Performance measure of DNA sequence for human #4 (by various sequence length)
Fig 15. Performance measure of DNA sequence for human #5 (by various sequence length)
0 0,2 0,4 0,6 0,8 1 1,2
2 3 4 5 6 7 8 9 10 11 12
P e rf o rm a n ce m e a su re Minimum support
lift ratio support confidence 0 0,2 0,4 0,6 0,8 1 1,2
2 3 4 5 6 7 8 9 10 11 12
P e rf o rm a n ce m e a su re Minimum support
lift ratio support confidence
0 0,5 1 1,5 2 2,5
2 3 4 5 6 7 8 9 10 11 12 13 14 15 16 17 18
P e rf o rm a n ce m e a su re
Sequence length of DNA
support confidence 0 0,5 1 1,5 2 2,5
2 3 4 5 6 7 8 9 10 11 12 13 14 15 16 17 18
P e rf o rm a n ce m e a su re
Sequence length of DNA
support confidence 0 0,5 1 1,5 2 2,5
2 3 4 5 6 7 8 9 10 11 12 13 14 15 16 17 18
P e rf o rm a n ce m e a su re
Sequence length of DNA
support confidence 0 0,5 1 1,5 2 2,5
2 3 4 5 6 7 8 9 10 11 12 13 14 15 16 17 18
P e rf o rm a n ce m e a su re
Sequence length of DNA
support confidence 0 0,5 1 1,5 2 2,5
2 3 4 5 6 7 8 9 10 11 12 13 14 15 16 17 18
P e rf o rm a n ce m e a su re
Sequence length of DNA
The 5th International Conference on Global Resource Conservation
February 12-13
rd2014
12
|
Batu, East Java, Indonesia
VI. CONCLUSION
Sequential pattern discovery is a method in data mining task to find the pattern on DNA sequence database of patient’s cancer disease. By giving the threshold such as various minimum support and length of sequence, it is obtained the different sequence patterns. In order to know reliability of the system, it is used three performance measures, such as support, confidence, and lift ratio. The experiment results show that almost all the support value is closed to 1. It means that the probability of co-occurrence for sequence item in the pattern is high. Also, the confidence value is always 1.Furthermore, the lift ratio is almost always more than 1. This means that the patterns which consist of items are dependent each other. Therefore, the patterns can be used to define the DNA sequence characteristic of the patient’s cancer desease.
REFERENCES
[1] Pustai L., Lewis, C., & Yap, E. (1996). Cell Proliferation in Cancer- Regulation Mechanisms of Neoplastic Cell Growth. Oxford: Oxford University Press
[2] Thierry Soussi. 2011. TP53 Mutations in Human Cancer: Database Reassessment and Prospects for the Next Decade. Adv Cancer Res 110: 107-139
[3] C. Sander (2001) Bioinformatcs challenges in 2001. Bioinformatics 17, 1-2.
[4] Han, J., & Kamber, M. (2006). Data Mining: Concepts and Techniques (2nd ed.). San Francisco: Morgan Kaufmann Publishers
[5] Jian Pei, Jiawei Han, Behzad Mortazavi-Asl, Jianyong Wang, Helen Pinto, Qiming Chen, et al. (2004) “Mining Sequential Patterns by Pattern Growth: The PrefixSpan Approach”. IEEE Transaction on Knowledge and Data Engineering, vol. 16, nos. 11, pp. 1041-4347.
[6] Pei, Jiawei Han, Behzad Mortazavi-Asl, Helen Pinto, Qiming Chen, Umeshwar Dayal, et al. (2001) “PrefixSpan: Mining Sequential Patterns Efficiently by Prefix-Projected Pattern Growth,” Proc. 2001 Int’l Conf. Data Eng. (ICDE ’01), pp. 215-224
[7] Pang-Ning Tan, Michael Steinbach and Vipin Kumar. (2006). Introduction to Data Mining, Pearson Education
[8] Fomby, Tom. 2011. Association Rules (Aka Affinity Analysis or Market Basket Analysis). Departemen of Economics Southern Methodist University Dallas. Texas.
February 12-13
2014
The 5 International Conference on Global Resource ConservationBatu, East Java, Indonesia
|
13
Abstract—Investigation has been carried out to the
![Fig. 1. Eastern Part of Java, MBNP is Meru Betiri National Park East Java [18]. Samples were photographed with standard comparator](https://thumb-ap.123doks.com/thumbv2/123dok/274899.308684/65.612.96.293.54.193/eastern-java-betiri-national-samples-photographed-standard-comparator.webp)