African Journal of
Agricultural Research
Volume 10 Number 4 22January 2015
ABOUT AJAR
The African Journal of Agricultural Research (AJAR) is published weekly (one volume per year) by Academic Journals.
African Journal of Agricultural Research (AJAR) is an open access journal that publishes high-quality solicited and unsolicited articles, in English, in all areas of agriculture including arid soil research and rehabilitation, agricultural genomics, stored products research, tree fruit production, pesticide science, post harvest biology and technology, seed science research, irrigation, agricultural engineering, water resources management, marine sciences, agronomy, animal science, physiology and morphology, aquaculture, crop science, dairy science, entomology, fish and fisheries, forestry, freshwater science, horticulture, poultry science, soil science, systematic biology, veterinary, virology, viticulture, weed biology, agricultural economics and agribusiness. All articles published in AJAR are peer- reviewed.
Contact Us
Editorial Office: [email protected]
Help Desk: [email protected]
Website: http://www.academicjournals.org/journal/AJAR
Editors
Prof. N.A. Amusa
Editor, African Journal of Agricultural Research Academic Journals.
Dr. Panagiota Florou-Paneri
Laboratory of Nutrition, Faculty of Veterinary Medicine, Aristotle University of Thessaloniki, Greece.
Prof. Dr. Abdul Majeed
Department of Botany, University of Gujrat,India, Director Horticulture,
and landscaping. India.
Prof. Suleyman TABAN
Department of Soil Science and Plant Nutrition, Faculty of Agriculture,
Ankara University, 06100 Ankara-TURKEY.
Prof.Hyo Choi
Graduate School
Gangneung-Wonju National University Gangneung,
Gangwondo 210-702, Korea.
Dr. MATIYAR RAHAMAN KHAN
AICRP (Nematode), Directorate of Research, Bidhan Chandra Krishi
Viswavidyalaya, P.O. Kalyani, Nadia, PIN-741235, West Bengal.
India.
Prof. Hamid AIT-AMAR
University of Science and Technology,
Houari Bouemdiene, B.P. 32, 16111 EL-Alia, Algiers, Algeria.
Prof. Sheikh Raisuddin
Department of Medical Elementology and Toxicology,Jamia Hamdard (Hamdard University) New Delhi,
India.
Prof. Ahmad Arzani
Department of Agronomy and Plant Breeding College of Agriculture
Isfahan University of Technology Isfahan-84156,
Iran.
Dr. Bampidis Vasileios
National Agricultural Research Foundation (NAGREF), Animal Research Institute 58100 Giannitsa,
Greece.
Dr. Zhang Yuanzhi
Laboratory of Space Technology,
University of Technology (HUT) Kilonkallio Espoo, Finland.
Dr. Mboya E. Burudi
International Livestock Research Institute (ILRI) P.O. Box 30709 Nairobi 00100,
Kenya.
Dr. Andres Cibils
Assistant Professor of Rangeland Science Dept. of Animal and Range Sciences
Box 30003, MSC 3-I New Mexico State University Las Cruces,
NM 88003 (USA).
Dr. MAJID Sattari
Rice Research Institute of Iran, Amol-Iran.
Dr. Agricola Odoi
University of Tennessee, TN., USA.
Prof. Horst Kaiser
Department of Ichthyology and Fisheries Science Rhodes University, PO Box 94,
South Africa.
Prof. Xingkai Xu
Institute of Atmospheric Physics, Chinese Academy of Sciences, Beijing 100029,
China.
Dr. Agele, Samuel Ohikhena
Department of Crop, Soil and Pest Management, Federal University of Technology
PMB 704, Akure, Nigeria.
Dr. E.M. Aregheore
The University of the South Pacific, School of Agriculture and Food Technology Alafua Campus,
Editorial Board
Dr. Bradley G Fritz
Research Scientist,
Environmental Technology Division,
Battelle, Pacific Northwest National Laboratory, 902 Battelle Blvd., Richland,
Washington, USA.
Dr. Almut Gerhardt
LimCo International, University of Tuebingen, Germany.
Dr. Celin Acharya
Dr. K.S.Krishnan Research Associate (KSKRA), Molecular Biology Division,
Bhabha Atomic Research Centre (BARC), Trombay, Mumbai-85,
India.
Dr. Daizy R. Batish
Department of Botany, Panjab University, Chandigarh, India.
Dr. Seyed Mohammad Ali Razavi
University of Ferdowsi,
Department of Food Science and Technology, Mashhad,
Iran.
Dr. Yasemin Kavdir
Canakkale Onsekiz Mart University, Department of Soil Sciences, Terzioglu Campus 17100 Canakkale
Turkey.
Prof. Giovanni Dinelli
Department of Agroenvironmental Science and Technology
Viale Fanin 44 40100, Bologna
Italy.
Prof. Huanmin Zhou
College of Biotechnology at Inner Mongolia Agricultural University,
Inner Mongolia Agricultural University, No. 306# Zhao Wu Da Street,
Hohhot 010018, P. R. China, China.
Dr. Mohamed A. Dawoud
Water Resources Department,
Terrestrial Environment Research Centre,
Environmental Research and Wildlife Development Agency (ERWDA),
P. O. Box 45553, Abu Dhabi,
United Arab Emirates.
Dr. Phillip Retief Celliers
Dept. Agriculture and Game Management, PO BOX 77000, NMMU,
PE, 6031, South Africa.
Dr. Rodolfo Ungerfeld
Departamento de Fisiología, Facultad de Veterinaria,
Lasplaces 1550, Montevideo 11600, Uruguay.
Dr. Timothy Smith
Stable Cottage, Cuttle Lane, Biddestone, Chippenham, Wiltshire, SN14 7DF. UK.
Dr. E. Nicholas Odongo,
27 Cole Road, Guelph, Ontario. N1G 4S3 Canada.
Dr. D. K. Singh
Scientist Irrigation and Drainage Engineering Division, Central Institute of Agricultural Engineeinrg
Bhopal- 462038, M.P. India.
Prof. Hezhong Dong
Professor of Agronomy, Cotton Research Center,
Shandong Academy of Agricultural Sciences, Jinan 250100
China.
Dr. Ousmane Youm
Assistant Director of Research & Leader, Integrated Rice Productions Systems Program Africa Rice Center (WARDA) 01BP 2031, Cotonou,
African Journal of Agricultural Research
Table of Contents: Volume 10 Number 4 2 2 January, 2015
ARTICLES
Population growth and its environmental impact in Syria:
A case study of Lattakia region
161
Nazir Hassan and Vladimir Krepl
Effect of foliar application rates of Calcium and Boron on yield and
yield attributes of soybean (
Glycine max
)
170
Edleusa Pereira Seidel, Wanessa Aline Egewarth, Jeferson Tiago Piano
and Jonas Egewarth
Agribusiness model in rural community economic: Indonesia perspective
174
I Nyoman Gede Ustriyana
Response of onion (
Allium cepa
L.) to sowing date and plant population
in the Central Free State, South Africa
179
Gagopale Bosekeng and Gesine M. Coetzer
Evaluation of physical and physiological characteristics of seeds and
seedlings of physic nut genotypes
188
Franco William Novaes Dourado, Arlete da Silva Bandeira,
Everardes Públio Júnior, Manoel Xavier de Oliveira Junior and
Otoniel Magalhães Morais
Potassium fertilization of lettuce in potassium-rich Eutrudox soil
194
A. B. Cecílio Filho, G. D. Bonela, M. C. P. da Cruz, J. W. Mendoza-Cortez and
C. R. P. Toscano
Intake and some indicators of the metabolic status of native ewes
in pregnancy and supplemented in grazing system
200
Tairon Pannunzio Dias e Silva, Carlo Aldrovandi Torreão Marques,
Jacira Neves da Costa Torreão, Marcos Jácome de Araújo,
African Journal of Agricultural Research
Table of Contents: Volume 10 Number 4 2 2 January, 2015
ARTICLES
Possible role of calcium, phosphorous and magnesium shift in blood,
urine and calculi in calves affected by urolithiasis
207
Mohsin Ali Gazi, Mohmmad Aarif Khan, Dil Mohd. MakhdoomiI, Gazalla Siraj,
Shahid Hussain Dar and Abdul Qayoom Mir
Seed yield and agronomic performance of seven improved
cowpea (
Vigna unguiculata
L.) varieties in Ghana
215
Agyeman K., Berchie J. N., Osei-Bonsu I., Tetteh Nartey E. and Fordjour J. K.
Salmonella Enteritidis and Typhimurium in informally sold broilers
222
Ludmilla Santana Soares E Barros, João Guilherme Nobre Ribeiro and
Jaqueline Batista Caselli
Postharvest dehydration of Syrah grapes (
Vitis vinifera
L.) under controlled
temperature conditions with real-time monitoring of mass loss
229
Wesley Esdras Santiago, Barbara Janet Teruel, Rodolpho Cesar dos Reis Tinini
and Danil Galdino Figueredo
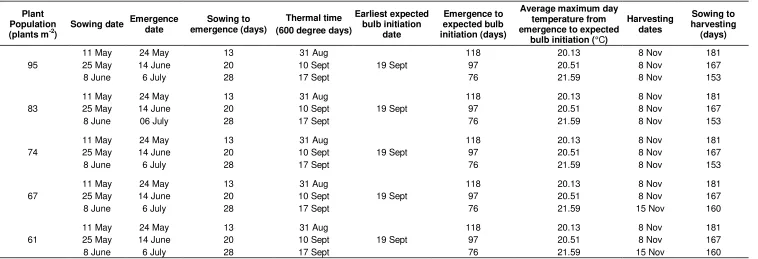
Supremacy of rice genotypes under aerobic condition for mitigating
water scarcity and future climate change
235
N. Sritharan, C. Vijayalakshmi, E. Subramanian and K. Boomiraj
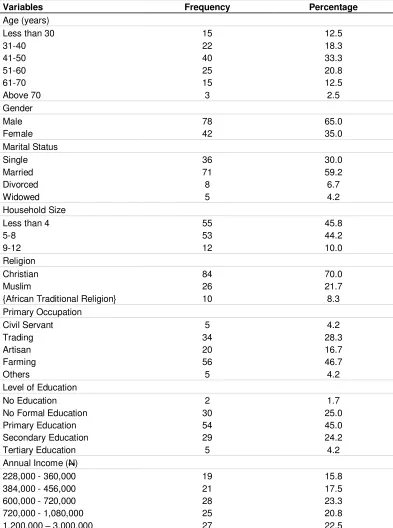
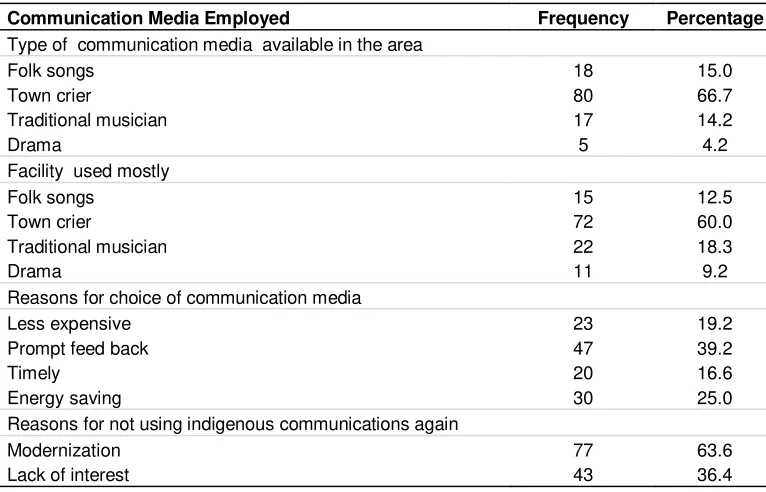
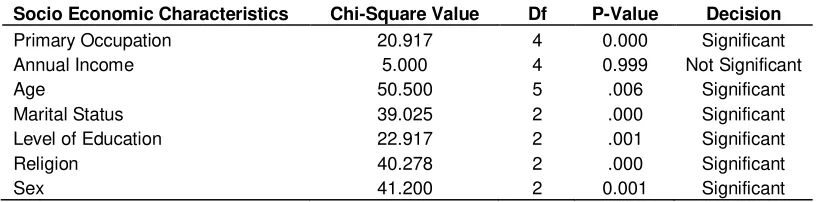
Potentials of indigenous communication media for agricultural information
dissemination in south-western Nigeria
244
Apata, O. M. and Toluwase, S. O. W.
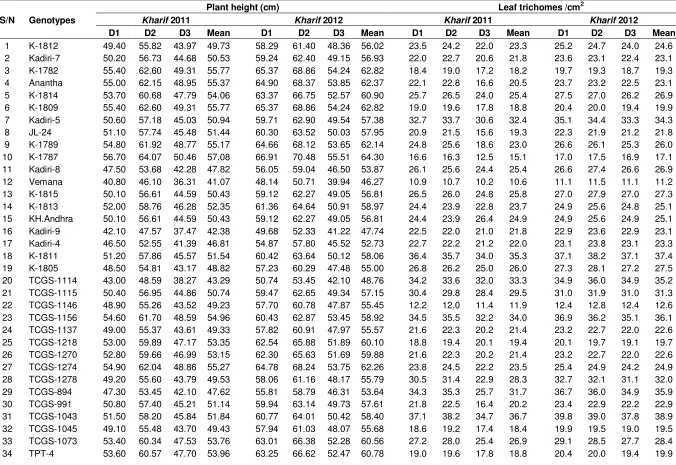
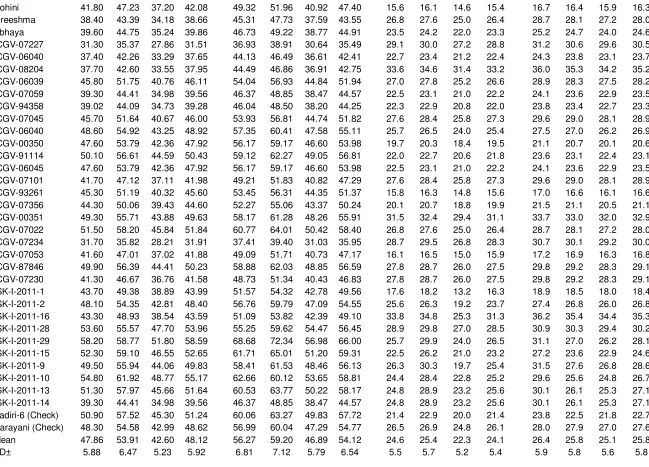
Influence of morphological traits on resistance of groundnut genotypes
for thrips
250
African Journal of Agricultural Research
Table of Contents: Volume 10 Number 4 2 2 January, 2015
Contribution of some ornamental plants to the socio-economic
development of urban household in Akure metropolis
264
Adeduntan, Sunday Adeniyi
Field experimentation based simulation of yield response of maize crop
to deficit irrigation using AquaCrop model, Arba Minch, Ethiopia
269
Yemane Gebreselassie, Mekonen Ayana and Kassa Tadele
Aggregation and organic matter content in different tillage systems
for sugarcane
281
Everton Martins Arruda, Risely Ferraz de Almeida,
Antonio Carlos da Silva Junior, Bruno Teixeira Ribeiro,
Adriane de Andrade Silva and Regina Maria Quintão Lana
Crambe meal in diets supplemented with enzyme complex solid state
fermentation (SSF) for Nile tilapia
289
Guilherme de Souza Moura, Marcelo Mattos Pedreira,
Eduardo Arruda Teixeira Lanna, Alcione Eneida Santos, Talita Andrade Ferreira
and Aldrin Vieira Pires
Stability analysis in Wheat: An application of additive main effects and
multiplicative interaction
295
Noorul Saleem, Mushtaq Ahmad, Rakash Vashnavi, Asifa Bukhari and
Zahoor Ahmad Dar
Oviposition strategy of
Sitophilus zeamais
Motsch. (Coleoptera: Curculionidae)
in relation to conspecific infestation
301
Vol. 10(4), pp. 161-169, 22 January, 2015 DOI: 10.5897/AJAR2014.9390
Article Number:EC539EF49657
ISSN 1991-637X Copyright © 2015
Author(s) retain the copyright of this article http://www.academicjournals.org/AJAR
African Journal of Agricultural
Research
Full Length Research Paper
Population growth and its environmental impact in
Syria: A case study of Lattakia region
Nazir Hassan* and Vladimir Krepl
Faculty of Tropical AgriSciences Czech University of Life Sciences Prague, Kamýcká 129, 165 21, Prague 6, Czech Republic.
Received 1 December, 2014; Accepted 9 January, 2015
This paper investigates and monitors the impact of population growth on the standard of living in the Lattakia region of Syria Arab Republic. It focuses on the effect of pollution on population growth in the region and how this affects the surface and groundwater resource. There has been symmetrical expansion of the agricultural and urban sectors in Lattakia as its population increased and this has caused negative effect on the water quality resource available in the region. For the purpose of this research, the region of Lattakia has been divided into four study areas; Firstly, Alsin River area, which is the main source of drinking water in the region, is designated as area (A1). While the east of Gable town is designated as area (A2), and area (A3) includes the main city of Lattakia and its countryside, and area (A4) is made up of the largest rivers in the costal basin. Chemical, biochemical and bacterial tests were carried out, and the results obtained shows the existence of chemical and bacterial contaminants and it was also observed that the surface and ground water in area (A1), which is the main source of drinking water in the region is polluted with bacteria Escherichia coli. Laboratory tests investigations carried out proved the existence of germs type E. coli in excessive concentration of bacteria from sewage, and high value of nitrate and nitrite ions in area A2 which are predominantly used for agricultural activities. The results from area (A3) and (A4) shows the existence of chemical and bacterial contaminations and the increase in the rates of pollution in area P1 (springs great north River Area) to the estuary area P2 (the estuary point the great north river in the sea) and the presence of a strong correlation between the number of inhabitants in the area of the river and increase in the rates and various types of pollution. This research was carried out just before the commencement of the crisis in The Syrian Arab Republic.
Key words: Lattakia, pollution, rain fall, great north river, nitrate, Escherichia coli, nitrite, biological oxygen demand (BOD).
INTRODUCTION
Population growth and rising demand for improve
standard of living in terms of agricultural, industrial and housing activities by human being has led to many global environmental problems (McMichael, 2000). Water
*Corresponding author. E-mail: [email protected]
162 Afr. J. Agric. Res.
pollution is one of the most significant problem caused by anthropogenic activities by man, due to his neglect of environmental rules (wastewater, spraying pesticide, used fertilizers in agriculture, remnants of the olive oil industry, and salinity of sea water intrusion (Owens et al., 2005).
In the region of Lattakia, in Syria, wastewater (domestic, industrial and run off) is dispose off by combined sewage collection system which is discharged at several coastal sites to the north and south borders of the city. Lattakia city lacks waste water treatment facility, and all the waste water produced in the city is discharged directly to the coastal zone near tourist attraction centres and this usually causes harm and endangers the safety and health of inhabitants living in these places and negatively impact both tourist and aquatic activities (Sabouh and Chahin, 1997).
The situation in the countryside and in smaller towns in the region is much worse, sewage network covers only 30% of households and ends in the next valley, home cesspools are built without compliance with prescribed standards and becomes a source of pollution of the surrounding waters. The geological formations in the study area, such as rains, flood issue and soil erosion has a great effect on the determination of the concentration of chemical electrolytes in water and fill dams. The presence of ammonium ions is linked to a large degree of sewage leakage. And the art of drilling in areas that are not connected to sewage networks (http://www.damasuniv.edu.sy/mag/farm/old/agri_pdf/200 2/18-1/kbeebo.pdf)
Microbial and biochemical tests carried out showed presence of intestinal bacteria, especially fecal coliforms (FC) at different levels of water bodies in many parts of Lattakia region, especially in the north great river estuary. This further increase the rate of pollution and contamination of water bodies in Lattakia, especially in areas prone to sewers and the rivers estuary. A good correlation was demonstrated between intestinal floras total coliforms (TC), Escherichia coli with FC In most
areas (Salman and Mualla, 2003;
http://www.arabscientist.org/english/page/369/).
Significant increase in cases of diarrhea and intestinal infections was registered in specific seasons and changes in the taste and smell of the water bodies were observed (Directorate of Environment, 2008).
With the cooperation of the Directorate of Environment, Directorate of Agriculture and the Department of Water Resources, the study and test plans were designed to specify the types and sources of pollution and their specifications in order to find cheap and adequate solutions to these issues, especially bacterial and microbial pollution( its gross) and chemical fertility. At first, water samples from four different locations were taken, these covered the region from south to north. And next samples were taken from four other points located from east to west of the north river.
STUDY AREA
Demography and human activities
Lattakia region forms the North West part of the Syrian Arab republic with an area of 2302 km2, and the population is over 1.200 thousand people before 2010. The total land mass of Lattakia is 1.24% of the total territory of Syria, and her population is 6% of the total population of Syria, and with a population density of 520
(minimum 21, maximum 9000 inhabitants/km2)
(Directorate of Environment, 2008). The population growth rate in Lattakia declined from 3.3% in the eighties of the last century to a current figure of about 2.2% (3 Winckler, Onn (ed.), 1998) (Figures 1 and 2). The region is divided into three zones: The first is the coastal plain with a width of 3-15 km and an altitude of 0-100 m, with very good fertile soil, living here is 60% of the total number of inhabitants of the area. The second zone is the plateau area with 100 to 400 m above sea level, this area is fertile and suitable for planting trees, such as citrus and olive trees, living here is 25% of the total number of inhabitants of the area .The third zone is the mountains and highlands, which is 400 to 1600 m, it has a milder fallout to the sea and forms a natural barrier against rainy clouds in the interior of state, living here is 15% of the total number of residents of the area (Directorate of Environment, 2008). There are intensive agricultural activities in the coastal areas, including 70,000 plastic greenhouses that led to excessive and uncontrolled use of fertilizers and pesticides. The most important agricultural crops in Lattakia come from olives and citrus (1.2 mil tons/year from citrus and 160 thousand tons olives oil from 87 million trees). The cultivation of large expanse of land of citrus plantations brings about the use of pesticide, which is used to prevent pest from the large agricultural investment (Directorate of Agriculture, 2006).
The number of dams on the rivers streams is 20, the storage capacity of the dams is about 600 million cubic meters, and this is mainly dedicated to the irrigation dams and Troy 56000 ha, these are mostly located in heights above 500 m (Directorate of Agriculture, 2006). 797 facilities is registered in Lattakia region and their distribution are as follows: 309 food establishments, chemical small factories, 292 Engineering Industries and 75 Textile Industries (Directorate of Environment, 2008).
Hydrology and human demand of water
Lattakia”s water supply comes from three main sources,
Hassan and Krepl 163
Figure 1. Population density in Lattakia
(http://www.geographic.org/maps/new2/syria_maps.html ).
Figure 2. Population growth in Lattakia (Syrian Central Bureau of Statistics, 2010).
for use is 1414 million cubic meters of which about 560 million cubic meters is being currently used. The usage is captured as follows; drinking water is 35 million cubic meters, irrigation is 525 million meters in Mkaab.aa and
the net surplus surface water is equal to 854 million cubic meters. The average annual runoff of underground water is 2830 million cubic meters, of which 1786 million cubic meters is not available due to its existence at a depth greater than 600 m. Only an average of 1044 million cubic meters runoff groundwater is available for use, of which only 478 million cubic meters is currently being used, 145 million cubic meters is used for drinking purpose, 273 million cubic meters is used for irrigation, and 60 million cubic meters is used for industrial purposes. Hence, there is a surplus of 566 million cubic meters groundwater in Mkaab.aa, from the foregoing, this area losses 586 million cubic meters by evaporation annually (Directorate of Agriculture, 2006). From the above, we find that the total available water resource, on average, each year is 2458 million cubic meters. Therefore, total runoff is 560 million cubic meters, of which groundwater flow is 478 million cubic meters. This gives a total surplus equal to 1420 million cubic meters in the basin (Figures 3 and 4).
164 Afr. J. Agric. Res.
Figure 3. Water consumption in Lattakia (Syrian Central Bureau of Statistics, 2010).
Figure 4. Water Map of Lattakia region (http://www.geographic.org/maps/new2/syria_m aps.html).
olive oil of 87 million trees, the increase in the planting of these fruit trees brings about more use of pesticides (Directorate of Agriculture, 2006).
Waste water production and requirements for cleaning units
Lattakia region decided sometime ago to build a 51 wastewater plant as a response to the increase of water pollution in the region, This was actualized as five plants were built, the largest one, is located 20 km east of Lattakia with a population of about 10,000. The other end of the sewerage network is linked directly to the estuary
(with 16 outlets in coastal areas) (Directorate of Environment, 2008). Currently, Lattakia city lacks waste water treatment facilities, and all the waste water produced discharge directly to the coastal area near tourist attractions which do harm and endanger the safety and health of inhabitants (Sabouh and Chahin, 1997). The countryside, where 70% of the population resides, houses are mostly equipped with cesspools, which do not correspond to basic sanitary conditions, which also has fatal consequences to the environment (Tameem, 2007) Sewage network covers 47% of total area at the countryside, In 2003, out of the 57 sewer line decided, only 27 was realized (Directorate of Environment, 2008).
METHODOLOGY
Four sections were chosen in Lattakia region namely; A1, A2, A3 and A4. The Alsen Basin area was designated as (A1). In this area contaminations in the water bodies were monitored and its relationship to the amount of rainfall values was investigated. In the Jableh area (A2). Values of bacterial and chemical pollutants in wells were compared before and after the establishment of the sewage site monitored. The main part of the experimental research was conducted in A3 and A4 (the north river basin) at four points, the first point (P1) was chosen directly upstream, the second point (P2) is located downstream, while (P3) and (P4) are located at the point of outflow of water from the Dam. Samples from area A2 and A3 and A4 were taken 6 times per year (6x/year) during the months of January, March, May, July, September, and November (1, 3, 5, 7, 9, 11) in the year 2009, 2010, and 2011. This was just before the commencement of the crises in Syria. Seasonal harvest of citrus and olive trees and rainy season were taken into consideration. The effects of rainfall on water pollution on the sites were also determined.
Measurements in area A4 (great north River) were taken to determine the kinds, level, and sources of pollution in the lake and river Basin (GNR), the relationships between human activities and high rates of pollution in the water from upstream to downstream were also determined, also the slope of the terrain corresponding with the flow of the river from the north-east to south-west was also taken into account (Figures 5 and 6).
The following pollution indicators in the four areas were observed throughout each season: (Water temperature, ph, Total hardness, Dissolved oxygen, microbiological, and nitrate and nitrite indicators). Some of these indicators were measured in the laboratory. And other measured on-site sampling, due to the fact that the sites were easily accessible and on-site inflow and outflow of water in lakes were observed, these qualities makes this points better locations for collecting samples for the research.
A digital thermometer was used to measure the water temperature, pH meter (GLI P53 analyzer) for pH measurement, (GLI D53 5600-DOS) and Winkler method was used for determining the values of oxygen demand. Also, samples to detect total fecal coliform and bacteria E. coli were obtained and taken to the laboratory; the chemical oxygen demand (COD) level was detected by using the measuring device Laviband ET108. The measuring Device to detect nitrate used was Nitrate sensor for lab IT-1201. The values of nitrite and nitrate were monitored. During the next bacteria measurement we concentrated on the presence of E. coli,
Entero-Staphylo-Bactria Bacilli in water due to the increase in the value reached during the first measurement.
Figure 5. Studing points in region Lattakia (http://www.g eographic.org/maps/new2/syria_maps.html).
Figure 6. Great north river scheme (Directorate of Agriculture, 2006).
performed in the laboratory of Tishreen University in Lattakia, which included counting the number of (FC). For qualitative and quantitative results, the following methods were used to detect bacteria, these include: multiplier tubes, membrane filtration, brushes on the casting dish, and the dish.
A thermometer of mercury was used to measure the temperature. Further a pH meter was used to determine the degree of acidity. These methods were adopted to measure the nitrite
Hassan and Krepl 165
anion to interact with stray Asalafanil acid amide in the middle of phthylamineAitelin de and Secretes composite Aso pink-N were also measured, and finally results in the diazo salt that reacts with N vaveth at wavelength 490 microns mg, and the ANOVA study was conducted using the statistical analysis of variance.
RESULTS AND DISCUSSION Area A2
In area A2 Temperature affects the density and viscosity of water and the rate of dissolution of gases and the speed of chemical and biological reactions and thus affects the self-purification process of water. Temperature of water in the well remained within normal limits, ranging from 12.1 to 14.3 in the study period, increase in the rates of nitrates was observed in some months, this increase coincided with rainfall and agricultural activity season and close values of datas were observed in the study of the well as shown in Figure 7. Bacterial contamination values fell in the second and third year of the study, the reason is due to the completion of the drainage network building as shown in Figure 8.
Area A3, A4
In area A3 and A4 the temperature of water in the river remained within normal limits, ranging from 11.8 in January to 29.3 August. The Dam water temperature remained at a depth of 30 cm from 11.4 to 13.5 in the winter and a significant difference in the water temperature was observed at the irrigation canal, that is 13°C in the winter and the surface dam recorded 30°C in the summer (Figures 9 and 10).
BOD values slowly rose between point P1 and point P4, and there was a large difference between points P1 and point P2 located at the mouth of the river leading to the sea, this is because the impact of the increase of human activities in lattakia city and water quality in river. The BOD value remained at acceptable limits in the Dam, although the downstream water recorded the highest concentration when the annual average was 8.56 mg/L while at the Dam and at the lake it has a recording of 4.85 and 2.1 mg/L in the river, which is the lowest value as shown in Figure 9. Minimum values of E. coli in the water were registered in the spring and, the maximum values exceeded the permitted standards in the downstream, this is as a result of rainfall and seasonal climatic conditions and human seasonal agriculture activities as shown in Figure 10. The values of E. coli in A2 during realization sewers and after was noted, it was observed to have reduced from a maximum value of 245 bacterial to a minimum of around 5 bacterial. Hence, the water was then safe for drinking, all round the whole year, as it is free from bacterial as shown in Figure 8.
166 Afr. J. Agric. Res.
Figure 7. NO3 value in wells area (A2).
Figure 8.E. coli value in wells area (A2).
Hassan and Krepl 167
Figure 10. E. coli levels (A3, A4).
Figure 11. The pH levels in (A3, A4).
following annual average values were recorded; 8.4 in the dam lake, 8.2 in the river, and 8 in the irrigation canal. The high value of pH in both the lake and the river is due to photosynthesis of water plants that consumes a large share of CO2 dissolved in water as shown in Figure 11,
minimum values of nitrates were registered in the irrigation canal and maximum values exceeded the permitted standards in the downstream, this is as a result of changes in climatic conditions and human seasonal agricultural activities as shown in Figure 12.
Figure 13 describes the results of laboratory tests to show the validity of water usage for human, values obtained proved the existence of germs of type E.coli and excessive concentration of bacteria from sewage in P2.
The results show that the pollution is due to a very large extent on human activities and the results also show that the water is safe for drinking in terms of chemical contaminants and not safe for drinking in terms of bacterial in area higher than 800 m. Results obtained down the river show that, the water is not safe for drinking in every right, in areas lower than 800 m.
Conclusion
168 Afr. J. Agric. Res.
Figure 12. NO3 levels in (A3, A4).
Figure 13. validity of water usage for human.
organic and chemical fertilizers. Water pollution in Lattakia as a result of the consequence of waste water constitutes more than 70% of the total pollution issues; also there is more presence of bacterial in water bodies, in the results for 2010 than in 2009, which arises as a result of the new network of wastewater treatment plants
landfills and agriculture activates.
Generally, the studies observed that the impact of pollutants increases with increasing of human activity, also rainfall was impact factor to spread of pollutants, it was not mentioned that the existence of the pollution was from nature sources. Through co-operation with competent authorities, it was identified that most kinds of pollutions in the region, is as a result of the absence of
basic environmental requirements (such as;
infrastructure, culture, care, and proper planning). Hence, it was very important in this study to monitor these environmental requirements, measures them and obtains results. The monitoring of the impact of the construction of wastewater treatment plants in area A3.
RECOMMENDATIONS
(1) Emphasis should be on sewage treatment outcomes and address the situation of landfills located within the protection ranges from secondary and tertiary pollutants in the study area.
(2) There should be reduction in the use of chemical fertilizers and pesticides on lands within the scope of agriculture area, and of the various classes of danger that is poses on groundwater protection and rationalization. (3) Rainwater should be harvested through the implementation of new rainwater harvesting techniques to be used for agriculture or groundwater recharge purposes. This would give an increase in available water resources, which means an additional increase in the amount of water available.
(4) Proper water management and development practices should be adhere to, most especially in sanitation and irrigation techniques. Implementing modern irrigation techniques and treated wastewater facilities means abundance of stable water supplies to the entire citizenry of Syria.
(5) There should be improved public awareness and participation in water projects at local, regional, and international levels, as this will eventually be a lasting solution to better sustainability and effective water conservation measures in the country. Also, renewable water resource management and utilization should be introduced in the school curriculum at primary, secondary and tertiary Education levels.
(6) Human resource development, critical knowledge and know-how transfer should always be in focus for renewable water projects development, project management, monitoring, evaluation, implementation and actualization in the country.
Conflict of Interest
The authors have not declared any conflict of interest.
Hassan and Krepl 169
REFERENCES
McMichael AJ (2000). The urban environment and health in a world of increasing globalization: issues for developing countries. Bull. World Health Organ. 78(9):1117-1126. PMid:11019460 PMCid:PMC2560839
Owens PN (2005). Fine‐grained sediment in river systems: environmental significance and management issues." River Research and Applications 21:693-717. http://dx.doi.org/10.1002/rra.878 Sabouh H, Chahin H (1997). Environmental Engineering (2), Tishreen
University publication, Lattakia, Syria. http://www.damasuniv.edu.sy/mag/farm/old/agri_pdf/2002/18-1/kbeebo.pdf
Salman M, Mualla W (2003). The utilization of water resources for agriculture in Syria: Analysis of current situation and future challenges." Erice International Seminars on Planetary Emergencies. PMCid:PMC1494836 http://www.arabscientist.org/english/page/369/ Directorate of Environment (2008). Water supply and sanitation in
Lattakia. 3 Winckler, Onn (ed.). Demographic developments and
population policies in Baʻathist Syria. ISBS, 1998.
http://www.geographic.org/maps/new2/syria_maps.html.
Syrian Central Bureau of Statistics 2010, The Statistical Abstract for 2010 shows, (statistical population), Statistical Indicators and National Accounts Statistics
Directorate of Agriculture (2006). Development of citrus cultivation in the Syrian Coast.
Bou-Zeid El, Mutasem El-F (2002). Climate change and water resources in Lebanon and the Middle East. J. Water. Resour. Plan. Manage. 128(5):343-355. http://dx.doi.org/10.1061/(ASCE)0733-9496(2002)128:5(343)
Vol. 10(4), pp. 170-173, 22 January, 2015 DOI: 10.5897/AJAR2014.9046
Article Number:D3B0E8B49659 ISSN 1991-637X
Copyright © 2015
Author(s) retain the copyright of this article http://www.academicjournals.org/AJAR
African Journal of Agricultural
Research
Full Length Research Paper
Effect of foliar application rates of Calcium and Boron
on yield and yield attributes of soybean (
Glycine max
)
Edleusa Pereira Seidel*, Wanessa Aline Egewarth, Jeferson Tiago Piano and Jonas Egewarth
State University of West Parana /CCA/PPGA, Agronomy, City of Marechal Candido Rondon, Pernambuco Street No. 1777, Zip Code 85960-000, Parana state, Brazil.
Received 5 August, 2014; Accepted 9 January, 2015
Foliar fertilizers of soybeans have been widely reported in many field trials. Although Calcium and Boron are essential nutrients for soybean, research results have shown that foliar application of nutrients has been contradictory. The objective of this study was to evaluate the soybean response by applying different foliar fertilizer rates Calcium and Boron on yield components and soybean yield applied at flowering (stadia fenologic R3). Two experiments were carried out during two successive seasons 2009-2010 and 2010-2011, in the Quatro Pontes, Paraná State, Brazil. The area used was managed in no-tillage system consolidated. The experimental was randomized complete blocks design (RCBD), with six replicates. The treatments consisted of applying commercial fertilizer on the basis of Calcium and Boron (10% Ca2+ and 0.5% of B). Foliar fertilizer containing Ca2+ and B was applied 30 days after germination, when the plants were at the R3 stage. Also, five rates of commercial product (0, 1.5, 2.5, 3.5 and 4.5 L ha-1) were applied. Analyzing the results, it was concluded that the application of the foliar fertilizer with Calcium and Boron, applied 30 days after germination did not affect yield components and soybean yield during successive seasons 2009-2010 and 2010-2011.
Key words: Glycine max,grain yield, fertilization.
INTRODUCTION
In recent years, Brazilian agriculture has resulted in successive increase in production. This performance is due to the technological development involving varieties, methods of pest control and management (Resende, 2004).
One of the technologies that allowed the increase in production was the use of foliar fertilizers, the same being composed of macronutrients and micronutrients. These products provide the rapid absorption of plant nutrients, serving as a complement to soil fertilization, providing the nutrients to plants in suitable time usually done before or
early flowering for annual crops (Bevilaqua et al., 2002) for preventing and correcting deficiencies (Motta et al., 2007). Currently there are several foliar fertilizers available in the market, being a formulation much used that contains as main elements Calcium and Boron.
Although Calcium is a macronutrient, its foliar application with Boron has been indicated for the soybean crop. The objective of the application is to increase fertilization of flowers and consequently increase productivity. The main function of Calcium in the plant is to operate in the formation of Calcium pectate,
*Corresponding author. E-mail: [email protected]
Seidel et al. 171
Figure 1. The period of 2009-2010 and 2010-2011 seasons.
present in the cell wall middle lamella, the fertility flowers and pollen tube growth (Faquin, 2005; Verrissimo et al., 2006; Epstein and Bloom, 2006).
Boron have important roles in sugar translocation, carbohydrate metabolism, flowering, activity of hormones (Marschner, 1995; Dechen and Nachtigall, 2006) and biological nitrogen fixation in soybean, acting as an activator of starch phosphorylase enzyme responsible for starch synthesis and seed reserve substances (Favarin and Marini, 2007).
Research shows that there are many differences in response to application of Calcium and/or Boron in soybeans. Many experiments showed an increase in productivity (Bevilaqua, et al., 2002; Souza,et al., 2008; Schon and Blevins, 1990) or physiological quality of seeds (Bellaloui et al., 2010), while others did not obtain beneficial effects in its use (Arantes et al., 2009; Pegoraro et al., 2008; Kappes et al., 2008; Silva et al., 2006; Macedo et al., 2002). It should be noted that the response of soybean fertilization with Ca2+ and/or B
varies with cultivar (Slaton et al., 2004; Souza et al., 2008). This study aims to investigate the effect of Ca2+
and B foliar application rates on yield and yield components of soybean.
MATERIALS AND METHODS
Two experiments were carried out during two successive seasons 2009-2010 and 2010-2011 in the property Mr. Jose Silverio Egewarth, located in the Quatro Pontes, Paraná State, Brazil. The site altitude is 430 m, geographical coordinates are 24° 43' latitude South and 54° 14' longitude west.
Soil was classified as “Latossolo Vermelho Eutroférrico”
(Embrapa, 2006) and Oxisol (Soil Survey Staff, 2006), with a clayey texture. The climate according to Köppen, is Cfa (humid subtropical with annual average temperatures ranging between 17 and 19°C and rainfall totals between 1200 and 2000 mm well distributed throughout the year and hot summers). The data of rainfall during the experiment in 2009-2010 and 2010-2011 seasons are presented in Figure 1. The area used is managed in no-tillage
system consolidated.
The chemical analysis of soil was done before the deployment, made from samples collected at a depth of 0.0 to 0.10 and 0.10 to 0.20 m, according Silva (2009). The soil analysis showed the following chemical characteristics: pH (KCl 1 mol L-1)= 5.36; P (Mehlich)= 5.67 mg dm-3; H+ Al (SMP 7.5)= 5.06; Al (KCl 1 mol L-1)= 0.00 cmolc dm-3; k (Mehlich)= 0.28 cmolc dm-3; Ca2+ (KCl 1 mol L-1)= 6.66 cmolc dm-3; Mg2+ (KCl 1 mol L-1)=2.30 cmolc dm-3; CTC= 14.40 cmolc dm-3; V%= 64.42; Cu= 28.50 mg dm-3; Zn=6.50 mg dm-3, Mn=188.00 mg dm-3 and B (barium chloride)= 0.25 mg dm-3.
The experimental design was a randomized complete blocks design (RCBD) with six replications. The treatments consisted of spraying a commercial product containing 10.0% Ca2+ and 0.5% B in five rates: 0, 1.5, 2.5, 3.5 and 4.5 L ha-1. This was applied by spraying with manual pressure capability of 0.6 MPa, equipped with fan nozzle empty cone, calibrated to a spray volume of 200 L ha-1, as recommended by the supplier. The foliar application of the product was performed 30 days after germination, when the plants were at the R3 stage, determined by the scale phenological Ritchie et al., 1994).
The soybean planting in seasons 2009-2010 and 2010-2011 was held in October, using drill Semeator PH8 in no-tillage system, and the seeds of the variety Coodetec 215. The spacing used was 0.45 m between rows. 16 seeds per linear meter were sown to a depth of 0.04 m. At sowing, 250 kg ha-1 of a chemical fertilizer 2-20-18 (N-P2O5-K2O) was used.
Each plot consisted of six rows 5 m long, comprising a total area of 324 m2. For evaluation, we picked up only the two central rows, discarding the ends (0.5 m) of each plot, which resulted in an area of 3.6 m2 per plot. Normal cultural practices of growing soybean were conducted in the usual manner followed by the famers of this district. At harvest a random sample from the two middle rows from each plot was taken to determine number of pods, number of grains per plant and 1000-seed weight, thereafter the area of all plot was harvested to determine seed yield/unit area and converted to seed yield/ha.
The data of the treatments were submitted to variance analysis, using the statistical software SAEG (Statistical Analysis System and Genetics) (2007).
RESULTS AND DISCUSSION
The results for pod number per plant, grains, number per pod, grain weights and productivity are shown in Table 1.
T
empera
ture
(°
172 Afr. J. Agric. Res.
Table 1. Effect of foliar application rates of Ca2+ and B on number of pods per plant, grains number, seed index and seed yield/ha of soybean in 2009-2010 and 2010-2011 seasons.
Rates (L ha-1) Number of pods per plant Number of grains per pod 1000 grain weights (g) Productivity (kg ha-1) Season 2009-2010
0 42.00ns* 2.44ns* 108.91ns* 3122ns*
1.5 41.43 2.45 109.28 2833
2.5 42.16 2.46 107.04 2985
3.5 45.23 2.43 108.58 2034
4.5 46.00 2.45 107.86 3122
CV 23.57 2.50 3.0 7.91
Season 2010-2011
0 48 2.15ns 124.16ns 3340ns
1.5 47 2.18 123.34 2971
2.5 53 2.20 123.94 3344
3.5 50 2.16 127.24 3386
4.5 57 2.15 211.66 3467
CV 16.60 2.94 12.65 8.63
ns- Not significant (p<0.05).
The yield obtained ranged from 2034 to 3122 kg ha-1, in the first season (2009-2010), and 2971-3467 kg ha-1, at
the second season (2010-2011), was considered a good yield for the region. One explanation for the application of Calcium and Boron has no significant effect on productivity is that soil fertility, associated with the history of the area, which has been cultivated in the no-tillage system, promoted adequate conditions for the development of soybean, resulting in good productivity (3122 and 3340 kg ha-1) for the treatment without foliar
fertilizer.
The number of pods per plant ranged from 41.43 to 46.00 (2009-2010 season), until 47 to 57 (2010-2011 season), and there was no significant difference between treatments (Table 1). According to Ross et al. (2006), an increase in this variable was expected; also, the application of Ca2+ and B can affect the number of
fertilized flowers and consequently the number of pods. Analyzing the data, the results showed no difference between treatments. The application of a commercial product containing 10.0% Ca2+ and 0.5% B at rates did not affect yield components and seed yield ha-1 of
soybean during 2009-2010 and 2010-2011 seasons. Other explanations for not obtaining significant effect on the application of Boron is that, although this element is an essential micronutrient for plants, some plants are more susceptible to their deficiency than others, and soybean is considered relatively insensitive to Boron deficiency (Ross et al., 2006).
Soil chemical such as pH and organic matter content and physical properties (texture) also influence the availability of Boron to plants and have likely contributed to getting inconsistent response to Boron fertilization
(Moraghan and Mascagni, 1991; Ross et al., 2006). Given this consideration, the chemical condition of the experimental area may have influenced the result, because the Ca2+ and B were 9.81 cmolc dm-3 and0.25
mg dm-3 respectively, and therefore suitable for culture. These chemical conditions, coupled with good management in no-tillage system, fostered conditions conducive to the development of culture and were able to meet the demand for soybeans with these elements resulting in a good yield on unfertilized control.
Work performed by Jamami et al. (2006), demonstrates that the application of Boron and Zinc in corn did not result in increased levels of foliar nutrients or productivity increases. The explanation is that the initial concentration of the B element and Zn were in the appropriate concentration for culture.
According to research conducted by Embrapa, foliar fertilization have shown significant responses only to Manganese (Mn), Cobalt (Co) and Molybdenum (Mo), which is why there is no recommendation for foliar fertilization with other nutrients (Staut, 2007).
Another factor that probably contributed to the achievement of these results was the precipitation, because the amounts of water available to plants influence the absorption of Ca2+ and B. Under conditions of water deficit, symptoms of deficiencies may occur (Dechen and Nachtigall, 2006) due to the fact that a probable reduction in the availability of micronutrients and foliar fertilization in this case is justified, as there would be a decline in productivity.
2011 seasons harvest (Figure 1). Of the two crops, none have water deficit, especially during flowering. Probably, the absorption of these elements was adequate.
Corroborating the results, Freeborn et al. (2001), Macedo et al. (2002), Silva et al. (2006), Andrade Moreira et al. (2008), Kappes et al. (2008), Pegoraro et al. (2008) and Arantes et al. (2009) did not find significant differences in the application with Ca2+ and/or B with
different concentrations.
Different results obtained in this experiment were observed by Ross et al. (2006). Fertilization with Boron promoted increase in production in three of four experiments from 4 to 130% in soybean, when compared to treatments without Boron, although the concentration of Boron present in the soil was deficient.
Conclusion
The application of foliar fertilizer rates on a commercial product containing Calcium and Boron and time of application considered in the work did not affect yield components and soybean seasons 2009-2010 and 2010-2011.
Conflict of Interest
The authors have not declared any conflict of interest.
REFERENCES
Andrade Moreira A, Leite RA, Prada NI (2008). Soybean cultivation (Glycine max (L.) merrill) when subjected to foliar fertilization with
Calcium. Electr. J. Res. Perquirēre 5:1-6.
Arantes RP, Cury TN, Leão FP, Maciel Junior VA (2009). Foliar application Calcium and Boron-based Calcium chloride and boric acid mixed on income tank for the evaluation of soybean seed. Nucl. Magaz. 6(2):117-122.
Bellaloui N, Reddy KN, Gillen AM, Abel CA (2010). Nitrogen metabolism and seed composition as influenced by foliar Boron application in soybean. Plant Soil 336:143–155. http://dx.doi.org/10.1007/s11104-010-0455-6
Bevilaqua GAP, Silva Filho PM, Possenti JC (2002). Boro and Calcium leaf application and yield components and physiological quality of soybean seeds. Rural Sci. 32(1):32-34.
Dechen AR, Nachtigall GR (2006). Micronutrients. In: Fernandes. M.S. (Ed.) Mineral nutriton of plants.Viçosa: Brazil. Soc. Soil Sci. 13:328-352.
Embrapa (2006). Empresa Brasileira de Pesquisa Agropecuária: Centro Nacional de Pesquisa de Solos. Braz. Syst. Soil Classif. P. 306. Epstein E, Bloom A (2006). Mineral nutrition of plants: principles and
perspectives. Londrina: Publisher Plant pp. 209-243.
Faquin V (2005). Mineral nutrition of plants. Lavras: UFLA/FAEPE, P. 186.
Favarin JL, Marini JP (2000). Importance of micronutrients for grain production. In: National Society of Agriculture, available in: www.sna.com.br.
Freeborn JR, Holshouser DL, Alley MM, Powell NL, Orcutt DM (2001). Soybean yield response to reproductive stage soil-applied nitrogen and Foliar-Applied Boron. Agron. J. 93:1200–1209. http://dx.doi.org/10.2134/agronj2001.1200
Seidel et al. 173
Jamami N, Theodoro Bull L, Corrêa JC, Rodrigues JD (2006). Response of maize (Zea mays L.) to application of Boron and zinc in soil. Acta Sci. Agron. 2(1):99-105.
Kappes C, Golo AL, Carvalho MAC (2008). Rates and timing of foliar Boron application on the agronomic characteristics and quality of soybean seeds. Sci. Agrária 9(3):291-297. http://dx.doi.org/10.5380/rsa.v9i3.11563
Macedo FB, Teixeira NT, Lima AM, Bernades CR, Freitas DJB, Oliveira RF (2002). Boron at planting and Calcium and Boron foliar fertilization on soybean. Ecosyst. Magaz. 27(1):87-89.
Marschner H (1995). Mineral nutrition of higher plants. London: Academic Press, P. 889.
Moraghan JT, Mascagni HJ (1991). Environmental and soil factors affecting micronutrient, deficiences and toxicities. In Mortvedt JJ (ed). Micronutrients in Agriculture. SSSA. pp. 371-426.
Motta CV, Serrat BM, Reismann CB, Dionísio JÁ (2007). Micronutrients in rock, soil and plant Curitiba. Author's edition, P. 246.
Pegoraro RF, Santos Neto JÁ, Silva IR, Fontes RLF, Faria AF, Moreira FF (2008). Soybean growth in response to Boron dosages, liming and soil texture. Sci. Agrotéc. 32(4):1092-1098.
Resende AV (2004). Fertilizing soybeans in the cerrado: micronutrients. Planaltina. DF. Embrapa Cerrados.
Ritchie SW, Hanway JJ, Thompson HE (1994). How a soybean plant develops. Ames: Iowa State University of Science and Technology Cooperative Extension Service.
Ross JR, Slaton A, Brye KR, Delong RE (2006). Boron fertilization influences on soybean yield and leaf and seed boron concentrations. Agron. J. 98:198-205.
SAEG (2007). System for Statistical Analysis. Version 9.1: Arthur Bernardes Fundation - UFV - Viçosa.
Silva TRB, Soratto RP, Bíscaro T, Lemos LB (2006). Foliar application of Boron and Calcium in the bean plant. Científica, Jaboticabal 34(1):46-52.
Silva FC (2009). Manual of chemical analysis of soils, plants and fertilizers. Embrapa Technological Information. P. 627.
Souza LCD, Sá ME, Carvalho MAC, Simidu HM (2008). Productivity of four cultivars of soybean due to foliar application of mineral fertilizer based on Calcium and Boron. J. Biol. Earth Sci. 8(1):37-44.
Slaton NA, DeLong RE, Dombek D, Ahrent D (2003). Evaluation of several soybean cultivars for differences in trifoliate-leaf Boron concentration. In N.A. Slaton (ed.) Wayne E. Sabbe. Arkansas Soil Fertility Studies. AAES Res. Series 515:66–69.
Staut LA (2007). Foliar fertilization with nutrients in soybean. Dourados: EMBRAPA/CPAO.
Schon MK, Blevins DG (1990). Foliar Boron applications increase the final number of branches and pools on branches of field-grown soybeans. Plant Physiol. 92:602-607. http://dx.doi.org/10.1104/pp.92.3.602
Vol. 10(4), pp. 174-178, 22 January, 2015 DOI: 10.5897/AJAR2013.8197
Article Number:F80046749661 ISSN 1991-637X
Copyright © 2015
Author(s) retain the copyright of this article http://www.academicjournals.org/AJAR
African Journal of Agricultural
Research
Full Length Research Paper
Agribusiness model in rural community economic:
Indonesia perspective
I Nyoman Gede Ustriyana
Department of Agribusiness, Faculty of Agriculture, University of Udayana, Indonesia.
Received 5 November, 2013; Accepted 9 January, 2015
The paper presents an approach model to community empowerment, particularly rural community that tends to have limited economic access with descriptive analysis. Literature study from research in scientific journals is determined to be the main method in collecting secondary data. Agribusiness-based community empowerment model considers local potency development as a primary component and the whole main factors as the determining components in the success of the approach.
Key words: Agribusiness model, empowerment, rural community economic.
INTRODUCTION
The concept of agribusiness based community empowerment
Community empowerment is an economic development concept which sums up the concept values. This concept
shows a new development paradigm, “people centered, participatory, empowering, and sustainable” (Chambers,
1995 in Kartasasmita, 1997; Baum, 2008). This concept is larger than simply fulfilling the basic need or providing mechanism in order to prevent the poor (safety net); the idea that is developed recently as an effort to seek alternative growth concepts in the past. This concept is developed by the effort of experts and practitioner in seeking of what Friedman (1992) stated as alternative
development, that demands ‘inclusive democracy,
appropriate economic growth, gender equality and intergenerational equity (Kartasasmita, 1997).
Community empowerment can be seen from three points as follows:
a) To create a situation or climate that enables community's potential to develop (enabling). Here, the introduction stating that each person/community has potential that could be developed As the starting point. It means that there is no one powerless; if it is so, human being has vanished. The empowerment function is now attempting to build power by encouraging, motivating, and rising their consciousness and potency, and also in the attempt to develop it;
b) To strengthen and empower the community potency (empowering). Therefore, some more positive steps, rather than simply creating ambience and climate, should be taken. The empowering includes real steps and is related to providing all inputs, as well as opening access to opportunities that would empower the community. Some of them are elevating the education level, health, and access to the sources of economic progress, such as capital, technology, information, job opportunities and market.
E-mail: [email protected]
The inputs of empowering are related to basic physical structures and infrastructures such as irrigation, roads, and electricity, as well as social infrastructures such as school and health service facilities, which can be accessed by the bottom layer of community, as well as the availability of funding, training and marketing institutions in the rural areas where the least empowered community live.
Special programs dedicated to the less empowered community are needed since the general programs that are available nowadays are not always accessible for this community.
Therefore, the most important thing is the increase of community participation in decision making process related to both personal and communal lives. Eventually, community empowerment is closely related to the stabilization, civilization, and democracy application. Friedman (1992, as cited in Kartasasmita, 1997) stated:
“The empowerment approach, which is fundamental to an
alternative development, places the emphasis on autonomy in the decision marking of territorially organized communities, local self-reliance (but not autarchy), direct (participatory) democracy, and
experimental social learning”.
c) To empower also means to protect. In the process of empowering, the weak should not ever become weaker due to their less empowerment in competing with the strong. Hence, protection and endorsement to the weak is basically needed in community empowerment concept. Protecting does not mean isolating and preventing interaction of the weak. Yet, it is more of the effort in preventing the imbalance competition and exploitation over the weak by the stronger side. Eventually, the sole purpose is to form independent and enabled community and build the ability to self-develop to sustainable better life.
This paper is trying to develop an approach model to community empowerment, particularly rural community that tends to have limited economic access. This approach is based on agribusiness, which is expected to become a new paradigm in building rural agriculture.
HISTORICAL BACKGROUND OF AGRIBUSINESS-BASED COMMUNITY EMPOWERMENT
Community empowerment is an effort to elevate the dignity of people who are today unable to unleash themselves from poverty and ignorance. Empowerment is to enable and to form an independent community. The empowerment concept occurs as a consequence of failure particularly the failures of economic development models in overcoming sustainable poverty and environmental problems, as well as expectation due to
Ustriyana 175
the development alternative which includes some democracy values, gender equality, and adequate economic growth.
AGRIBUSINESS-BASED COMMUNITY
EMPOWERMENT DEVELOPMENT
The section identifies many inputs such as fund, structure, and infrastructure allocated for the community through some development programs which shall be considered as stimulation to intrigue the acceleration of community's social-economy life. The main approach in the community empowerment concept is that the community is not becoming the object of any development project, yet as a subject of their own development effort. Therefore, according to that concept, the community empowerment must follow the following approaches:
1) Directional: This is popularly known as endorsement. Such attempt is aimed to overcome problem as needed; 2) Done by the community: This program must be directly involve or even hold by the targeted community. Involving the targeted community has its several purposes. It is to make the activity to be effective as it is suitable with the
community’s will and knowing their ability and needs.
Moreover, it is also created to increase the community ability by giving experience in designing, conducting, managing, and having responsibility in the effort of elevating their esteem and economy life;
3) Using group approach: Such approach is implemented to improve the social skill in overcoming poverty problems which are difficult to solve individually.
AGRIBUSINESS MODEL IN RURAL COMMUNITY EMPOWERMENT
In facing recent world situation, the economic policy must embrace a new paradigm which the community empowerment shall be the main concern. It is because most people live from the agriculture sector, and it is still
providing big contribution to the nation’s economic life.
Therefore, community economic empowerment also means improving agricultural economic development. The economic development must concern on backward linkage with the agriculture sector or primary sector, on the other hand, the forward linkage must concentrate on management, which will increase the added value, and good marketing so that the product will not be in vain. This agricultural development is known as agribusiness (Saragih, 2001).
176 Afr. J. Agric. Res.
Figure 1. Agribusiness model in rural community economic empowerment.
of a system includes (1) subsystem of production which means procurement; (2) production subsystem; (3) product management subsystem; (4) marketing subsystem; (5) institutional subsystem. To run the subsystem properly, based on the agribusiness demand, a rural community economic empowerment model based on agribusiness should be designed by involving several supporting institutions.
Several supporting factors of agribusiness-based rural economic development are (a) primary factor which consists of the role of university to actualize the local and environment potency; (b) main factor consists of
farmer/agribusiness executor, entrepreneur, banking institution, related institution, and local economic enterprise (Koperasi). The work sheet of primary factor and main factor in agribusiness based rural economic empowerment model is shown in Figure 1.
Primary factor: University, local potency, and environmental potency
University and college must be able to dig the potency of local natural resources, including land suitability, land SUPPORTING FACTOR
Potential Region Human Resources (Labour,
Skill)
Natural Resources (Land, Commodity, Environtment))
Role of University
PRIMARY FACTOR Socio cultural
Business
Infrastructure
GOAL
Improved living standards and rural welfare
Keterangan
Cash flow Good flow Service flow
Farmer
Crops
Horticulture Estate Fishery Livestock
Fund Provider
Formal
Banking Institution Non Banking Institution Non Formal
Related Institution (Policy and founding) Cooperation Department and PPK Industry and trade Department Agriculture Department
Entrepreneur
National Entrepreneur Local
Entrepreneur
MAIN FACTOR
C
O
O
P
E
R
A
T
IO
N
- Sorted- Processing - Labeliling - Storage
Tool production & Equipment
Buying
Marketing
- Market information
- Technology
Ag
ro
-In
d
u
st
availability, superior commodity, and human resources. Moreover, university is requested to dig the potency of rural community environment and any business opportunities that suits the socio cultural condition, including its availability of means and infrastructure. University must be able to be an independent institution in order to study and recommend, as well as control the rural agribusiness activity. The success of the role is the primary determining factor in the success of the model.
Main factor
Main factor is also called agribusiness partner factor in the rural area. This factor is a partnership synergy so that the agribusiness activity in a particular system could run well. There are five main factors involved in this activity: these are farmer, banking institution, economic enterprise (Koperasi) as a rural economic institution, related institution, and entrepreneur.
Farmer: Recent farmer’s problems are farmer’s
knowledge, capital, market assurance, structure, and infrastructure, as well as the will to do farming. To overcome these problems, the solution could be done together through an organization which has the same purpose; it is Koperasi or local economic enterprise. The farmers could start their agribusiness by using the
products of university’s research about their local
superior commodity, then the farmers could use Koperasi (local economic enterprise) as a fund provider. This kind of partnership will surely give some benefits such as
market assurance for the farmer’s product, hence
preventing the farmer from the price fluctuation risk.
Banking institution: This institution is loan provider for
the local economic enterprise (Koperasi) and the entrepreneur. The loan is through local Koperasi which already has agribusiness or agro-industry business. Koperasi demands for capital loan for the members (farmers) and loans for the Koperasi itself (as an agro-industry executor). The entrepreneur in this case will use the loan to develop their business.
Local economic enterprise: Koperasi shall function as an enterprise at the rural area as well as a mediator of production means and farming machine/tools to its members. Moreover, Koperasi also acts as the mediator of agricultural products produced by the members. Koperasi is also expected to manage the agricultural products (sorting, packing, and stocking) as needed by the market demand. Another service of Koperasi that shall be conducted is conveying market information to its members, so that the farmers have no doubt in performing agribusiness, as there is an assurance given by Koperasi that their products will be accepted. Syahza (2002) stated that the agro stat concept in the rural
Ustriyana 177
area could be developed through Koperasi. Investments done by the Koperasi is in form of transportation vehicles like farming machines (agro-industry). In addition, the farming machine shall be an investment on behalf of the
member’s name which means that each member has its
stock on Koperasi’s asset. Business fields that could be
conducted through Koperasi, according to Syahza (2003), are (1) supplying and distributing production tools such as farming tools and machines; (2) agricultural products; (3) agro-industry; (4) marketing the agricultural products; and (5) banking service, transportation and stocking.
Related institution: In this case, the related institution
involvement is represented by the government. It is expected that the involvement, specifically in term of policy and enrichment so that the rural community economic empowerment will be well implemented. The policy will relate to the terms and rules which provide mutual benefit among the agribusiness executors. Meanwhile, enrichments will be given to Koperasi and farmers, as well as the involvement of university or other professional institutions.
Entrepreneur: Entrepreneur here refers to the entrepreneur who owns capital and also trader (mediator, distributor, retailer). As a capital owner, they collaborate with Koperasi in providing production means and farming machines/ tools, and act as a technology supplier to support the rural agribusiness activity. The function as a trader is to distribute the agricultural products which have been through some process done by Koperasi that suit
the trader’s determined standard. Trader is also expected
to give market information through Koperasi, either about market purchasing power, market opportunity, or experts who are in charge in Koperasi, especially on production, marketing, and quality control.
CONCLUSION
The agribusiness model based on community empowerment is an approach that takes into account several components with each different roles and functions. Agribusiness-based community empowerment model considers local potency development as a primary component as well as the whole main factors as the determining components in the success of the approach.
Conflict of Interest
The author(s) have not declared any conflict of interest.
ACKNOWLEDGEMENTS
178 Afr. J. Agric. Res.
Science and Earth Observation, University of Twente and Ministry of Education and Culture (KEMENDIKBUD) scholarship from the Indonesian Government. Professor (Em.) Dr. J. L. van Genderen is gratefully acknowledged for his comments on the manuscripts.
REFERENCES
Baum F (2008). Foreword to Health promotion in action from l