POTENTIAL OF AGROFORESTRY AND PLANTATION
SYSTEMS IN INDONESIA FOR CARBON STOCKS:
AN ECONOMIC PERSPECTIVE
1Kirsfianti Ginoga, Yuliana Cahya Wulan, and Mega Lugina2
ABSTRACT
This paper investigates the carbon sequestration potential of several alternative agroforestry and plantation systems in Indonesia. It is shown how different agroforestry systems vary in their attractiveness in terms of carbon sequestration, returns to land and labour and employment potential. A twenty-year life cycle of coffee multi-cropping systems is compared to short-rotation timber plantations and to a forty-year life cycle of fruit trees such as mango, duku and durian.
Keywords: Agroforestry, Indonesia, Carbon Sequestration, Economic Analysis.
INTRODUCTION
The recent Marrakech accord confirmed two types of activities which are eligible for inclusion in a carbon market within the Clean Development Mechanism (CDM) of the Kyoto Protocol (KP), namely afforestation (which includes activities such as agroforestry), and reforestation (including industrial plantations). This paper describes several common agroforestry systems in Sumatra, Indonesia, and pays particular attention to the benefits and costs of each system and their potential to sequester and store carbon for mitigation purposes.
An understanding of the viability (economic, social and biological) and carbon sequestration potential of the land-use systems currently being practiced in Indonesia is necessary for investors, decision makers and developers to choose and implement the most appropriate land-use systems to meet the social, environmental and economic objectives of the Indonesian government.
THE SYSTEMS STUDIED
The agroforestry systems analysed in this study include three different coffee-based (Coffee robusta) multi-stratum agroforestry systems: timber-based, fruit-based and shade-based systems. The coffee data are from Sumberjaya, which is north of the Lampung Province, and were collected by Wulan (2002). The other types of agroforestry systems studied are based on data provided by Hendri (Rizaldi Boer’s staff) of Bogor Agricultural University (IPB) and include: durian (Durio zibethinus), macang (Mangifera spp.), mango (Mangifera indica), candle nut (Aleurites moluccana), pinang (Areca catecu) and rambutan (Nephelium lappaceum) agroforestry systems. In addition to these agroforestry systems, monoculture plantations such as Paraserianthes falcataria and meranti (Shorea spp) are evaluated. Most of these systems are located in the Jambi province of Sumatra.
1 Working Paper CC14, ACIAR Project ASEM 2002/066,
http://www.une.edu.au/febl/Economics/carbon/
2
Coffee (Coffee robusta) multi-stratum agroforestry
systems
Most of the forested areas in Sumberjaya have been damaged or destroyed due to the expansion and encroachment of agricultural practices, primarily coffee gardens. The government’s efforts to rehabilitate state forests have resulted in increasing conflict between government forestry officers and people living in the forest frontier. Therefore, to prevent these conflicts, land-use systems that can meet the needs of people while simultaneously maintaining the environmental and biological functions of forests are needed. One such land-use alternative is the coffee multi-stratum agroforestry garden. This system covers about 130,000 hectares of land in Lampung (Fadilasari, 2000), and produces 60 per cent of Indonesia’s coffee exports. Coffee multi-stratum agroforestry systems are classified according to the tree species that dominates the system. For example, if the system is dominated by timber-producing tree species it is referred to as Timber-based multi-stratum system. If, however, the system is dominated by fruit-bearing species then the system is called a Fruit-based multi-stratum system. Finally, if the system is dominated by shade trees then it is referred to as a shade-based multi-stratum agroforestry system.
3
Figure 2. The profile of a fruit-based, multi-stratum coffee agroforest (Wulan, 2002)
4
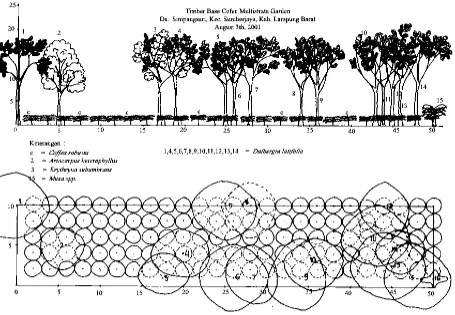
Timber-based, multi-stratum coffee agroforestry systems.
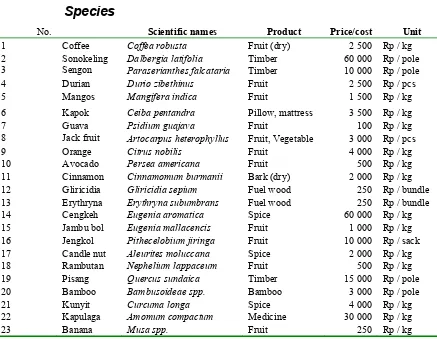
“Timber-based multi-stratum” refers to coffee agroforestry systems whose strata are dominated by timber-producing forest trees. In such cases most of the land is categorised as forest land. The dominant species found in these land-use systems include: sonokeling (Dalbergia latifolia) and sengon (Paraserianthes falcataria) which are species used for “regreening” by forest officers, and perennial trees such as jackfruit (Arthocarpus heterophyllus), erythryna and banana trees which cover other strata of the systems. Details of the species planted in this system are presented in Table 1.
Table 1. The species most commonly found in timber-based, multi-stratum coffee agroforests
No.
Species
Scientific names Product Price/cost Unit
1 Coffee Coffea robusta Fruit (dry) 2 500 Rp / kg
2 Sonokeling Dalbergia latifolia Timber 60 000 Rp / pole 3 Sengon Paraserianthes falcataria Timber 10 000 Rp / pole
4 Durian Durio zibethinus Fruit 2 500 Rp / pcs
5 Mangos Mangifera indica Fruit 1 500 Rp / kg
6 Kapok Ceiba pentandra Pillow, mattress 3 500 Rp / kg
7 Guava Psidium guajava Fruit 100 Rp / kg
8 Jack fruit Artocarpus heterophyllus Fruit, Vegetable 3 000 Rp / pcs
9 Orange Citrus nobilis Fruit 4 000 Rp / kg
10 Avocado Persea americana Fruit 500 Rp / kg
11 Cinnamon Cinnamomum burmanii Bark (dry) 2 000 Rp / kg 12 Gliricidia Gliricidia sepium Fuel wood 250 Rp / bundle 13 Erythryna Erythryna subumbrans Fuel wood 250 Rp / bundle
14 Cengkeh Eugenia aromatica Spice 60 000 Rp / kg
15 Jambu bol Eugenia mallacencis Fruit 1 000 Rp / kg
16 Jengkol Pithecelobium jiringa Fruit 10 000 Rp / sack 17 Candle nut Aleurites moluccana Spice 2 000 Rp / kg
18 Rambutan Nephelium lappaceum Fruit 500 Rp / kg
19 Pisang Quercus sundaica Timber 15 000 Rp / pole
20 Bamboo Bambusoideae spp. Bamboo 3 000 Rp / pole
21 Kunyit Curcuma longa Spice 4 000 Rp / kg
22 Kapulaga Amomum compactum Medicine 30 000 Rp / kg
5
Fruit-based, multi-stratum coffee agroforestry systems.
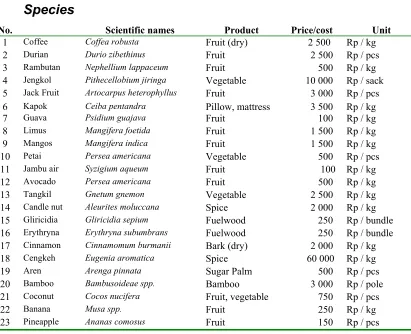
“Fruit-based multi-stratum” refers to the strata of coffee agroforestry systems whose strata are dominated by fruit trees such as jack fruit, guava, and avocado. The trees species most commonly found in this system are shown in Table 2.
Table 2. The tree species most commonly found in fruit-based, multi-stratum coffee agroforests (Wulan, 2002)
No.
Species
Scientific names Product Price/cost Unit
1 Coffee Coffea robusta Fruit (dry) 2 500 Rp / kg
2 Durian Durio zibethinus Fruit 2 500 Rp / pcs
3 Rambutan Nephellium lappaceum Fruit 500 Rp / kg
4 Jengkol Pithecellobium jiringa Vegetable 10 000 Rp / sack
5 Jack Fruit Artocarpus heterophyllus Fruit 3 000 Rp / pcs
6 Kapok Ceiba pentandra Pillow, mattress 3 500 Rp / kg
7 Guava Psidium guajava Fruit 100 Rp / kg
8 Limus Mangifera foetida Fruit 1 500 Rp / kg
9 Mangos Mangifera indica Fruit 1 500 Rp / kg
10 Petai Persea americana Vegetable 500 Rp / pcs
11 Jambu air Syzigium aqueum Fruit 100 Rp / kg
12 Avocado Persea americana Fruit 500 Rp / kg
13 Tangkil Gnetum gnemon Vegetable 2 500 Rp / kg
14 Candle nut Aleurites moluccana Spice 2 000 Rp / kg
15 Gliricidia Gliricidia sepium Fuelwood 250 Rp / bundle
16 Erythryna Erythryna subumbrans Fuelwood 250 Rp / bundle
17 Cinnamon Cinnamomum burmanii Bark (dry) 2 000 Rp / kg
18 Cengkeh Eugenia aromatica Spice 60 000 Rp / kg
19 Aren Arenga pinnata Sugar Palm 500 Rp / pcs
20 Bamboo Bambusoideae spp. Bamboo 3 000 Rp / pole
21 Coconut Cocos nucifera Fruit, vegetable 750 Rp / pcs
22 Banana Musa spp. Fruit 250 Rp / kg
6
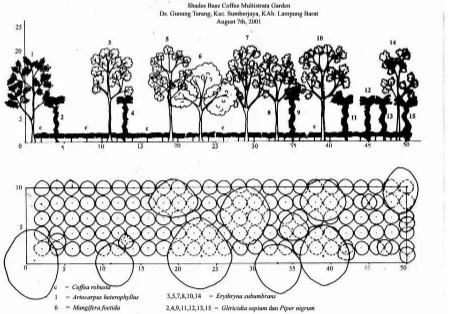
Shade-based, multi-stratum coffee agroforestry systems.
“Shade-based, multi-stratum” refers to coffee agroforests whose strata are dominated by shading trees such as Gliricia sepium, Erythryna subumbrans and Leucaena leucocephala. In such cases most of the garden is considered a young established garden rather than a forest. Trees found in this system are presented in Table 3.
Table 3. The tree species most commonly found in shade-based, multi-stratum coffee agroforests (Wulan, 2002)
No. Species Scientific names Product Price/cost Unit
1 Coffee Coffea robusta Fruit (dry) 2 500 Rp / kg
2 Durian Durio zibethinus Fruit 2 500 Rp / pcs
3 Mangos Mangifera indica Fruit 1 500 Rp / kg
4 Kapok Ceiba pentandra Pillow, mattress 3 500 Rp / kg
5 Guava Psidium guajava Fruit 100 Rp / kg
6 Jack fruit Artocarpus heterophyllus Fruit, Vegetable 3 000 Rp / pcs
7 Petai Parkia speciosa Vegetable 500 Rp / pcs
8 Avocado Persea americana Fruit 500 Rp / kg
9 Cinnamon Cinnamomum burmanii Bark (dry) 2 000 Rp / kg 10 Gliricidia Gliricidia sepium Fuel wood 250 Rp / bundle 11 Leucaena Leucaena leucocephala Fuel wood 250 Rp / bundle 12 Dadap Erythryna subumbrans Fuel wood 250 Rp / bundle
13 Pepper Pepper nigrum Spice 15 000 Rp / kg
14 Chilli Capsium frutescens Vegetable 4 500 Rp / kg
15 Papaya Carica papaya Fruit 100 Rp / pcs
7
Sengon plantation (Paraserianthes falcataria)
Paraserianthes falcataria (sengon), is grown in both community forests and state timber plantations. Community forests comprising sengon were developed in 1950 (Saiban, Sylviani and Effendi, 1994). In 1989 the Ministry of Forestry, initiated a community-based afforestation program based primarily on sengon trees. In addition to increasing wood supply, this program also aimed to increase land productivity, provide additional wood for industry and generate employment. Sengon wood is usually used for packaging, furniture, and building construction. Sengon’s leaves are sometimes also used as fodder for goats.
The sengon’s life cycle is usually no longer than 15 years because this is when root rot sets in. In this system, sengon wood is harvested in year 8 and is managed as a monoculture timber plantation. The input requirements for a sengon plantation are presented in Table 4.
Table 4. The input requirements and outputs of an Paraserianthes falcataria plantation
INPUTS
Amount
Seedlings (package/ha) 1
Fertilizers 0 Labour (pd/ha/year)
Sowing 2
Planting 17
Maintenance 17
Monitoring 10
Harvesting wood 384.4
OUTPUTS
8
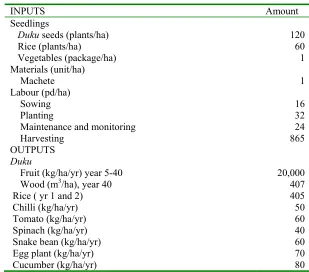
Duku agroforestry (Lansium domesticum)
Lansium domesticum (Duku) is widely distributed in Indonesia and is usually referred to as a “fruit tree”. Duku fruit is very popular in the province of South Sumatra because of its sweet taste and large size. The wood of the Duku tree is characterised as durable, strong, elastic and very suitable for building construction (ICRAF, 2000). In Indonesia Duku is grown in and around villages (kampungs). It does not require intensive cultivation and maintenance. In this analysis Duku is planted with other food crops (rice and vegetables) for the first three years. Detailed input requirements and outputs for a typical Duku agroforestry system are shown in Table 5.
Table 5. The input requirements and outputs of a Lansium domesticum plantation
INPUTS Amount Seedlings
Duku seeds (plants/ha) 120
Rice (plants/ha) 60
Vegetables (package/ha) 1
Materials (unit/ha)
Machete 1
Labour (pd/ha)
Sowing 16
Planting 32
Maintenance and monitoring 24
Harvesting 865
OUTPUTS
Duku
Fruit (kg/ha/yr) year 5-40 20,000
Wood (m3/ha), year 40 407
Rice ( yr 1 and 2) 405
Chilli (kg/ha/yr) 50
Tomato (kg/ha/yr) 60
Spinach (kg/ha/yr) 40
Snake bean (kg/ha/yr) 60
Egg plant (kg/ha/yr) 70
9
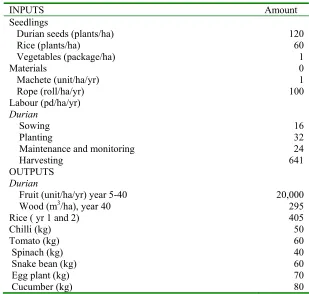
Durian agroforestry (Durio zibethinus)
Durio zibethinus (durian) is one of most popular fruits in Indonesia. It is widely distributed in Indonesia and is mostly planted in drylands and gardens. Durian wood can be used for construction, furniture, cabinets, fittings, panelling, partitioning, plywood, chests, boxes, wooden slippers, low-quality coffins and ship building (Prosea, 1995). However, its use is generally limited to building construction and packaging. The inputs and outputs of an agroforestry system comprising durian, rice and vegetables are listed in Table 6.
Table 6. The inputs for, and outputs of, a hectare of Durio zibethinus
INPUTS Amount Seedlings
Durian seeds (plants/ha) 120
Rice (plants/ha) 60
Vegetables (package/ha) 1
Materials 0
Machete (unit/ha/yr) 1
Rope (roll/ha/yr) 100
Labour (pd/ha/yr)
Durian
Sowing 16
Planting 32
Maintenance and monitoring 24
Harvesting 641
OUTPUTS
Durian
Fruit (unit/ha/yr) year 5-40 20,000
Wood (m3/ha), year 40 295
Rice ( yr 1 and 2) 405
Chilli (kg) 50
Tomato (kg) 60
Spinach (kg) 40
Snake bean (kg) 60
Egg plant (kg) 70
10
Candle-nut agroforestry (Aleurites moluccana)
Candle nut is a fast-growing tree species and is therefore often planted as the main tree species in reforestation programs. The advantages of Candle nut are that it has few input requirements, it is able to grow in arid land, and it is a good pioneer species for reclaiming land left fallow after shifting-cultivation practices (Kalima, 1990). Farmers grow candle-nut for its fruit, for spices and for traditional medicines.
The Indonesian Bio-diesel Institute is planning to use the candle-nut fruit as an alternative source of bio-diesel. This is because candle-nut fruit yields oil which has similar characteristics to petroleum oil. This and its ability to grow quickly (and hence capture and store carbon rapidly) make candle nut a very attractive species for inclusion in agroforestry systems. The inputs and outputs for a hectare of candle nut intercropped with rice and vegetables are present in Table 7.
11
Macang agroforestry (Mangifera spp.)
Macang is the generic word that includes a number of different fruit trees. The wood of these trees is generally used for light construction, ceilings, door panels, interior finishing, floor boards, moulds, crates, good quality charcoal, gunstocks, veneers and plywood (Prosea, 1995). The inputs and outputs of a Macang agroforestry system are listed in Table 8.
Table 8. The inputs for, and outputs of, a hectare of Macang agroforestry
INPUTS Amount Seedlings
Macang seedlings (plants/ha) 120
Rice (plants/ha) 60
Vegetables (package/ha) 1
Fertiliser (kg/ha) 0
Pesticide (ltr/ha) 0
Materials (unit/ha/yr)
Machete 1
Labour (pd/ha/yr)
Sowing 16
Planting 32
Maintenance 24
Harvesting 532
OUTPUTS Macang Fruit (kg/ha/yr) year 5-40 20,000
Macang Wood (m3/ha), year 40 248
Rice ( yr 1 and 2) 405
Chilli (kg) 50
Tomato (kg) 60
Spinach (kg) 40
Snake bean (kg) 60
Egg plant (kg) 70
12
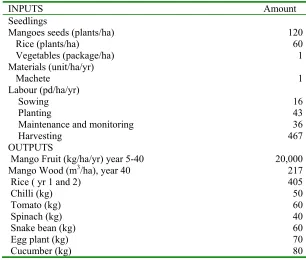
Mango agroforestry (Mangifera indica)
The mango tree is a tall, evergreen tropical tree that typically grows between 30-100 feet and has a dense and heavy crown. This species is very popular in Indonesia and is grown in both drylands and homegardens. People plant this species primarily for its fruit but its wood can also be used for firewood. The inputs for, and outputs of, a hectare of a mango agroforestry system are shown in Table 9.
Table 9. The inputs for, and outputs of, a hectare of a mango agroforestry system
INPUTS Amount Seedlings
Mangoes seeds (plants/ha) 120
Rice (plants/ha) 60
Vegetables (package/ha) 1
Materials (unit/ha/yr)
Machete 1
Labour (pd/ha/yr)
Sowing 16
Planting 43
Maintenance and monitoring 36
Harvesting 467
OUTPUTS Mango Fruit (kg/ha/yr) year 5-40 20,000
Mango Wood (m3/ha), year 40 217
Rice ( yr 1 and 2) 405
Chilli (kg) 50
Tomato (kg) 60
Spinach (kg) 40
Snake bean (kg) 60
Egg plant (kg) 70
13
Plantation of Pinang (Areca catecu)
The Pinang tree is grown for its fruit (betel nut), which is chewed as a mild stimulant. It is also a beautiful palm tree used for garden accessories. Traditionally many people have used the betel nut for cosmetic and health purposes. The nut contains large quantities of tannin and also contains garlic acid, fixed oil gum, a little volatile oil, lignin, and various saline substances. The input and output data relating to a hectare of Pinang grown with rice and vegetables are listed in Table 10.
Table 10. The inputs for, and outputs of, a hectare of Pinang plantation
INPUTS Amount Seedlings
Pinang seeds (plants/ha) 284
Rice (plants/ha) 60
Vegetables (package/ha) 1
Fertiliser (kg/ha) 54
Pesticide (ltr/ha) 1
Materials (unit/ha/yr)
Machete 1
Labour (pd/ha/yr)
Pinang
Sowing 14
Planting 35
Maintenance 32
Harvesting fruit 6.5
OUTPUTS
Pinang
Fruit (kg/ha/yr) year 5-40 1136
Rice ( yr 1 and 2) 405
Chilli (kg) 50
Tomato (kg) 60
Spinach (kg) 40
Snake bean (kg) 60
Egg plant (kg) 70
14
Rambutan agroforestry (Nephelium lappaceum)
Rambutan is one of the most popular fruits in Indonesia. Rambutan is a medium-sized tree that produces a red or yellow fruit, round to oval in shape, with hairs or tubercles on its skin. The flesh or aril is translucent and sweet. Most rambutan trees that have been propagated from seed are not true-to-type and are usually sour. Rambutan produces a small crop in June and July and a large crop between November and January. The inputs and outputs of Rambutan intercropped with rice and vegetables are listed in Table 11.
Table 11. The inputs for, and outputs of, a hectare of Rambutan grown with rice and vegetable
INPUTS Amount Seedlings
Rambutan (plants/ha) 120
Rice (plants/ha) 60
Vegetables (package/ha) 1
Fertiliser (kg/ha) 0
Pesticide (ltr/ha) 0
Materials (unit/ha/yr)
Machete 1 Labour (pd/ha/yr)
Sowing 16 Planting 32
Maintenance and monitoring 24
Harvesting 517 OUTPUTS Rambutan Fruit (kg/ha/yr) year 5-40 3000
Rambutan Wood (m3/ha), year 40 241.6
Rice ( yr 1 and 2) 405
Chilli (kg) 50
Tomato (kg) 60
Spinach (kg) 40
Snake bean (kg) 60
Egg plant (kg) 70
15
MEASURES OF SYSTEM PERFORMANCE
In this section, the performances of the agroforestry and plantation systems reviewed above are examined in financial and economic terms. The analysis undertaken follows the guidelines established by the Alternatives to Slash and Burn (ASB) program (ICRAF, 1998; Budidarsono et al., 2001). The private discount rate is set at 20% and the social discount rate at 15%. The prices of the major inputs and outputs used in the analyses are presented in Tables 12 and 13.
Table 12 presents the inputs and costs for multi-stratum coffee agroforestry systems. In general the three systems used similar amounts of labour and non-labour inputs annually, although the fruit-based multi-stratum system used more hired labour and fertilisers. The transport required to deliver the outputs was calculated based on the amount of coffee produced by each system. The shade-based system produced the most coffee (dry weight) because the coffee trees have more space to grow larger and hence produce more coffee.
Table 12. Input and cost data for timber-based, fruit-based and shade-based multi-stratum coffee agroforestry systems
Sack (Rp/unit/cycle) 1,500 1679 1679 1679
Transportation
Output delivery (Rp/kg/cycle) 100 1,502,024 1,870,846 2,058,795
Financial and economic analyses
16
Economic analyses measure profit as it ‘should be’ in an ideal world with no price distortions. Family labour is paid the going market rate and the cost of cleared land is accounted for. Hence the NPV calculated in the economic analysis represent the returns to management and capital, in an ideal world where ‘true’ prices are paid for inputs and outputs (Ginoga, et. al. 2002).
Table 13. Prices of major inputs and outputs used in financial and economic analyses
Item Unit Private Price Social Price
Discount rate % 20 15
INPUTS
Fertilisers Rp/kg 1,500 1,500
Fertiliser for palm oil Rp/kg 2,500 2,500
Pesticides Rp/ltr 55,000 55,000
Family labour Rp/pd 0 15,000
Hired labour Rp/pd 15,000 15,000
Sengon seedling Rp/package 220,000 220,000
Duku seedling Rp/seedling 1,000 1,000
Durian seedling Rp/seedling 1,000 1,000
Candle-nut seedling Rp/seedling 1,000 1,000
Macang seedling Rp /seedling 1,000 1,000
Mango seedling Rp /seedling 1,000 1,000
Meranti seedling Rp /seedling 2,500 2,500
Pinang seedling Rp/seedling 750 750
Rambutan seedling Rp/seedling 1,000 1,000
Rice seedling Rp/kg 3,000 3,000
Vegetables Rp/package 270,000 270,000
OUTPUTS
Meranti wood Rp/m3 350,000 350,000
Pinang fruit Rp/kg 3,500 3,500
Rambutan fruit Rp/kg 1,000 1,000
Rambutan wood Rp/m3 150,000 150,000
17
In financial terms, a system is feasible if its NPV is positive. The financial and economic analyses for the three different multi-stratum coffee agroforestry systems are presented in Table 14. Return to labour was calculated as the wage rate that makes NPV=0.
Overall the three coffee agroforestry systems yield positive returns both privately (Table 14) and socially (Table 15), so they are feasible under the assumptions of this study. Among the coffee systems, the most attractive is the shade-based multi-stratum system with a financial NPV of Rp 12,169,000/ha and an economic NPV of Rp 11,030,000/ha, while the least attractive is the timber-based multi-stratum system with a financial NPV of Rp 5,696,000/ha and an economic NPV of Rp 3,847,000/ha. The timber-based, multi-stratum system has the lowest net returns because a high proportion of the timber trees growing in such systems may not be harvested without the government’s consent. This highlights the inefficiencies, uncertainties and risks that result from unclear or insecure property rights and land-tenure.
Establishment costs were estimated as the present value of costs incurred until the system reaches a positive cash flow. The timber-based, multi-stratum system has the highest establishment costs taking 10 years to reach positive cash flows. Compared with the NPV based on financial analysis, the NPV based on economic analysis of the three systems are all lower but remain positive. Therefore, even from an economic perspective, these land-use systems are attractive for investment. The best economic performance occurs in the shade-based, multi-stratum system with NPVs of Rp 12.2 M/ha.
In terms of employment potential, all of the systems provide similar prospects. In the case of establishment labour, the fruit-based coffee system provides the most employment (3,266 pd/ha) followed by the timber-based multi-strata system (2,954 pd/ha). In terms of economic analysis, the timber-based system provides the most employment (4,514 pd/ha) compared to the other two systems, due to high use of family labour and a longer period to obtain positive cash flow.
The financial and economic analyses of the other agroforestry systems studied are also presented in Tables 14 and 15. All these systems have positive NPVs both financially and economically, so they are feasible and attractive for investment. Mango agroforestry systems have the largest returns (Rp 143,265,000/ha and Rp 225,772,000/ha, financially and economically respectively) followed by duku agroforestry and then durian agroforestry (see Tables 15 and 16). This is because of the relatively high prices received by landowners for mango, duku and durian fruits. It is also indicated that agroforestry systems are more feasible than monoculture plantations because they have higher returns (both financially and economically) and have positive cash flows earlier than monoculture plantations do.
18
Table 14: Financial analysis for several agroforestry systems
Labour requirements
IRR NPV
Establishment costs
Return to labour
Years to
positive Establishment Operation Total (%) (Rp ‘000/ha) (Rp '000/ha) (Rp'000/pd) cash flow (pd/ha) (pd/ha/yr) (pd/ha/yr)
Coffee systems:
Timber-based 30.3 5,696 7,421 11.28 10 3,266 312 319
Fruit-based 32.1 7,209 7,271 12.69 9 2,954 312 319
Shade-based 51.0 12,169 5,703 17.29 4 1,394 312 319
Other systems:
Sengon 51.0 6,683 1,816 99 8 208 211 47
Duku 133.8 71,045 4,180 310 5 269 38 41
Durian 133.5 70,487 4,180 281 5 269 41 44
Candle nut 107 18,217 4,140 108 5 277 34 38
Macang 100 23,135 3,980 119 5 287 29 33
Mango 164.0 143,265 4,180 610 5 269 27 31
Pinang 94.4 8,322 4,104 57 5 277 27 31
19
Table 15. Economic analysis for several agroforestry systems
Labour requirements
IRR NPV
Establishment costs
Return to labour
Years to
positive Establishment Operation Total (%) (Rp ‘000/ha) (Rp '000/ha) (Rp'000/pd) cash flow (pd/ha) (pd/ha/yr) (pd/ha/yr)
Coffee systems:
Timber-based 19.4 3,847 15,819 7.55 14 4,514 312 319
Fruit-based 21.7 6,230 15,040 8.50 12 3,890 312 319
Shade-based 34.3 11,030 9,481 10.43 5 1,706 312 319
Other systems:
Sengon 51.0 9,979 1,967 125 8 208 211 47
Duku 133.8 112,251 4,439 423 5 269 38 41
Durian 133.5 111,379 4,439 272 5 269 41 44
Candle nut 90.9 27,816 4,996 105 5 277 34 38
Macang 92.4 36,225 4,614 141 5 287 29 33
Mango 164.0 225,772 4,439 841 5 269 27 31
Pinang 72.5 12,096 4,959 54 5 277 27 31
Carbon sequestration services
The amount of carbon sequestered by each system is presented in Table 16. Only carbon in the aboveground biomass of coffee trees is included in this analysis. The amount of carbon sequestered in coffee multi-stratum was estimated by assuming a coffee wood density of 0.3 kg/m3 and a carbon content of 45 percent of biomass. Tree biomass was estimated using the allometric equation of Brown (1997):
H D W =0.049⋅ρ⋅ 2
Were H is tree height (metres), ρ is wood density and D is diameter at breast height. Tree height and diameter were obtained from Wulan (2002) and ICRAF (2000).
0
Figure 4. Carbon stocks for three coffee multi-stratum agroforestry systems (tC/ha)
These estimates exclude carbon in soil and litter, and hence underestimate actual carbon stocks. Based on research undertaken in the same area by Van Noordwijk, et al. (2002), it was assumed that the carbon content of non-coffee trees for the whole system were 29.6 tC/ha and that C accumulates in other trees at the same rate as it accumulates in coffee trees. In this case, the carbon stock is about 40 tC/ha by year 20.
Table 16 presents the costs of carbon sequestration for each system. These costs were calculated by dividing the establishment cost by the tonnes of carbon sequestered. It can be seen that carbon costs for the timber-based, multi-stratum systems were the highest.
21
Table 16. Carbon sequestration of several agroforestry and plantation systems
Average
biomass C C Cost (Rp '000/tC) C Cost (US$/tC) (tC/ha) Financial Economic Financial Economic
Coffee systems:
An exchange rate of IDR 10,000 to US$1 was used.
Overall comparison of the systems
Different systems produce different social and environmental benefits. Social benefits are measured using indicators such as food security, income generation and poverty alleviation (Ginoga, et. al. 2002). None of the systems analysed provided any long term, direct food security because staple food-crops, such as rice and vegetables, were only produced during the first few years. However, steady employment can contribute indirectly to both food security and poverty alleviation. Poverty alleviation is also concerned with how the agroforestry systems can provide sustainable income, food, fuel and shelter to farmers and their families. For completeness, the analysis should also have considered the long-term physical impact that agroforestry has on soil erosion, soil fertility and hydrological balance, because these factors influence the systems’ capacity to generate income and other social benefits in the future. Such an assessment, however, is out of the scope of this study.
22
C Sequestration (t C/ha) Social NPV (Rp'000/ha)
Figure 5. Comparison of agroforestry systems in terms of profitability and carbon sequestration, employment potential and carbon sequestration.
Return to labour
Figure 6. Comparison of agroforestry systems in terms of employment potential and return to labour.
SUMMARY AND CONCLUSIONS
This report provides a description of several important agroforestry and plantation systems, ranging from complex coffee agroforests to Sengon monocultures. In general, all the systems evaluated appear to be economically and financially attractive (they have positive NPV). The paper demonstrates how simple economic analysis can be used to evaluate the potential of agroforestry systems to provide both financial and economic profits while at the same time contributing to the mitigation of global warming.
23
implemented as carbon-credit schemes, and the issue of ‘permanence’ of the carbon captured and stored in soils and vegetation.
ACKNOWLEDGEMENTS
We would like to express our gratitude to Hendri of IPB, for generously sharing data and information and to Oscar Cacho for providing editorial advice.
REFERENCES
Budidarsono, S., delos Angeles, M.S. and Wibawa, G. 2001. A profitability assessment of smallholder rubber agroforest systems in Jambi, Sumatra, Indonesia. Manuscript prepared for the workshop “Complex Agroforests: Farmers Knowledge, Management, Profitability and Conservation”, Muara Bungo, Jambi, 3-6 September 2001.
Brown, S. 1997. Estimating Biomass and Biomass Change of Tropical Forest: a Primer. FAO Forestry Paper-134. Food and Agriculture Organisation of The United Nation, Rome.
Fadilasari. 2000. Soal Embargo Kopi Lampung: Sonny Sarankan Cari Alternatif Lain. Tempo, 4 Agustus. In http://www.tempointeractif.com.
Hendri (2000). Comap Data on Several Systems. IPB.
ICRAF, 1998. Alternatives to Slash and Burn in Indonesia. Summary Report and Synthesis of Phase II. ASB Indonesia Report No. 8, Bogor. Indonesia.
ICRAF. 2000. A Profitability Assessment of Robusta Coffee Systems in Sumberjaya Watershed, Lampung, Sumatra Indonesia. Southeast Asia Policy Research Working Paper, No.16.
ICRAF, 2000. Ketika Kebun Berupa Hutan, Agroforest Khas Indonesia, Sebuah Sumbangan Masyarakat.
Ginoga, K.L., O. Cacho., Erwidodo, M. Lugina, and D. Djaenudin. 2002. Economic Performance of Common Agroforestry systems in Southern Sumatra: Implications for Carbon Sequestration Services. Working paper CCO3, ACIAR project ASEM 1999/093. Avaialable from
http://www.une.edu.au/febl/econ/carbon/wpapers.htm (19 November 2002).
Kalima, T. 1990. The Kemiri Plant in Relation to Its Regreening Plant in Indonesia. Journal of Forest Research and Development, vol. VI No. 2, pp. 20-25.
Prosea, 1995. Plant Resources of South-East Asia 5 (1) Timber Trees: Major Commercial Timbers. Prosea, 1995. Plant Resources of South-East Asia 5 (2) Timber Trees: Minor Commercial Timbers. Saiban, Sylviani and Rachman Effendi. 1994. Analysis of Private Sengon Forest Institution in West
Java. Journal of Forest Research and Development, vol. IX No. 1, pp. 13-18.