C O V E R S P R O C E S S I N G 2
create interactive art with code
m
N T™
.”
shut.
•
•
•
•
TH E S PARKFU N G U I DE
TH E S PARKFU N GU I DE
TO PROC ESSI NG
C R E AT E I N T E R AC T I V E A RT
W I T H CO D E
BY D E R E K R U N B E RG
THE SPARKFUN GUIDE TO PROCESSING. Copyright © 2015 by SparkFun Electronics.
All rights reserved. No part of this work may be reproduced or transmitted in any form or by any means, electronic or mechanical, including photocopying, recording, or by any information storage or retrieval system, without the prior written permission of the copyright owner and the publisher.
Printed in USA
For information on distribution, translations, or bulk sales, please contact No Starch Press, Inc. directly:
No Starch Press, Inc.
245 8th Street, San Francisco, CA 94103 phone: 415.863.9900; [email protected] www.nostarch.com
Library of Congress Cataloging-in-Publication Data:
Runberg, Derek.
The SparkFun guide to Processing : create interactive art with code / by Derek Runberg. pages cm
Includes index.
Summary: "A project-based guide for beginners that teaches how to use the programming language Processing. Covers digital artwork and hardware topics including pixel art, photo editing, video manipulation, 3D design, and using Processing to control an Arduino"-- Provided by publisher. ISBN 978-1-59327-612-6 -- ISBN 1-59327-612-5
1. Processing (Computer program language) 2. Computer art. 3. Digital video. 4. Arduino (Programmable controller)--Programming. I. SparkFun Electronics. II. Title.
QA76.73.P75.R86 2015 776--dc23
2015024859
No Starch Press and the No Starch Press logo are registered trademarks of No Starch Press, Inc. Other product and company names mentioned herein may be the trademarks of their respective owners. Rather than use a trademark symbol with every occurrence of a trademarked name, we are using the names only in an editorial fashion and to the benefit of the trademark owner, with no intention of infringement of the trademark.
T H I S BO O K I S D E D IC AT E D TO
T H E E D U C ATO RS AC ROS S T H E U N I T E D S TAT ES
W H O A R E WO R K I N G D I L I G E N T LY TO B R I N G
COM P U T E R S C I E N C E A N D E L EC T RO N IC S
TO T H E FO R E F RO N T
ABOUT TH E AUTHOR
Derek Runberg is the educational technologist at SparkFun Electronics, a position dedicated to creating outstanding curriculum for electronics and computer science education. Before joining SparkFun, Derek was a middle school technology and engineering educator for five years. During this time, he ran a number of after-school and summer programs on both programmable electronics and Processing. Derek’s time as an educator has culminated in this book, which takes computer science concepts and breaks them into digestible chunks that everyone can understand.
Derek documented his work with Processing in the middle school classroom as the author of the website Processing and Interactivity for Educators.
This website focused on students to be creative with code, for the sake of creating.
In his free time, Derek likes to spend time with his two children, Bear and Bridge, and his wife, Zondra. If you ever run into Derek, he will talk your ear off about either food or technology; choose wisely. He enjoys the outdoors, writes code when it’s raining, and has been known to do both at the same time!
ABOUT S PAR KFU N ELECTRON ICS
SparkFun is an online retailer that produces and sells the widgets and parts that end up in a lot of maker projects, prototypes, and even the International Space Station. Nathan Seidle started the company after blowing a circuit board in 2003, while he was an undergraduate at Colorado University. At the time, circuit boards were really hard to get; you had to fax your credit card to another country and hope that you got your hardware in six to eight weeks. Nathan felt he could do better, and he did. SparkFun.com was born, and it now sells over 3,000 different parts of all shapes and sizes for your digital electronic needs. From a basic Arduino to GPS modules, you can find
them and all of the documentation you need to get up and running at SparkFun.
SparkFun’s Department of Education develops curricula and runs professional development programs for educators of all kinds. The department is at the forefront of a number of computer science and maker initiatives that are making headway in the classroom. Processing is an everyday tool in the department and is a foundational part of SparkFun’s professional development workshops around the country. You can learn more about SparkFun and the Department of Education at https://www.sparkfun.com/ and https:// learn.sparkfun.com/.
ABOUT TH E TEC H N IC AL R EVI EW ER
Andres Colubri is an active contributor to the Processing project, as the main developer of the OpenGL renderer and the Video library in Processing 2 and 3. He studied physics and
C O N T E N T S
Fo r e wo r d b y N at h a n S e i d l e . . . .x v i
I n t ro d u c t i o n . . . .x x
P roj ec t 0 : G e t t i n g S ta rt e d w i t h P roc es s i n g . . . 2
P roj ec t 1 : P i x e l A rt . . . .1 6
P roj ec t 2 : H o l i day C a r d . . . .3 2
P roj ec t 3 : A F i rs t Dy n a m ic S k e tc h . . . 4 8
P roj ec t 4 : I n t e r ac t i v e T i m e - B as e d A rt . . . 6 4
P roj ec t 5 : E n t e r t h e M at r i x . . . .8 0
P roj ec t 6 : I m ag e P roc es s i n g w i t h a Co l l ag e . . . 9 2
P roj ec t 7 : P l ay i n g w i t h T e x t . . . .1 1 8
P roj ec t 8 : T wo D r aw i n g P ro g r a m s . . . .1 3 4
P roj ec t 9 : A M a z e G a m e . . . .1 4 6
P roj ec t 1 0 : M a n i p u l at i n g Mov i es a n d C a p t u r i n g V i d eo . . . .1 6 6
P roj ec t 1 1 : Au d i o P roc es s i n g w i t h M i n i m . . . .1 8 4
P roj ec t 1 2 : Building a Weather Dashboard
with JSON Data . . . 2 0 8
P roj ec t 1 3 : U s i n g S e n so rs w i t h P roc es s i n g
a n d A r d u i n o . . . 2 3 2
C O N T E N T S I N D E T A I L
Fo r e wo r d
b y N at h a n S e i d l e . . . x v iI n t ro d u c t i o n
. . . x x W h y S ta rt M a k i n g w i t h P roc es s i n g ? . . . x x W h o T h i s Bo o k I s Fo r . . . .x x A N ot e to T e ac h e rs . . . .x x i W h at ’ s i n T h i s Bo o k . . . .x x i t h e P roc es s i n g Com m u n i t y . . . x x i v O n l i n e R eso u rc es . . . x x i vP roj ec t 0
G e t t i n g S ta rt e d w i t h P roc es s i n g . . . 2
A b o u t P roc es s i n g . . . 4
A P ro g r a m m i n g L a n g u ag e . . . 4
A To o l fo r A rt a n d D es i g n . . . 4
A n O p e n So u rc e P roj ec t . . . 5
I n s ta l l i n g P roc es s i n g . . . 6
T h e I D E . . . 7
A Q u ic k To u r . . . 8
T h e P r e f e r e n c es W i n dow . . . 9
H e l lo Wo r l d . . . .10 A n atomy o f a S k e tc h . . . .1 1 A T wo - Pa rt R ec i p e . . . .1 1 Sy n ta x . . . .1 2 Data T y p es . . . .1 3 C a rt es i a n Co o r d i n at e P l a n e . . . .1 3
P roj ec t 1
P roj ec t 2
H o l i day C a r d . . . .3 2 G at h e r Yo u r M at e r i a ls . . . .3 4 D r aw i n g Mo r e S h a p es ! . . . .3 4 E l l i p s es . . . .3 4 L i n es . . . .3 5 Q u a d r i l at e r a ls . . . .3 9 T r i a n g l es . . . .4 1 P ro g r a m m i n g a D i g i ta l Co l l ag e . . . 4 2 S e t t i n g t h e S tag e . . . .4 2 G lu i n g Dow n t h e P i ec es . . . 4 3 P r i n t i n g to t h e Co n so l e . . . .4 6 Ta k i n g I t F u rt h e r . . . .4 7
P roj ec t 3
A F i rs t Dy n a m ic S k e tc h . . . .4 8 Mo r e o n Va r i a b l es . . . .5 0 A n atomy o f a Va r i a b l e . . . 5 0 W h e r e to U s e a Va r i a b l e . . . 5 1 M at h i n P roc es s i n g . . . .5 1 Lo g ic . . . .5 2 I n s i d e i f ( ) S tat e m e n ts . . . 5 2 A R e f r es h e r o n R e l at i o n a l O p e r ato rs . . . 5 4 Lo g ic a l O p e r ato rs . . . .5 4 Fo l low i n g t h e Bo u n c i n g B a l l . . . .5 5 Mov i n g i n O n e D i r ec t i o n . . . 5 6 C r e at i n g W a l ls . . . .5 7 Trails of Color and Multiple Variables . . . .5 9 R e u s i n g Co d e . . . .5 9 M a n i p u l at i n g I n d i v i d u a l S h a p es . . . 6 0 Ta k i n g I t F u rt h e r . . . .6 2
P roj ec t 4
E x t e n d i n g Yo u r R a n g e . . . .6 8 T r a n s fo r m at i o n F u n c t i o n s . . . .7 0 A n A b s t r ac t C loc k . . . .7 1 Com p a r i n g t h e M a j o r T i m e F u n c t i o n s . . . 7 1 S p ic i n g I t U p ! . . . .7 2 S h a r i n g Yo u r P roj ec t ! . . . .7 5 Ta k i n g I t F u rt h e r . . . .7 9
P roj ec t 5
E n t e r t h e M at r i x . . . .8 0 W h at I s a M at r i x ? . . . .8 2 T h i n k i n g w i t h M at r ic es . . . .8 4 T r a n s l at i o n R e v i s i t e d . . . .8 5 Rotat i o n R e v i s i t e d . . . .8 6 S c a l i n g R e v i s i t e d . . . .8 7 H ac k i n g Yo u r P r e v i o u s P roj ec ts . . . 8 8 Ta k i n g I t F u rt h e r . . . .90
P roj ec t 6
I m ag e P roc es s i n g w i t h a Co l l ag e . . . 9 2 F i n d i n g a n I m ag e to U s e . . . .9 4 T h e P I m ag e Data T y p e . . . .9 5 U s i n g Yo u r I m ag e i n a S k e tc h . . . .9 6 I m ag e Mo d es . . . .9 7 T r a n s fo r m at i o n . . . .9 9 A P h oto Co l l ag e . . . .1 0 0 M u lt i p l e I m ag es . . . .1 0 0 R e t u r n i n g to t h e M at r i x . . . .1 0 2 S c at t e r e d P h otos . . . .1 0 3 A p p ly i n g T i n ts . . . .1 0 5 F i lt e r B as ic s . . . .1 0 8 P roc es s i n g O b j ec ts . . . .1 1 1 Ta k i n g I t F u rt h e r . . . .1 1 5
P roj ec t 7
Fo n ts . . . .1 2 4 C r e at i n g a Fo n t . . . .1 2 4 Loa d i n g a Fo n t . . . .1 2 5 A S i m p l i f i e d T y p e w r i t e r . . . .1 2 6 F e tc h i n g L e t t e r K e ys . . . .1 2 7 U s e f u l D e l ays . . . .1 2 8 A Data Das h b oa r d . . . .1 2 9 F e tc h i n g S tat i s t ic s a n d S e t t i n g U p . . . .1 2 9 I n d ic at i n g Mo u s e Q u a d r a n t . . . .1 3 0 S h ow i n g T i m e a n d Mo u s e Co o r d i n at es . . . .1 3 2 Ta k i n g I t F u rt h e r . . . .1 3 3
P roj ec t 8
T wo D r aw i n g P ro g r a m s . . . .1 3 4 Mo r e Mo u s e Va r i a b l es . . . .1 3 6 E v e n t F u n c t i o n s . . . .1 3 6 R a i n b ow Do o d l es . . . .1 3 8 I m p l e m e n t i n g mo u s e D r ag g e d ( ) . . . .1 3 8 I m p l e m e n t i n g mo u s e P r es s e d ( ) . . . .1 4 0 A S i m p l e Pa i n t i n g P ro g r a m . . . .1 4 0 C r e at i n g a Co lo r - C h a n g i n g F e e d b ac k Bo x . . . .1 4 1 C h a n g i n g t h e P e n Co lo r . . . .1 4 3 Ta k i n g I t F u rt h e r . . . .1 4 4
P roj ec t 9
P roj ec t 1 0
M a n i p u l at i n g Mov i es a n d C a p t u r i n g V i d eo . . . .1 6 6 W h at I s a L i b r a ry ? . . . .1 6 8 A d d i n g L i b r a r i es to P roc es s i n g . . . .1 6 8 U s i n g L i b r a r i es i n Yo u r S k e tc h . . . .1 6 8 C a l l i n g L i b r a ry F u n c t i o n s . . . .1 7 0 A d d i n g Yo u r Ow n V i d eos to a S k e tc h . . . .1 7 1 A p p ly i n g T i n ts a n d F i lt e rs . . . .1 7 2 I n t ro d u c i n g fo r ( ) Lo o p s a n d A r r ays . . . .1 7 4 C a p t u r i n g V i d eo . . . .1 7 7 Mo d i f y i n g t h e s e t u p ( ) F u n c t i o n . . . .1 7 7 D i s p l ay i n g L i v e C a p t u r e . . . .1 7 9 C r e at i n g a P h oto Bo ot h . . . .1 8 0 A d d i n g t h e s e t u p ( ) F u n c t i o n . . . .1 8 0 C r e at i n g t h e d r aw ( ) Lo o p . . . .1 8 1 Ta k i n g I t F u rt h e r . . . .1 8 2
P roj ec t 1 1
Au d i o P roc es s i n g w i t h M i n i m . . . .1 8 4 G at h e r Yo u r M at e r i a ls . . . .1 8 6 I n t ro d u c i n g t h e M i n i m L i b r a ry . . . .1 8 6 Creating a Single-Song Audio Player. . . .1 8 9 Introducing Minim’s AudioSample Class . . . 1 9 4 Improving Your Audio Player with Metadata . . . .1 9 5 V i s u a l i z i n g So u n d . . . .1 9 8 S e t t i n g U p Au d i o I n p u t . . . .1 9 8 D r aw i n g So u n d . . . .1 9 9 R eco r d i n g Au d i o to C r e at e a So u n d b oa r d . . . .2 0 3 C r e at i n g t h e C l as s O b j ec ts . . . .2 0 3 W r i t i n g t h e s e t u p ( ) a n d d r aw ( ) F u n c t i o n s . . . .2 0 3 R eco r d i n g a n d P l ay i n g Sa m p l es
in an Event Function . . . 2 0 4 Ta k i n g I t F u rt h e r . . . .2 0 6
P roj ec t 1 2
Building a Weather Dashboard with JSON Data . . . .2 0 8
W r i t i n g a C u s tom Data Pa rs i n g F u n c t i o n . . . .2 2 0 S ta rt i n g a N e w F u n c t i o n Ta b . . . .2 2 0 L i s t i n g Data Va r i a b l es . . . .2 2 1 W r i t i n g a B as ic C u s tom F u n c t i o n i n u p dat e _ data . . . .2 2 2 Pa rs i n g Yo u r W e at h e r Data i n a C u s tom F u n c t i o n . . . .2 2 4 D r aw i n g t h e W e at h e r Das h b oa r d i n t h e M a i n Ta b . . . .2 2 7 P u l l i n g a W e at h e r Ico n f rom t h e W e b . . . .2 2 9 Ta k i n g I t F u rt h e r . . . .2 3 1
P roj ec t 1 3
U s i n g S e n so rs w i t h P roc es s i n g a n d A r d u i n o . . . .2 3 2 G at h e r Yo u r M at e r i a ls . . . .2 3 4 W h at I s a M ic roco n t ro l l e r ? . . . .2 3 4 W h at I s A r d u i n o ? . . . .2 3 5 T h e S p a r k F u n D i g i ta l Sa n d b o x . . . .2 3 5 I n s ta l l i n g t h e A r d u i n o So f t w a r e . . . .2 3 7 I n s ta l l i n g A r d u i n o a n d D r i v e rs o n W i n dow s . . . .2 3 7 I n s ta l l i n g A r d u i n o a n d F T D I D r i v e rs o n OS x . . . .2 3 8 I n s ta l l i n g A r d u i n o o n U b u n t u L i n u x . . . .2 3 9 I n t ro d u c i n g t h e A r d u i n o I D E . . . .2 4 0 S e l ec t i n g Yo u r Boa r d a n d C h o os i n g a Po rt . . . .2 4 2 A n A r d u i n o H e l lo Wo r l d . . . .2 4 3 E x p lo r i n g a n A r d u i n o S k e tc h . . . .2 4 3 W r i t i n g t h e s e t u p ( ) F u n c t i o n . . . .2 4 3 W r i t i n g t h e lo o p ( ) F u n c t i o n . . . .2 4 4 A n a lo g V e rs u s D i g i ta l . . . .2 4 6 R e a d i n g V e rs u s W r i t i n g Data . . . .2 4 6 R e a d i n g Data f rom S e n so rs . . . .2 4 7 C r e at i n g t h e S e n so r Data Das h b oa r d i n P roc es s i n g . . . .2 5 0 I m p o rt i n g L i b r a r i es a n d C r e at i n g Va r i a b l es . . . .2 5 0 P r e p a r i n g P roc es s i n g fo r S e r i a l Com m u n ic at i o n . . . .2 5 1 F e tc h i n g Yo u r S e r i a l Data . . . .2 5 2 T es t i n g t h e S e r i a l Co n n ec t i o n . . . .2 5 4 V i s u a l i z i n g Yo u r S e n so r Data . . . .2 5 6 Lo g g i n g S e n so r Data w i t h P roc es s i n g . . . .2 5 9 Ta k i n g I t F u rt h e r . . . .2 6 1 S e n d i n g Data f rom P roc es s i n g to A r d u i n o . . . .2 6 1 R ec e i v i n g P roc es s i n g Data o n a n A r d u i n o . . . .2 6 3
Three hundred years ago,
books were limited to a select few:
members of the clergy and the upper class. Then, as access to education
increased dramatically and the printing industry took off, the world struggled
to change the educational system to teach students the fundamentals of
reading. Today, we take for granted that every student will learn how to
read—it’s a necessary skill to operate in the modern world. But it’s interesting
to note that we have the same anxieties now about how to teach every
student the fundamentals of programming as people had about reading so
long ago. We all know it needs to happen; the devil is in the details.
I learned to program by getting a bootlegged copy of Visual Basic
from one of my parent’s friends and spending countless hours re-creating
a board game called Stratego. I even made it work over a modem so I
could play against friends who lived across town. This wasn’t part of a
class that I took in seventh grade; it was raw, unguided determination.
I learned a tremendous amount, but it was a slow process and I often
programmed in very wrong ways. I would design what should happen
code 72 times across 72 different player squares. I distinctly remember the
day I discovered what a function call was and thinking, Whoa! That’s how
that works?! Overnight, my code got a lot smaller and easier to modify,
and I learned something I now use every day of my life. I seriously love
writing code.
Based on this experience, I am of two minds about the learning
process. There is part of me that believes every person needs to have the
experience of trying to build something, to design something, to sculpt
something before they discover the tips and tricks of their profession. That
way we will truly understand just how beneficial those tools are. There
is, however, an equally loud part of me that thinks no one should waste
time fumbling around getting frustrated. We should instead stand on the
shoulders of others and reach for the stars. There is no end to this debate,
but the good news is that no matter how you learn the tools, they have
gotten much easier to learn for two reasons: the Internet and open source.
When I was learning how to program, I struggled to find a book, a
158 million how-to videos on YouTube. There are countless communities
on the Internet that want nothing more than to share and to help other
members have a positive experience learning something new. There
are dozens of large nonprofit entities creating free online courses on art
history, genetics, fundamentals of music theory, and yes, even an “Intro
to Programming.” When I was a kid, my determination to learn something
nonstandard was frowned upon; my parents were worried I needed to
spend more time outdoors or playing with friends. I think I ended up just
fine, but if I were growing up today, with the resources that are available
to beginners now, I think a small amount of determination would lead to
much larger success than I ever experienced.
If I were in seventh grade, I'd want to learn Processing. It has a huge
Internet community and countless how-tos. Thanks to the power of open
source, the community has flourished, creating apps and plug-ins that
extend Processing into environments that its creators Ben Fry and Casey
Reas probably never expected. I’ve seen Processing run on
point-of-sale cash registers in a local coffee shop, and I’ve used it to design an
app for my mobile phone. You can’t walk through a museum or public
space without interacting with an installation that is running Processing.
those languages that’s easy to learn and just keeps going. It can do
amazing things if you just dig in and start hacking it.
Now I must give a shout-out to Derek. To author a technical book is
difficult. It takes intimate knowledge of how things work coupled with the
language skills to express concepts in a way that readers can absorb.
We call this interaction “teaching” and “learning,” and we often take it for
granted.
The SparkFun Guide to Processing
is an excellent example of
modern teaching. Through Derek’s writing and lessons, you will gain the
knowledge you need to use Processing.
Once you open the box and master the tool, Processing can lead
you to some truly awe-inspiring projects. I am constantly enjoying
hair-raising experiences from artists, performers, and creators who have all
used Processing to create their work. I hope you find inspiration in Derek’s
amazing book to continue exploring the interaction between the digital and
physical worlds. Where these worlds collide, humanity is improved and
expanded.
But enough talking—let’s build some fun stuff!
In my teaching career and during my time at SparkFun, I’ve used Processing to make computational thinking approachable, and this book is the culmination of that work. Many of the projects you’ll create here come directly from my experience teaching middle school tech-nology classes. Others come from my experience running work shops for a wide variety of participants, from young children to seasoned web developers. But all of them will teach you something and hopefully inspire you to dig more deeply in to making.
W H Y STA RT M A K I N G W I T H P RO C E S S I N G ?
Processing was developed to make it easy for anyone to create interactive art, so by design, it makes programming accessible for the masses. That alone makes Processing a great place to start your journey into DIY, but there’s another good reason: Processing has a close connection to Arduino. The programming language and development environment for the Arduino platform are based on Processing, so when you’re ready to transition from software to hardware, you’ll feel right at home.Early in my endeavors to learn and teach programming, I started my students out with Arduino. I quickly found, however, that learning how to build circuits and program at the same time was over whelming for students who had no experience with either. I needed to separate the two issues and let my students focus on each independently. That’s when I met Jeff Branson, who works in the SparkFun Department of Education. We got to talking about Processing, and he ran a 45-minute workshop in my class room right before spring break. By the end, he had my students running code like the examples you’ll see in the first two projects of this book.
My students and I were hooked, and I think you will be, too.
W H O T H I S B O O K I S F O R
This book is for anyone interested in making dynamic, interactive art and learning to program along the way. It’s designed with beginners in mind, so you definitely don’t need to have a background in com-puter science. You just have to want to make something awesome,
and badly enough to get some simple code working. This book will teach you basic programming, but it’s focused on making something cool in an approachable way.
If you’re driven to learn on your own, this book will be extra fun for you. You’ll finish with a portfolio of interesting, creative, and useful Processing applications that you can incorporate into your everyday life—a web page, your phone, and even print. I’ll walk you through experiences, tools, and concepts that will be useful across a number of disciplines and applications, including art and engineering. For example, it wouldn’t be hard to combine a few of these projects into a program that collects data from the Web and visualizes it as part of an interactive art installation.
In the end, this book is for doers and makers. It’s for those who like getting their hands dirty, who love to explore through creating both physically and digitally. It’s for those who are curious about pro-gramming but might be a little intimidated by the math or the science of it. In fact, if you have read this far without putting the book down, you’ll do well getting through it.
A N OT E TO T E A C H E R S
First and foremost, I love you and thank you for doing what you do. In a lot of ways, I designed this book to emulate the experience my students and I had of learning Processing through doing. You could easily use each chapter as a project for your class. The instructional content for each chapter is written to be detailed and concise enough that you can hand it to a student on its own. I've also designed the projects to be open-ended so that each student’s project should come out differently and can be personalized. The projects introduce new concepts on a need-to-know basis, which is great for someone just starting out with programming. It filters the background noise and allows you to focus on what is important: making a cool project, for yourself and with your students.
W H AT ’ S I N T H I S B O O K
your own personal flair and personality. I want your projects to look and feel different from any other reader’s.
Following that approach, this book is broken into 14 projects: • Project 0: Getting Started with Processing shows you how
to install Processing and helps you write your first program to draw a simple line.
• Project 1: Pixel Art teaches you how to draw actual shapes in Processing. You’ll draw rectangles and translate some graph-paper pixel art to the computer screen.
• Project 2: Holiday Card gives you more basic drawing prac-tice. You’ll draw ellipses and triangles, play with stroke weight, and make a digital snowman.
• Project 3: A First Dynamic Sketch covers the if() state-ment, a basic building block in programming, and explains how you can use it to move shapes around in your sketches.
• Project 4: Interactive Time-Based Art shows you how to use the clock and calendar in your computer to control a draw-ing’s color and position over time, and introduces the idea of rotating and scaling shapes.
• Project 5: Enter the Matrix teaches you to manipulate entire groups of shapes as if they were a single image, and covers how to translate multiple shapes across the screen at the same time. • Project 6: Image Processing with a Collage teaches you
how to use photographs and other image files in Processing to make a photo collage, add some pretty cool filters, and do some simple photo manipulation. In this project, I also give you a brief introduction to object-oriented programming.
• Project 7: Playing with Text introduces drawing text in a Processing sketch. I cover how to use fonts, change the font size in your program, and create a dashboard that displays your mouse position in the sketch window.
• Project 8: Two Drawing Programs explores more ways users can interact with your Processing sketches. You’ll create a pair of simple paint programs that let you use your mouse to draw pictures freehand, either in random or controllable colors. • Project 9: A Maze Game shows you how to make a video
• Project 10: Manipulating Movies and Capturing Video shows you how to put your webcam to good use with Processing to build a photo booth. This will be your first foray into libraries in Processing, and you’ll get a deeper look at object-oriented programming.
• Project 11: Audio Processing with Minim teaches you how to add, record, and trigger different sounds in Processing sketches, as well as access all of the amazing background data that comes with MP3 files.
• Project 12: Building a Weather Dashboard with JSON Data levels up your skills as you use the Web to find and extract data in JSON format to build a simple weather dashboard appli-cation and keep its information up to date.
• Project 13: Using Sensors with Processing and Arduino
gives you another taste of using hardware with Processing. You’ll gather sensor data with an Arduino, send that data to Processing over a serial connection, and graph it. At the end, I’ll show you how to control an RGB LED on an Arduino with Processing.
These projects focus not on teaching every programming con-cept, but on the concepts you need to create something beautiful and cool. That doesn’t mean you won’t learn some programming along the way: I just explain any necessary programming concepts contextually on a need-to-know basis. My hope is that having a concrete application for what you’re learning will help that knowl-edge sink in. The projects are numbered because they build on one another in terms of complexity and your understanding, but you should feel free to circle back and take another swing at a project or apply more advanced concepts to previous projects. Throughout the book, I point out particularly good opportunities to go back and hack previous projects with your newfound skills, but I hope you’ll revisit any project you like, as much as you want, at any time.
For each step of the way, I’m there to help you. I explain what’s going on in the code, how everything comes together, and even some of the pitfalls within a given project. At the end of each project is a “Taking It Further” section to encourage you to explore that proj-ect’s theme on your own and personalize the project. Sometimes, I’ll ask you to take the concept in a whole new direction; other times, I’ll just discuss how you can improve what you already have.
NOTE
Several of the projects in
this book are based on
SparkFun’s HotSheets,
single-page projects meant
to help you get started with
new technologies. You
can check out these and
other SparkFun tutorials at
T H E P RO C E S S I N G CO M M U N I T Y
As you work through this book, I highly encourage you to visit the official Processing forums at Processing.org and share your own projects through OpenProcessing.org, because the Processing com-munity is full of wonderful people and inspiring projects. Processing was my first major experience with the open source community, after Arduino. It floored me that I could jump on a forum and find example code and discussions about problems or ideas just like mine, and I’m sure you’ll find the community just as welcoming.
The first time I posted to OpenProcessing.org to share programs, I received comments on my code and it was forked. That was a powerful moment: it was so cool to know that someone liked my code enough to think it useful! You’ll have similar moments, and as you learn and gain experience with different tools and plug-ins for Processing, you can even give back to the community by writing your own libraries.
On top of that, it’s fun to find others using Processing to create both beautiful art (like museum installations or insane data visualiza-tions) and utilitarian projects (like control systems, user interfaces, and mapping applications). Whatever they’re working on, everyone I encounter is just as excited that I’m using Processing as I am that they are. In my time working at SparkFun so far, I’ve found a num-ber of companies that use Processing for everything from creative endeavors to sensitive control and feedback systems. You never know what you’ll find!
O N L I N E R E S O U R C E S
If you get stuck on something or you’re just looking for a concrete example to compare to your project, you can find all of the example code from the book at https://nostarch.com/sparkfunprocessing/ for download. The programs are organized into folders by project, so you can find all the source code easily. Within each folder, you’ll find the sketches for any output shown in that project. (For example, if you wanted to open the sketch for Figure 2-10, you’d download the source code, open the Project 2 folder, open the fig_2_10 folder, and open fig_2_10.pde in Processing.) When a sketch includes external files such as images, sounds, and so on, you can find them in a data folder within the sketch’s folder, too.
GETTING STARTED
WITH PROCESSING
TH IS PROJ ECT COVERS
EVERYTH I NG YOU N EED TO
G ET PROC ESS I NG U P AN D
RUNNING BEFORE YOU DIVE IN
TO THE FIRST PROJECT; THAT’S
WHY IT’S CALLED PROJECT 0.
I ’ LL I NTRO D U C E YO U TO
PROC ESS I NG, TELL YOU HOW
TO I NSTALL IT, AN D H ELP YOU
MAKE SURE IT WORKS. AT THE
EN D OF TH E PROJ ECT, YOU ’ LL
HAVE A WORKI NG PROC ESS I NG
ENVI RON M ENT AN D, HOPEFU LLY,
A SENSE OF ACCOMPLISHMENT.
A B O U T P RO C E S S I N G
So you bought this book about Processing, perhaps after hear-ing that you could use it to make art with code. But where did Processing come from, and what exactly can you do with it?
A Programming Language
First and foremost, Processing is a programming language, which means it provides a way for you to interface with a computer and give it instructions. You can use programming languages like Processing to teach a computer to do some pretty cool tricks! But just like learning Spanish, English, or Swahili, learning Processing takes time and patience. You’ll make mistakes, and some programs will act oddly at first. You’ll have burning questions, and you’ll need to look up answers. And that’s all okay!
A Tool for Art and Design
Processing was created to make computers and programming more accessible as creative tools for artists and designers. It was devel-oped in 2001 at the Massachusetts Institute of Technology (MIT) by Casey Reas and Ben Fry, while they studied under John Maeda in the Aesthetics and Computation research group. Since then, Processing has developed quite a following, and it even has its own foundation to manage and continue the good work Casey and Ben started.
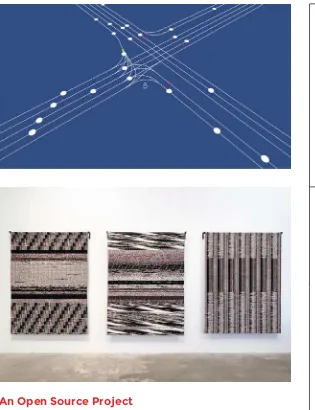
Before Processing, the few people who wrote programs to gen-erate artwork mostly had backgrounds in computer science, not art. Today, artists, designers, and engineers have embraced Processing for creating graphics, modeling physical objects (see Figure 0-1), designing architecture, building electronics, and more. Processing can communicate with hardware and with other software packages, which has also made it useful in performing arts, lighting, and other physical installations (see Figure 0-2).
Processing’s role as a creative tool is summed up in the Processing Foundation’s mission statement.
An Open Source Project
The Processing language and its environment are free to download
and use, but Processing is so much more than a free tool. It’s an open source project, which means that you are free to modify it. You can remix the base code that makes up the language and the programming environment, add new tools to improve it, or even use the platform as a basis for an entirely new project! In fact, others have done this already. If you’ve ever programmed an Arduino microcontroller board, you’ll feel right at home when you start up Processing, because Arduino—another open source project— adopted Processing’s programming language and environment.
FIGUR E 0 -1:
City Symphonies, created
by Mark McKeague, is a
simulation in which traffic
patterns and vehicle
movement dictate sounds.
FIGUR E 0 -2:
In his piece Fragmented
Memory, Phillip Stearns
created the pattern for this
triptych of woven tapestries
using Processing and data
dumped from his
The catch is that when you use or modify open source mate-rial in a project, you agree to give credit to the original owner of that material. You can find out more about open source licenses, such as Creative Commons, at http://www.opensource.org/.
Since its inception, Processing has been adapted for a number of applications, including a JavaScript library called Processing.js (devel-oped by John Resig) and an Android mode, which ports Processing sketches over to Android applications for phones and tablets. In the future, you might even see versions of Processing that support other programming languages, such as Ruby or Scala.
Now that you have a better idea of what Processing is, it’s time to download and install it.
I N STA L L I N G P RO C E S S I N G
Visit http://www.processing.org/download/ to download and install Processing. The website will ask if you want to donate to the Processing Foundation; I’ll let you decide how to answer that. Next, click Donate & Download to reach the download page, and download the latest stable release of Processing.
Once you have downloaded your version of Processing, unzip or unpack the compressed folder to a safe location that you’ll remem-ber, and don’t remove any files from it. In Windows, I usually place this unzipped folder in my Programs or Documents folder to keep it handy; in OS X, you might put yours in the Applications folder. You could also leave it on the Desktop.
Unzip the folder, and your installation should be complete! Processing doesn’t require a full installation process, unlike many other applications, so you don’t have to deal with an installer pro-gram or be the administrator of the machine.
In Linux, your downloaded file will be a .tar.gz file instead of a .zip file. Place this in your home directory, and open a terminal. Then enter the following command, where processing-xxxx.tgz is a placeholder for the name of the file you just downloaded:
$ tar xvfz processing-xxxx.tgz
If you want to make Processing more accessible, you can always create a shortcut in Windows or drag it to your Dock if you are using OS X.
Now that you have Processing installed, you’re ready to get it up and running.
T H E I D E
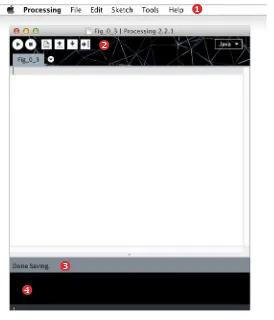
Open the Processing 2.2.1 folder (the unzipped folder you just downloaded) and double-click the Processing executable. This should launch Processing, and after a splash screen, you should see the integrated development environment (IDE), which looks something like Figure 0-3.
An IDE is simply a place for you to write code and test it out; it is really nothing more than a word processing tool that allows you to write instructions for your computer. Just like a word processing
FIGUR E 0 - 3:
The Processing IDE
application, the IDE has tools for making corrections, formatting, and entering text, but its focus is on the Processing language rather than the English language. What separates an IDE from the word processing program I am using to write this book is that an IDE allows me to run the set of instructions as a program on my computer.
A Quick Tour
Take a look around the IDE now. The majority of the area is whitespace; this is where you’ll write your code. At the top of the interface is a menu bar
, where you can save and open files, export your code, and more. Underneath the menu bar, you’ll find a set of graphic buttons
; from left to right, those buttons are Run, Stop, New, Open, Save, and Export. You’ll explore the menu bar and those six buttons throughout this book.Before you write any code, go ahead and click the Run but-ton. Processing will work a bit and then display a window with a gray square in it, as shown in Figure 0-4. Not very cool, is it? Don’t worry—you’ll fix that soon!
For clarity, I’ll refer to the window where that square appeared as your sketch window, and I’ll refer to the IDE as your code window. Close the sketch by clicking the Stop button.
You can click New to create a blank sketch, Open to work on previously saved sketches, and Save to save your current sketch. The final button, Export, is for exporting the application when you’re done developing your sketch. You can export your sketch to a num-ber of different formats depending on your operating system and how you plan to use it.
When you save your sketch, it is placed in your sketchbook. The sketchbook is a set folder where your sketches are automatically saved. By default, on a computer with multiple users set up, your sketchbook is placed in the Documents folder for your specific user.
Below the code window, you should see the alert bar
and the console
. Type your name in the code window and then click Run.FIGUR E 0 - 4:
You’ll get an error, and your alert bar will turn red. In my case, I saw the error message Syntax error, maybe a missing semi-colon?
in my alert bar, and my console printed expecting SEMI, found 'Runberg' (see Figure 0-5).
This is how Processing displays errors—without frills. Processing tells you what you are probably missing and where the error occurred by highlighting the error’s location in your code.
The Preferences Window
You can make a few changes to the Processing IDE by opening the Preferences window (Figure 0-6) under the File drop-down menu. Within Preferences, you can change the location of your sketchbook folder, the font and font size of the text editor window, and many other options.
You can see from my Preferences window that my font size is much larger than the default and that I increased the maximum amount of memory allocated to Processing to 1GB (1,024MB). Depending on your changes here, you may have to close and restart Processing before they take effect.
FIGUR E 0 - 5:
Syntax error displayed in
That concludes your brief Processing IDE tour. Now you’ll create your first Processing sketch!
H E L LO WO R L D
Programmers who are just learning a new language usually write a little test program after installing any necessary software, just to make sure that everything is set up correctly. Such a program is often called Hello World.
Processing has a number of basic functions you could use in a Hello World program, but I like to draw a simple line. Type the follow-ing in the code window, and click the Run button.
void setup() {
size(250,250);
}
void draw() {
FIGUR E 0 - 6:
The Preferences
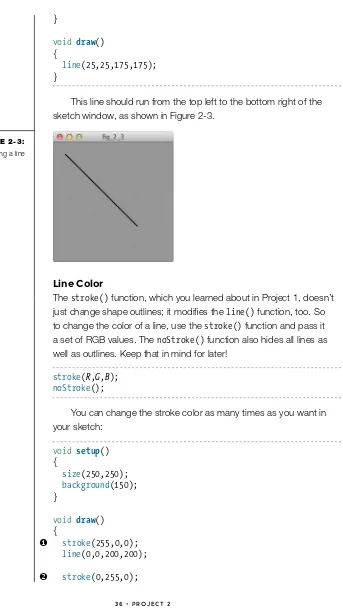
line(0,0,200,200); }
Congratulations: you’ve written and run your first Processing sketch! You should see a sketch window that is larger than the one in Figure 0-4, and it should contain a diagonal line from the upper-left corner to the lower-right corner, as shown in Figure 0-7.
Next I’ll walk you through this Hello World sketch in a bit more detail.
A N ATO M Y O F A S K E T C H
Go back to your code window and take a closer look. The Hello World sketch contains three functions: setup(), size(), and line(). A function is a named set of instructions that accomplishes a task. These three functions were written by the designers of Processing, but later in the book, you’ll write your own. You can find the basic structure, or syntax, of a Processing sketch in the Hello World program.
A Two-Part Recipe
In the Hello World code, there are two structural functions (functions that every Processing sketch has): setup() and draw(). To visualize how these functions work, imagine making a batch of cookies. When you bake cookies, you have a recipe, and a recipe has two parts. The first part covers everything you need to prepare: ingredients, equipment, and even the time you need to set aside. The second half contains the step-by-step instructions to make a single batch of cookies. In a Processing sketch, setup() and draw() are just like those two parts of a recipe. These two functions make up the
FIGUR E 0 -7:
organizational order of the sketch and dictate how the sketch runs. You can play around with the code that goes under setup() and
draw() to achieve different outcomes.
void setup() {
}
void draw() {
}
The setup() function
is the first part of the recipe: it includes all the things that you will do to prepare to make the cookies. This function runs the functions inside it (between the curly brackets) only once at the beginning of the sketch. The draw() function
is the second part: the act of making the cookies. In Processing, thedraw() loop repeats over and over again, 60 times a second. The main difference between these two functions is that your draw()
function is a loop—a piece of code that repeats itself—and setup()
runs only once. In essence, you are telling Processing to make batches of cookies at 60 times per second until you tell it to stop. That is really fast baking!
In every sketch you create, you’ll include a setup() function because leaving it out would be like baking cookies without any ingredients or tools—you just can’t! You can, however, have a sketch without a draw() loop and place all of your functions inside setup(), but then they would all run only once. That’s fine, but only one batch of cookies is no fun, so for most of this book, you will make use of the draw() loop.
Syntax
Processing knows which parts of your code are functions only if you follow the correct syntax. Syntax is a set of rules that describes the correct way to put together a program, like the grammar rules that dictate the right way to construct a sentence. For example, in the English language, you capitalize the first letter of a sentence and put a punctuation mark at the end. And just like written languages, all programming languages have their own syntax.
function contains line(). All function names are followed by a pair of parentheses, (), and depending on the function, you’ll often include parameters inside those parentheses. Parameters contain informa-tion that funcinforma-tions need to do their jobs.
For example, size() specifies the size of your sketch window, but you have to use parameters to tell it how big to make the window. In this project, you set the window size to 250 pixels wide (the first parameter) by 250 pixels high (the second parameter). The line()
function draws a line between two points, and you told it to draw from point (0,0) to point (250,250). But not all functions take numbers as parameters, and some (such as the setup() function) don’t need parameters at all!
The semicolon, ;, is another important part of the Processing syntax: all functions should end with a semicolon. Don’t forget it, or Processing won’t know where your function stops. This is a common error, even among veteran programmers. Just like a period at the end of a sentence, a semicolon denotes the end of a function and tells the computer to go to the next one.
These basic syntax structures should be enough to get you started. As you work through more projects, I’ll address other parts of the syntax as necessary. The major thing to focus on is the error messages; they tell you what you are missing and where!
Data Types
Just like a good cookie recipe, any program you want to produce meaningful results needs ingredients—that is, data to manipulate. You’ve already seen one type of data that you can use in Processing; just look at the parameters in line(0,0,200,200). Processing clas-sifies each number there as an int, short for integer, which is just a whole number without a decimal point.
You can also work with floating-point numbers (those with a decimal point); Processing would recognize a number like 3.14 as the
float data type. Processing has several more data types, which I’ll introduce as needed throughout this book.
Now that you understand the structure of a sketch, it’s time to explore the sketch window on which it’s drawn in more detail.
pixels are the unit of measurement. Anything that has a dimension— including the width and height you gave the size() function, as well as length, depth, and so on—is given in pixels.
Processing treats the sketch window like a Cartesian coordinate plane, and every pixel corresponds to a coordinate in that plane (see Figure 0-8). In two dimensions, you’ll work with x-coordinates (width) and y-coordinates (height).
Click Run on your sketch again. Recall that the line goes from (0,0) to (250,250). The upper-left corner is the origin of the sketch window, or (0,0). As you move to the right, the x-value (or the width) increases. As you move down the sketch window, the y-value (or the height) increases. You might remember from math class that the y-axis usually increases as you move up in a graph. Processing flips that graph concept upside-down, as shown in Figure 0-9.
FIGUR E 0 - 8:
A sketch window with
x- and y-axes
0,0
Y+
To sum up the Cartesian coordinate plane in Processing: • The origin, (0,0), is in the upper-left corner.
• Distance and position are given in pixels.
• The y-axis increases as you move down the sketch window.
In the next project, you’ll put this new knowledge to good use!
FIGUR E 0 -9:
Mathematical Cartesian
coordinate plane vs.
computer Cartesian
PIxEL ART
YOU’VE ALREADY DRAWN YOUR
FI RST LI N E I N PROC ESS I NG,
B UT THAT WAS J UST TH E
GAT H E R YO U R M AT E R I A L S
• Graph paper• Colored pencils • Felt-tip pen
D R A F T I N G YO U R P I X E L A RT
First, you’ll draft your pixelated masterpiece in the physical world. Using your colored pencils, draw a square that is 20 boxes by 20 boxes on a piece of graph paper to represent your sketch win-dow in Processing, and create your image inside that square. Follow these rules to make your image easier to translate into code:
Rule 1 Use only full squares of color—no angles, arcs, or partial squares!
Rule 2 Start by creating something simple, like a smiley face or a house.
Rule 3 Try to use contrasting colors at first. Some subtler shades may not be noticeable when transferred to the computer.
To spark your creativity, Figure 1-1 shows an example of the “unplugged” version of this project that follows the rules just given.
FIGUR E 1-1:
Once you’ve drawn your rough draft, you have some planning to do. Remember the Processing version of the Cartesian coordinate plane from Project 0? That coordinate plane (Figure 1-2) is going to be your best friend from here on out, because Processing uses this plane for specifying locations.
In Processing, a rectangle has an origin just like the sketch window does, as well as a width and height. On your screen, a rectangle’s origin and dimensions will be given in pixels, but for now we’ll count in graph paper squares. Mark the origin of your 20×20 graph paper drawing, and then, using a felt-tip pen that will contrast well against the colors you’ve already used, break up your drawing into the largest rectangles of solid color possible. These larger rectangles will make your drawing much easier to translate into code. In Processing, you must be able to break down a draw-ing into smaller shapes, and since you’re makdraw-ing pixel art, you’ll use rectangles to draw your image. The great thing is that you don’t have to draw each individual pixel: grouping pixels into the largest possible rectangles means you’ll write less code in the long run!
Now mark the upper-left corner of each rectangle in your pixel art, as shown in Figure 1-3. The upper-left corner is that rectangle’s origin, and you’ll need to know this location for each shape you want to draw.
FIGUR E 1-2: Processing’s coordinate plane
The number of rectangles you end up with depends on how many colors you used and the complexity of your design. Usually, the more complex the drawing, the more rectangles you’ll have and the smaller those rectangles will be in size; the inverse usually holds true for simple drawings.
Once you have all of your rectangles outlined and their origins marked, you’re just about ready to translate the image into code. To draw your pixel art in Processing, you need four values from each rectangle: the x- and y-coordinates of the rectangle’s origin with respect to the origin of your 20×20 Cartesian coordinate plane, and the width and height of the rectangle, measured in graph paper squares.
I usually create a table to hold the values for each rectangle, as I’ve done in Table 1-1 for the skull drawing (Figure 1-1). Be sure to group all the rectangles of the same color in your table. Sorting the rectangles by color now will help you avoid further sorting and re arranging when you start translating them into code.
X- COORDINATE
Y- COORDINATE
W I D T H
( I N S Q U A R E S )
H E I G H T
( I N S Q U A R E S ) C O LO R
4 5 1 1 Pink
2 6 2 1 Pink
3 6 2 1 Pink
FIGUR E 1- 3:
The upper-left corner of a rectangle is its origin.
TABLE 1-1:
Rectangles to draw, sorted by color,
X- COORDINATE
Y- COORDINATE
W I D T H
( I N S Q U A R E S )
H E I G H T
( I N S Q U A R E S ) C O LO R
5 7 1 1 Pink
7 7 5 2 Pink
13 7 1 1 Pink
14 6 2 1 Pink
14 5 1 1 Pink
6 8 1 3 Pink
12 8 1 3 Pink
9 9 1 1 Pink
8 10 3 1 Pink
6 11 3 1 Pink
10 11 3 1 Pink
5 12 1 1 Pink
5 12 1 1 Pink
7 12 5 1 Pink
13 12 1 1 Pink
3 13 2 1 Pink
4 14 1 1 Pink
14 13 2 1 Pink
9 13 1 1 Pink
11 13 1 1 Pink
When you have all of the rectangles mapped in the manner shown in Figure 1-2 and Table 1-1, it’s time to jump back into Processing and take your pixel art to the screen!
T R A N S L AT I N G YO U R S K E T C H
I N TO CO D E
void setup()
//draw code goes here and runs over and over again
}
The grayed-out lines of code starting with // are called com-ments. Processing won’t execute any code that is commented out. Comments are normally used to leave information or notes for other people that won’t be read by the computer. We can use comments to “hide” functions from the computer instead of deleting them. It’s a way to turn functions on and off but keep them in place. Here, I’ve included the comments to remind you how the setup() and draw()
functions work.
Tackle the setup() function first: type void setup() followed by an open brace and closed brace, {}. Inside those braces, set the size of your sketch window by calling size() with a width and height of 20 pixels.
void setup() {
size(20,20); }
Now for the draw() loop, which will house all of the code you’ll use to draw your rectangles. Processing has several functions you can use to draw specific shapes, and in this project, you’ll use the
rect() function to create rectangles.
As noted earlier, you need to pass four values, or parameters, to the rect() function, and you must place them in a specific order: the x-coordinate of the top-left corner, the y-coordinate of that corner, the rectangle width, and the rectangle height. For example, calling
rect(100,100,20,30) would draw a 20×30-pixel rectangle starting 100 pixels to the right and 100 pixels down from the sketch origin.
Start by drawing a basic rectangle before you jump into draw-ing rectangles from the table you used to break down your pixel art. Create a draw() loop function, and add a rect() function inside
NOTE
Use comments to label
functions, colors, shapes,
and so on, or to leave notes
to help guide friends who
might read your sketch
the loop. Make sure you don’t forget to add a semicolon! Your code should look something like this:
void draw() {
rect(50,85,150,75); }
Click the Run button, and your sketch window should display a white rectangle outlined in black (Figure 1-4). Success!
But your pixel draft probably includes colors other than white, so how do you change the color of a rectangle?
A D D I N G CO LO R
Processing provides a number of ways to change the color of a draw-ing, including a function called fill() that fills shapes with color, like the paint bucket tool in many graphic design applications.
There are a few ways you can specify color to a computer, but I’ll focus on just one for now: RGB. RGB stands for red green blue, and in this format, each color intensity is represented by a number from 0 to 255, where 0 is no color and 255 is full intensity. The fill()
function accepts three different parameters, which also range from 0 to 255 and represent amounts of red, green, and blue (in that order). You could pass 255, 0, and 0 to the fill() function to fill a shape with only the highest intensity of red. The two zeros tell Processing not to use blue or green.
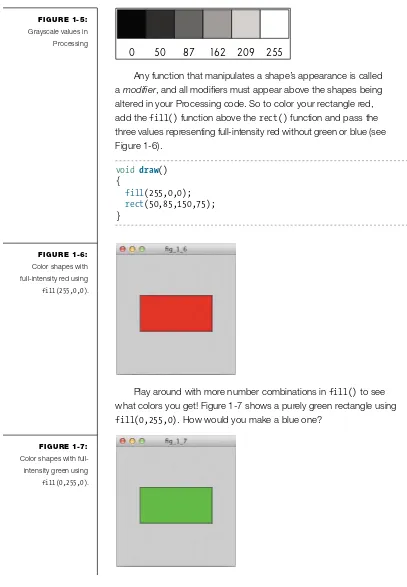
If you use a single 0–255 number, you’ll get a grayscale value, where 0 is black and 255 is white (see Figure 1-5).
0 50 87 162 209 255
Any function that manipulates a shape’s appearance is called a modifier, and all modifiers must appear above the shapes being altered in your Processing code. So to color your rectangle red, add the fill() function above the rect() function and pass the three values representing full-intensity red without green or blue (see Figure 1-6).
void draw() {
fill(255,0,0);
rect(50,85,150,75);
}
Play around with more number combinations in fill() to see what colors you get! Figure 1-7 shows a purely green rectangle using
fill(0,255,0). How would you make a blue one?
FIGUR E 1- 5:
Grayscale values in Processing
FIGUR E 1- 6:
Color shapes with full-intensity red using
fill(255,0,0).
FIGUR E 1-7:
Color shapes with full-intensity green using
Processing also includes a tool that lets you select a specific color. In the menu bar at the top of the code window, click Tools
to access a menu of add-ons that make certain tasks easier. Click
Color Selector to launch the Color Selector tool in a dialog, as shown in Figure 1-8.
Note the RGB values for red, green, and blue. You can use this interface to find the exact color you’re looking for. Select the color you want with your mouse, and the Color Selector displays the color’s RGB value on the right side of the window. Using the Color Selector tool, you can create very detailed images with appropriate colors without having to play an RGB guessing game.
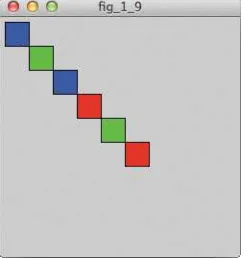
O R D E R M AT T E R S
Remember how you sorted your list of rectangles by color, as shown in Table 1-1? I had you organize them that way to make using the
fill() function easier.
When you add a fill() function to your code, it fills all shapes below it with the color you specify. If you don’t group your rectangles by color, then you might have to call a fill() function for each rectangle! When you call the rect() functions for all rectangles of a particular color in a group, you only have to call fill() once for each color, as in this draw() function for the sketch shown in Figure 1-9.
void setup()
The other popular way to
specify color in Processing
is with hex values, which
are also often used to
specify color in websites
and other digital content.
The Color Selector shows
a hex value in the very last
text field. Use hex values in
your code if you’d prefer,
but I’ll use the RGB setting
throughout this book to
{
fill(0,0,255); //blue rectangles
rect(5,5,25,25); rect(55,55,25,25);
fill(0,255,0); //green rectangles
rect(30,30,25,25); rect(105,105,25,25);
fill(255,0,0); //red rectangles
rect(80,80,25,25); rect(130,130,25,25); }
You called the fill() function only three times, even though the sketch window shows six colored rectangles. Grouping elements of the same color helps to keep your code nice and clean, especially if you leave some whitespace between your color groupings.
Now that you have some experience with creating a rectangle and filling it with color, you can tackle your table of colored rectangles from your pixel art drawing. Start with one color from your drawing, use the Color Selector tool to find the fill color that best matches it, draw all of the rectangles of that color at one time, and then move on to the next color. Click the Run button every so often to check the progress of your image, see if everything is lining up correctly, and confirm that you like the colors you’ve chosen. Continue working this way until you’ve drawn all of your rectangles.
R E M OV I N G O R M O D I F Y I N G
YO U R O U T L I N E S
Each rectangle in your picture probably still has a black outline, which may make your drawing look funny. The outline of a shape is called a
FIGUR E 1-9:
Each rectangle is the same color as the
stroke, and Processing applies a single black stroke to every shape by default. If you don’t like the current stroke, you can modify it or get rid of it completely.
When creating a pixel art image, you really don’t want every rectangle outlined; it ruins the look of using individual pixels! Use the function noStroke() at the top of your draw() loop, as shown here, to remove the stroke from all of the shapes in your sketch, just as I did for the red square in Figure 1-10.
void draw() {
noStroke(); //no outline
fill(255,0,0); //red fill
rect(75,75,100,100); }
If you want a stroke for some shapes, use the stroke() function to add it back to a particular shape or group of shapes. Notice that the stroke() function works just like the fill() function, but it’s for coloring outlines rather than filling entire shapes. You can use an RGB or hex value if you want a specific color; the red square specified here and shown in Figure 1-11 has a blue stroke.
void draw() {
stroke(0,0,255); //blue outline
fill(255,0,0); //red fill
rect(75,75,100,100); }
Remember, if you don’t specify the stroke() of groups of code lines or specify noStroke(), then one stroke() value will be applied to all geometry functions.
S CA L I N G YO U R S K E T C H TO
E P I C P RO P O RT I O N S
You’ve learned to draw basic rectangles, placed them on a Cartesian coordinate plane, filled them with color, and removed their outlines. You should have the coolest tiny pixel art image ever! Your Processing code should look something like Listing 1-1.
void setup () {
size(20,20);
background(0,0,0);
}
void draw() {
noStroke();
fill(188,13,168); rect(4,5,1,1); rect(3,6,2,1); rect(5,7,1,1); rect(7,7,5,2); rect(13,7,1,1); rect(14,6,2,1); rect(14,5,1,1); rect(6,8,1,3); rect(12,8,1,3); rect(9,9,1,1); rect(8,10,3,1); rect(6,11,3,1); rect(10,11,3,1); rect(5,12,1,1); FIGUR E 1-11:
Outlining a single shape
LISTING 1-1:
rect(7,12,5,1); rect(13,12,1,1); rect(3,13,2,1); rect(4,14,1,1); rect(14,13,2,1); rect(14,14,1,1); rect(7,13,1,1); rect(9,13,1,1); rect(11,13,1,1); }
This sketch draws the skull shown in “Drafting Your Pixel Art” on page 18 and in Figure 1-12. The background() function
takes three parameters that represent red, green, and blue, just like fill(), and I used it to color my background black. All of the rectangles in the skull are pink
, just as I defined them in Table 1-1.But that sketch is awfully small. Don’t worry—you can make it bigger.
In Processing, size is all about scale. If you multiply all of the values in your rectangle functions as well as your sketch window size by a factor of 10, your image will come out much larger—in fact, 10 times larger! Check out Listing 1-2 for an example.
void setup () {
size(200,200);
background(0,0,0);
}
void draw() {
noStroke();
fill(188,13,168); rect(40,50,10,10);
FIGUR E 1-12: Skull image at 20×20 pixels
LISTING 1-2:
rect(30,60,20,10); rect(50,70,10,10); rect(70,70,50,20); rect(130,70,10,10); rect(140,60,20,10); rect(140,50,10,10); rect(60,80,10,30); rect(120,80,10,30); rect(90,90,10,10); rect(80,100,30,10); rect(60,110,30,10); rect(100,110,30,10); rect(50,120,10,10); rect(70,120,50,10); rect(130,120,10,10); rect(30,130,20,10); rect(40,140,10,10); rect(140,130,20,10); rect(140,140,10,10); rect(70,130,10,10); rect(90,130,10,10); rect(110,130,10,10); }
Starting with the sketch window size
and moving on to the rectangle locations and dimensions
, I’ve made each value in this sketch 10 times larger. The actual pixel art image (Figure 1-13) is much easier to see now!TA K I N G I T F U RT H E R
If you really like your image and want to share it with others, I highly recommend visiting http://openprocessing.org/. OpenProcessing allows you to upload your sketches to the Web and share not only how they look but also the code that you used to create them. Other people can then check out your projects and even fork your code
FIGUR E 1-13:
Skull image at
and modify it. Modifying other users’ code to see how your changes affect the original image is also a great way to learn how to program in Processing.
HOLIDAY CARD
NOW THAT YOU’RE A
RECTANGLE-D R AW I N G C H A M PI ON , YOU ’ LL
D R AW SOM E OTH ER S H APES
AN D PUT TH EM TO GOO D
U S E . W H AT B ETTER WAY TO
Through the metaphor of a paper collage, you’ll learn how to compose an image using shapes and lines in Processing. I’ll also give you a deeper look at the line() function and how you can modify lines in different ways. Put on your artist’s hat, because here we go!
GAT H E R YO U R M AT E R I A L S
• Colored pencils• Graph paper
D R AW I N G M O R E S H A P E S !
You can draw a number of basic shapes in Processing, and each shape is always defined by points on the Cartesian coordinate plane. Here is a rundown of the basic geometric shapes and the parameters that you need to pass to them.
Ellipses
An ellipse is an oval or circle, and you can draw one in Processing with the ellipse() function. Pass ellipse() four values, just like you would rect(), in this order:
ellipse(X,Y,W,H);
X and Y give the x- and y-coordinates of the ellipse’s position; W
and H indicate the width and height, respectively. If you make W and H
the same value, you’ll draw a circle, as in this example.
void setup() {
size(250,250);
background(150);
}
void draw() {
ellipse(125,125,100,100);
}