INCORPORATING LOAD BALANCING SPATIAL ANALYSIS INTO XML-BASED
WEBGIS
Haosheng Huang
Institute of Geoinformation and Cartography, Vienna University of Technology, 1040 Vienna, Austria – [email protected]
KEY WORDS: WebGIS, XML, GML, SVG, Spatial Analysis, Load Balancing, Performance
ABSTRACT:
This article aims to introduce load balancing spatial analysis into XML-based WebGIS. In contrast to other approaches that implement spatial queries and analyses solely on server or browser sides, load balancing spatial analysis carries out spatial analysis on either the server or the browser sides depending on the execution costs (i.e., network transmission costs and computational costs). In this article, key elements of load balancing middlewares are investigated, and relevant solution is proposed. The comparison with server-side solution, browse-side solution, and our former solution shows that the proposed solution can optimize the execution of spatial analysis, greatly ease the network transmission load between the server and the browser sides, and therefore lead to a better performance. The proposed solution enables users to access high-performance spatial analysis simply via a web browser.
1. INTRODUCTION
Technological advances in the Internet/Web have triggered a move toward Web-based geographic information systems (WebGIS), which aim at providing GIS functionality and services (such as web mapping and spatial analysis) to users through a common web browser, such as Internet Explorer and Firefox. Due to its openness, eXtensible Markup Language (XML) /Geography Markup Language (GML) / Scalable Vector Graphics (SVG) -based solutions have been shown to be promising for building WebGIS (Peng and Zhang, 2004; Chang and Park, 2006, Huang et al., 2011a). Recently, as more and more web browsers start to provide “native” SVG supports, XML-based WebGIS have become increasingly popular.
The ability to support spatial analysis is viewed as one of the key characteristics which distinguish GIS from other information systems. Initial development often adopts a server-side solution to provide spatial analysis in WebGIS, that is, executing all the spatial analytical tasks on the server side, and sending the results to the browser side for visualization (Lin and Huang, 2001; SuperMap 2010). These server-side solutions, sometimes, become impractical, as the server cannot handle a large volume of concurrent requests. Additionally, spatial analysis is a complex task; users often have to try different querying solutions before they are satisfied with the results. As spatial queries often result in a large amount of data (such as intermediate results which users may not need), there will be a high transmission load between the server and the browser sides (Huang et al. 2011a). Recently, in recognition of the limitations and with the advancements in web technologies, browser-side solutions are proposed, in which spatial analysis tasks are executed directly on browser sides (Peng, 1997; Huang et al., 2011a). These browser-side solutions avoid the “bottleneck” problems, and are very promising and appealing due to the rapid performance advancements of normal personal computers (PCs). However, browser-side solutions might also become impractical, as some spatial operations may result in far less
output than input (e.g., estimating the length of a river) and hence need to be implemented on server sides.
It is important to note that these server-side and browser-side solutions are two extreme cases of realizing spatial analysis in WebGIS. Careful study shows that certain operations will give better overall performance if they are executed on the server rather than on the browser, and vice versa. In recognition of the limitations, the concept of load balancing spatial analysis is proposed (Vatsavai et al., 2006; Huang et al., 2011b), in which spatial operations are executed on either the server or the browser sides, depending on execution costs (i.e., network transmission costs and computational costs). The core element of load balancing spatial analysis is a load balancing middleware which distributes a spatial operation to either server or browser sides. However, little work has been done on designing and implementing this middleware.
This goal of this article is to design and implement load balancing middlewares to enable high-performance spatial analysis in XML-based WebGIS. We extend our former work in Huang et al. (2011b), in which a very coarse granularity (by layer) for organizing and transmitting spatial data was employed. In this article, the concept of load balancing spatial analysis is comprehensively studied. More importantly, a finer granularity (by spatial objects) of organizing and transmitting spatial data is proposed, and some more flexible and precise decision rules for distributing spatial operations to server or browser sides are identified. With these, high-performance spatial analysis can be provided to users via a web browser.
The rest of this article is structured as follows. In Section 2, we briefly describe SVG (browser sides)/GML (server sides)-based spatial information representation and spatial analysis. Section 3 discusses the load balancing middlewares. Some case studies are implemented to evaluate the proposed solution in Section 4. Also, comparisons with server-side solution, browser-side solution and our former solution are provided and discussed in International Archives of the Photogrammetry, Remote Sensing and Spatial Information Sciences, Volume XXXIX-B4, 2012
Section 4. Finally, Section 5 draws conclusions and presents future work.
2. SPATIAL ANALYSIS IN XML-BASED WEBGIS
XML/GML/SVG-based solutions have been shown to be a promising approach for building WebGIS. In these solutions, GML is used as a coding, storing and transmitting standard of spatial data on server sides, while SVG is considered as a rendering tool for displaying spatial data on browser sides.
The workflow of spatial analysis includes four steps (Wu, 2002): 1) define the goal and evaluation criteria; 2) represent the needed spatial dataset; 3) carry out spatial querying and analysis with GIS tools; 4) appraise and explain results. Steps 1 and 4 require domain knowledge and are mainly carried out by domain experts. For Steps 2 and 3, GIS tools are needed to support/assist human-computer interaction. In order to provide spatial analysis in XML-based WebGIS, methods to support and assist Steps 2 and 3 are proposed in Huang et al. (2011a). Specifically, for Step 2, SVG/GML-based spatial information representation models which can be used to represent the needed spatial datasets in SVG (browser sides)/ GML (server sides) are designed. Furthermore, for Step 3, some spatial operators and a spatial extended Structured Query Language (SESQL) are implemented to support spatial query and analysis directly on spatial datasets represented in SVG/GML.
2.1 SVG/GML-Based Spatial Information Representation
SVG is developed primarily as a rendering tool for 2D graphics. However, spatial information has a particular way in representing and organizing spatial features and their relationships (such as hierarchical structure of map - layer - spatial object, spatial attributes vs. non-spatial attributes). To represent the needed spatial dataset in SVG, a model considering the characteristics of spatial information is proposed in Huang et al. (2011a). In the model, we use <svg> element to represent Map (the dataset), and use viewBox attribute to represent its bounded range. Layer is represented as <g> element. Point, Curve, Surface are represented as <circle>, <path>, and <path>, respectively. <g> element is also used to represent the Multipoint, Multicurve, Multisurface and Multigeometry. Both spatial and non-spatial attributes of spatial objects are represented as corresponding SVG elements‟ attributes. In the model, if B is PART-OF A, B is represented as a child element of A. For example, Layer is PART-OF Map, so <g> element which represents Layer is a child element of <svg> element which represents Map.
Similarly, a GML-based spatial information presentation model is designed (Huang et al., 2011a). With these models, the needed spatial dataset can be effectively represented in both server (GML) and browser (SVG) sides. An algorithm is also proposed to losslessly covert GML-based dataset to SVG-based dataset, and vice versa.
2.2 Spatial Operators and Spatial Extended SQL
In order to support spatial query and analysis directly on spatial datasets represented in SVG/GML, Huang et al. (2011a) design some spatial operators to access spatial attributes, calculate topological relationships, and perform geometrical operations. Five types of operators are introduced: attribute access operators (GeometryType, Centroid, Length, Area, and Envelope), spatial topological operators (Disjoint, Touch,
Crosses, Within, Overlap, and Contain), spatial order operators (East, East_South, South, West_South, West, West_North, North, and East_North), spatial metric operators (Max_Dist, Min_Dist, and Mean_Dist), and geometrical operators (Intersection, Union, Difference, and Buffer).
In Huang et al. (2011a), these five types of spatial operators are then integrated into a spatial extended SQL (SESQL), which can be used on both server and browser sides for spatial query
and analysis on GML and SVG. For example, a query of “list
cities which are crossed by river ‘R1’” can be implemented as the SESQL sentence “select city.id from city, river where
river.id=’R1’ and crosses (river.d, city.d)=true”. The only difference in applying SESQL for spatial analysis on SVG and GML is the implementation of the SESQL compiler.
3. LOAD BALANCING SPATIAL ANALYSIS
With the above models and methods, spatial analysis can be easily provided in XML-based WebGIS. This section focuses on designing the load balancing middlewares to distribute a spatial query to either server or browser sides based on its cost.
For each spatial query, load balancing middlewares compare the costs of server-side execution (Cserver) and browser-side
execution (Cbrowser). If Cserver is less than Cbrowser, execute the
query on the server, and send the result data to the browser. Otherwise, send the input data to the browser, and carry out the query on the browser. The cost of a spatial query includes computational costs (execution of the query) and network transmission costs (input/output data of the query). As a normal
PC‟s processor performance has been drastically improved, the difference in computational costs between server and browser sides becomes less significant for most of the spatial queries. Therefore, the difference between Cserver and Cbrowser mainly
depends on the network transmission cost. Our discussions below will focus on comparing the network transmission cost.
In our former work Huang et al. (2011b), a simple solution, which employs a very coarse granularity (by layers) for organizing and transmitting spatial data, was proposed to the load balancing middlewares. This article will improve the former work on the following aspects: using a finer granularity (by spatial objects), and identifying more flexible and precise decision rules for distributing spatial operations.
3.1 Load Balancing Middlewares
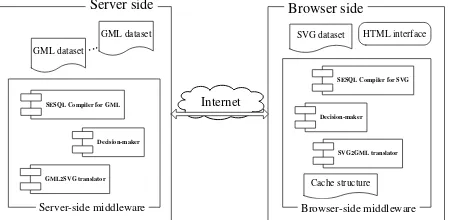
In order to compare network transmission costs and distribute spatial operations, a browser-side middleware and a server-side middleware are designed. Figure 1 shows the architecture.
SESQL Compiler for GML
GML2SVG translator Decision-maker
GML dataset
GML dataset
... SVG dataset
Cache structure
Decision-maker
Server-side middleware Browser-side middleware
Server side Browser side
HTML interface
SESQL Compiler for SVG
Internet
SVG2GML translator
Figure 1. Architecture of the load balancing middlewares International Archives of the Photogrammetry, Remote Sensing and Spatial Information Sciences, Volume XXXIX-B4, 2012
3.1.1 Browser-side Middleware: The browser-side middleware includes an SESQL compiler for SVG, an SVG2GML translator, a cache structure, and a decision-maker. The SESQL compiler carries out syntax, sentence, and semantic analysis for users‟ SESQL sentences. The SVG2GML translator is employed to translate SVG data into GML data.
The cache structure records which spatial data are available on the browser side. Careful studies of different spatial analysis tasks show that spatial objects are a basic unit of many spatial operations. Therefore, a very fine granularity for organizing and transmitting the spatial data is employed: spatial objects as a unit of organizing and transmitting spatial data. The following is the data structure of the cache structure.
Class cache_layer {
String slayerID; //the ID of the layer
ArrayList<string> ObjectIDs; //the IDs of spatial objects //which are available on the browser side
Bool bExecuted; //true if the layer is created by the browser //side’s execution, bExecuted= true also means that the //layer can only be found on the browser side
Bool bAllTransmitted; //true if all the objects in this layer //are available on the browser side
}
ArrayList<cache_layer>Cache; //record the transmitted data
In the above structure, if bExecuted=true, the value of bAllTransmitted will be set as true. This is mainly due to the
fact: an “executed” layer always contains all the spatial objects
which should be in this layer. The value of bAllTransmitted is an important indicator for the decision-maker when a whole layer is involved in a spatial query (i.e., an SESQL sentence).
The decision-maker figures out the needed spatial data (spatial objects) from the FROM and WHERE clauses of the SESQL sentence by invoking the SESQL compiler, and checks whether all the needed spatial data are available on the browser side (by examining the cache structure). If necessary, the decision-maker sends the request to the server-side middleware.
3.1.2 Server-side Middleware: The server-side middleware includes an SESQL compiler for GML, a GML2SVG translator, and a decision-maker. The GML2SVG translator is employed to translate GML data into SVG data. The decision-maker is responsible for receiving the requests from the browser-side middleware, and employing some decision rules to distribute a spatial query to either the server or the browser sides based on the network transmission cost of that query.
3.2 Decision Rules for Distributing Spatial Queries
The general principle of load balancing spatial analysis is to
3.2.1 Decision Rules in Browser-side’s Decision-maker: Every time users submit a spatial query (as an SESQL sentence) through their browser (e.g., Internet Explorer), browser-side‟s decision-maker will figure out the needed input data (spatial objects) from the FROM and WHERE clauses in the SESQL sentence, and check whether the needed spatial data are available on the browser side. If yes, this query will be executed by the SESQL compiler on the browser side. Otherwise, the SESQL sentence, the names (IDs) of the needed input data (only those which are not available on the browser side), and the data size Inputbrowser and names (IDs) of the other input data
whose bExecuted is true (the data can only be found on the browser side) will be sent to server-side‟s decision-maker.
3.2.2 Decision Rules in Server-side’s Decision-maker: Server-side‟s decision-maker receives requests from browser sides, and employs some decision rules for distributing spatial queries. In order to identify these rules, we analyse the spatial operators designed for GML/SVG in Section 2, mainly focusing on comparing the input and output data sizes. When two or more tables (i.e., layers) are involved in an SESQL sentence, the styles of its SQL JOIN should be also considered when comparing the input and output data sizes. For example, an
SESQL sentence like “select intersection (cities.d, rivers.d) from cities, rivers” will return a table with many rows.
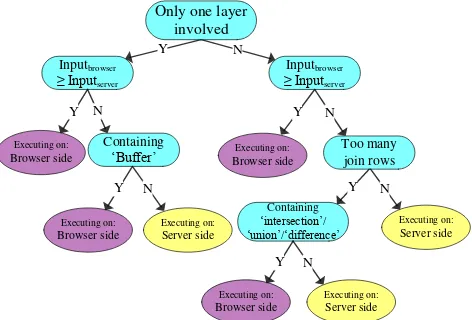
In terms of distribution of input data, two possible cases exist: 1) all the needed input data are available on the server side; 2) the needed input data are located on both browser and server sides. Figures 2 and 3 show the decision trees for them.
Only one layer data are available on the server side
Inputbrowser
Browser side Browser sideExecuting on:
Executing on:
Figure 3. Decision tree for the case when the needed input data are located on both browser and server sides International Archives of the Photogrammetry, Remote Sensing and Spatial Information Sciences, Volume XXXIX-B4, 2012
In both cases, if more than one layer is involved in the current SESQL sentence, we further estimate the number of result rows. If it is bigger than the total number of input rows, we consider the current SESQL query generating “too many join rows”. In Figure 3, the Inputbrowser is the data size of the needed input data
which can only be found on the browser side, while Inputserver is
the data size of the rest input data. The rest input data can be found on the server side.
With the above rules, decisions on where to execute a SESQL sentence can be made. After execution, the cache structure on the browser-side middleware will be updated accordingly.
4. IMPLEMENTATION, CASE STUDIES AND DISCUSSIONS
4.1 Implementation
For the server-side middleware, spatial operators, SESQL compiler, GML2SVG, and decision-maker are implemented as Java Servlets. Specifically, JTS Topology Suite is employed to implement the spatial operators. As SESQL is based on the original SQL, we adapt the C++ codes provided in Levine et al. (1992), and implement our own SESQL compiler by combining the spatial operators. For the browser-side middleware, SESQL compiler, SVG2GML, decision-maker, and cache structure are implemented using JavaScript. We implement spatial operators with JTS Topology Suite, and develop them as Java Applet. Google Gears API * provides an SQLite compiler with based API. We therefore implement a JavaScript-based SESQL compiler with the Gears API. For spatial operators embedded in the SESQL sentences, JavaScript invokes the developed Java applet to execute the corresponding spatial operations. JavaScript DOM API is also used to assess/update SVG documents on the browser side. In order to facilitate the interaction between the server-side and the browser-side middlewares, we use AJAX (Asynchronous JavaScript and XML) technology.
It is important to note that the load balancing middlewares are completely transparent to the end users. Users can access spatial analysis functions simply with an SVG-enabled web browser, such as Internet Explorer, Firefox, and Google Chrome.
4.2 Case Studies and Discussions
We design three case studies to evaluate the proposed solution as proof of concept. These case studies use geospatial data of Guangdong Province (China), and implement several spatial analysis tasks. In the case studies, comparisons among the proposed solution, server-side solution, browser-side solution and our former solution (Huang et al., 2011b) are also made.
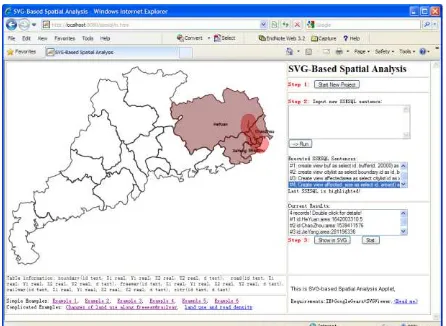
4.2.1 Case Study 1: Suppose there is some toxic contamination throughout river “R1”. The contamination affects the areas that are within 20 km. This task is to list all affected administrative districts and calculate their affected area size.
In order to investigate this issue, we have to create a buffer for
river “R1”, and find out which administrative districts are overlapped with this buffer, and then calculate the size of overlapped area for each district. We carry out this task based on the workflow described in Section 2. First, we identify the
*
Google has stopped its support for Gears API. However, similar functions can be found on HTML 5‟s LocalStorage.
needed data and the evaluation criteria by carefully analysing this case study. And then based on the suggested model in Section 2, we use GML to represent the needed spatial data (river layer) on the server side. We also represent the district boundary layer in SVG and deliver it to the browser side as the initial User Interface (UI). We then submit SESQL sentences on the browser side to carry out the spatial queries by the following steps: 1) Calculate a 20 km buffer of river “R1” (using Buffer operator); 2) Find out all the districts which are overlapped by this buffer (using Overlap operator); 3) Find out all the affected areas in each district (using Intersection operator); 4) Calculate the size of affected area in each district (using Area operator). The SESQL sentences are listed in the Appendix.
Figure 4 depicts the results. It lists the names of affected districts, and their affected sizes in the listbox at the right-bottom corner. These districts are also highlighted in the map.
Figure 4. Listing all the administrative districts affected by river
“R1”, and calculating their affected area size
To illustrate the advantages of the proposed solution, we compare it with different solutions: server-side solution, browse-side solution, and layer-based load balancing solution (i.e., our former solution in Huang et al. (2011b)). We mainly compare the data amount of the network transmission (excluding the request/response sentences) between the server and the browser sides. Table 1 depicts the results. The difference between layer-based solution and the proposed solution is mainly due to their employed granularities (layers versus spatial objects). To sum up, the proposed solution has a smaller network transmission load between server and browser sides, and therefore leads to a better performance.
Server-side solution
Client-side solution
Layer-based solution
The proposed solution Step1:
Buffer
1,925 36,559 36,559 (on browser)
5,082 (on browser) Step2:
Overlap
5,267 0 0 (on
browser)
0 (on
browser) Step3:
Intersection
3,095 0 0 (on
browser)
0 (on
browser)
Step4: Area 106 0 0 (on
browser)
0 (on
browser)
Total 10,393 36,559 36,559 5,082
Table 1. Comparisons of the first case study (data amount is measured by Byte)
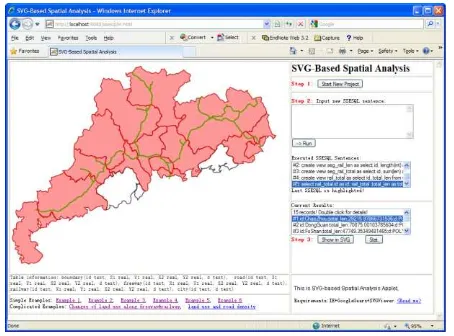
4.2.2 Case Study 2: Case study 2 tries to compute the length of railways in each of the administrative districts they pass through. Similar to case study 1, we use GML to represent the needed spatial data (railway layer) on the server side. We also represent the district boundary layer in SVG and deliver it to the browser side as the initial UI. The task is carried out by the following steps: 1) compute the railway segments in each district (using Intersection operator); 2) calculate the length of each railway segment (using Length operator); 3) sum up all the railway segments for each district; 4) filter out districts which have no railways. The SESQL sentences are listed in the Appendix. Figure 5 depicts the results. It lists the names of all relevant districts, and their lengths of railways in the listbox shown at the right-bottom corner. These districts are also highlighted in the map view.
Figure 5. Listing the length of railways in each of the administrative districts they pass through
We also compare the amount of transmitted data when using different solutions for accomplishing this task. Table 2 depicts the results, and shows that our proposed solution has a smaller network transmission load between server and browser sides.
Server-side solution
Client-side solution
Layer-based solution
The proposed solution
Step1: Buffer
28,493 7,211 28,493 (on server)
7,211 (on browser) Step2:
Length
9,925 0 0 (on
browser)
0 (on
browser) Step3:
SUM
648 0 0 (on
browser)
0 (on
browser) Step4:
Filter
582 0 0 (on
browser)
0 (on
browser)
Total 39,648 7,211 28,493 7,211
Table 2. Comparisons of the second case study (data amount is measured by Byte)
4.2.3 Case Study 3: Case study 3 focuses on how land uses of each administrative district along railway “Guang-Mei-Shan” change between 1987 and 1996. Similarly, we use GML to represent the needed spatial data (railway and district-centre layers) on the server side. We also represent the district boundary layer in SVG and deliver it to the browser side as the initial UI.
The task is carried out by the following steps: 1) calculate a 20
km buffer of railway “Guang-Mei-Shan” (using Buffer
operator); 2) identify the districts whose centres are located in this buffer (using Within operator); 3) Use the statistics function to generate the bar graphs of changes of land uses for every identified district. The SESQL sentences are listed in the Appendix. Figure 6 depicts the results. It lists the names of all relevant districts in the right-bottom listbox. Each district and its land use statistics are also highlighted in the map view.
Figure 6. How the land uses along railway “Guang-Mei-Shan” change between 1987 and 1996
Table 3 compares the amount of transmitted data when using different solutions for accomplishing this task.
Server-side solution
Client-side solution
Layer-based solution
The proposed solution
Step1: Buffer
7,892 7,211 7,211 (on server)
1817 (on browser) Step2:
Within
92 1,728 1,728 (on
browser)
1,728(on browser) Step3:
Stat.
723 3,946 723 (on
server)
723 (on
server)
Total 8,707 12,885 9,662 4,268
Table 3. Comparisons of the third case study (data amount is measured by Byte)
4.3 Discussions
The implementation of the above three case studies shows that the proposed solution is feasible and operable to enable load balancing spatial analysis in XML-based WebGIS. The comparison with server-side solution and browser-side solution also shows that load balancing solution can optimize the execution of spatial analysis, and therefore greatly ease the network transmission load between server and browser sides. With the proposed solution, high-performance spatial analysis can be easily provided in XML-based WebGIS. The comparison with our former solution (i.e., layer-based solution) shows that using spatial objects as a unit of organizing and transmitting spatial data can provide a better performance than using layers as a unit. It also reveals the importance of developing a more precise decision rule. To sum up, the proposed load balancing spatial analysis can enable users with high-performance spatial analysis in the Web environment.
However, it is important to note that the load balancing middlewares in the current solution check/scan SESQL sentences one by one. In order to provide a better performance, neighbouring SESQL sentences might be checked and considered together. In the meantime, we are aware that the decision rules identified are still quite simple and static, and needed to be improved further. Currently, we are trying to use machine learning methods to mine the application logs to improve the current rules.
5. CONCLUSIONS AND FUTURE WORK
Spatial analysis plays a key role in GIS. In order to meet the increasing demand of spatial information applications in the Web, spatial analysis should be provided into WebGIS. This article aims to incorporate load balancing spatial analysis into XML-based WebGIS. Compared to other approaches that implement spatial queries and analyses solely on the server or browser sides, load balancing spatial analysis carries out spatial analysis either on the server or the browser sides depending on the network communication cost and the computational cost. This article mainly focuses on designing the load balancing middlewares. Comparison with other solutions shows that the proposed load balancing solution can optimize the execution of spatial analysis, and therefore lead to a better performance.
The contributions of this article are: 1) proposing a finer granularity (by spatial objects) of transmitting spatial data in load balancing middlewares; 2) identifying more flexible and precise decision rules for distributing spatial operations to server or browser sides; 3) enabling high-performance spatial analysis in XML-based WebGIS.
Our next step is to evaluate the proposed solution with more complex case studies. We are also interested in using machine learning methods to identify decision rules from application logs. Query optimization in SQL research might also provide some hints on improving the load balancing middlewares. Furthermore, the proposed solution is not only suitable for XML-based WebGIS. Therefore, application of the proposed solution in other WebGIS will be investigated.
REFERENCE
Chang, Y., Park, H., 2006. XML Web Service-based development model for Internet GIS applications. IJGIS, 20(4), pp. 371- 399.
Huang, H., Li, Y., Gartner, G., Wang, Y., 2011a. An SVG-based method to support spatial analysis in XML/GML/SVG-based WebGIS. IJGIS, 25(10), pp. 1561-1574.
Huang, H., Li, Y., Gartner, G., 2011b. A load balancing method to support spatial analysis in XML/GML/SVG-based WebGIS. In: Advances in Web-based GIS, Mapping Services, and Applications, Li, S. Dragicevic, S., Veenendaal, B. (Eds.), CRC Press, pp. 153-168.
Levine, J. Mason, T., Brown, D. 1992. Lex & Yacc (2nd). O'Reilly & Associates.
Lin, H., Huang, B. 2001. SQL/SDA: A query language for supporting spatial data analysis and its web-based implementation. IEEE Transactions on Knowledge and Data Engineering (TKDE), 13(4), pp. 671-682.
Peng, Z., 1997. An assessment of the development of internet gis. In: Proceedings of the ESRI User Conference.
Peng, Z., Zhang, C., 2004. The roles of geography markup language (GML), scalable vector graphics (SVG), and Web feature service (WFS) specifications in the development of Internet geographic information systems (GIS). Journal of Geographical Systems, 6(2), pp. 95-116.
SuperMap, 2010. SuperMap IS.NET 2008. http://www .supermap.com.cn/gb/products/fwskf.htm (Mar. 2010).
Vatsavai, R., Shekhar, S., Burk, T., Lime, S., 2006. UMN-MapServer: A High-Performance, Interoperable, and Open Source Web Mapping and Geo-Spatial Analysis System. In: GIScience 2006, Raubal, M. (Eds.), Springer, pp. 400-417.
Wu, X. 2002. Principles and methods of GIS (in Chinese), Publishing House of Electronics Industry, Beijing.
APPENDIX. SESQL SENTENCES IN CASE STUDIES
Case Study 1
1) Calculate a 20 km buffer of river “R1”:
create view bf as select id, buffer(d, 20000) as buf from river
where ID=”R1”
2) Find out all the districts which overlay with this buffer : create view citylist as select boundary.id as id, boundary.d as d from boundary, bf where (overlap(boundary.d, bf.buf) = true)
3) Find out all the affected areas in each district:
Create view affectedarea as select citylist.id as id, intersection (citylist.d, bf.buf) as d from citylist, bf
4) Calculate the size of affected area in each district: Select id, area(d) as area from affectedarea
Case Study 2
1) Compute the railway segments in each district:
Create view seg_r as select boundary.id as id, intersection (boundary.d, railway.d) as int from boundary, railway
2) Calculate the length of each railway segment:
create view seg_r_len as select id, length(int) as len from seg_r
3) Sum up all the railway segments for each district:
create view seg_r_total as select id, sum(len) as total_len from seg_r_len group by id
4) Filter out districts which have no railways:
Select id, total_len from seg_r_total where total_len>0
Case Study 3
1) Calculate a 20 km buffer of railway “Guang-Mei-Shan”: create view buf as select id, buffer(d, 20000) as buf from railway where (id='Guang-Mei-Shan')
2) Identify the districts whose centres are located in this buffer: Select city.id from city, buf where (within(city.d,buf.buf)=true) International Archives of the Photogrammetry, Remote Sensing and Spatial Information Sciences, Volume XXXIX-B4, 2012