METHODOLOGY FOR DETERMINING OPTIMAL EXPOSURE PARAMETERS OF A
HYPERSPECTRAL SCANNING SENSOR
P.Walczykowski a, K. Siok a, A. Jenerowicz a, *
a MUT, Military University of Technology, Faculty of Civil Engineering and Geodesy, Geodesy Institute,
Department of Remote Sensing and Photogrammetry - (piotr.walczykowski; katarzyna.siok; agnieszka.jenerowicz)@wat.edu.pl
Commission I, ICWG I/Vb
KEY WORDS: hyperspectral scanning sensor, exposure parameters, spatial resolution, terrestrial, GSD, Headwall, UAV
ABSTRACT:
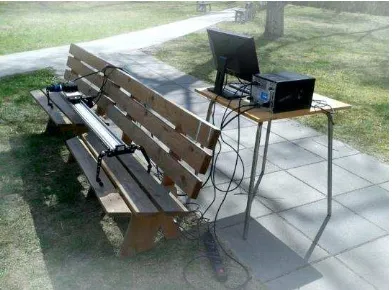
The purpose of the presented research was to establish a methodology that would allow the registration of hyperspectral images with a defined spatial resolution on a horizontal plane. The results obtained within this research could then be used to establish the optimum sensor and flight parameters for collecting aerial imagery data using an UAV or other aerial system. The methodology is based on an user-selected optimal camera exposure parameters (i.e. time, gain value) and flight parameters (i.e. altitude, velocity). A push-broom hyperspectral imager- the Headwall MicroHyperspec A-series VNIR was used to conduct this research. The measurement station consisted of the following equipment: a hyperspectral camera MicroHyperspec A-series VNIR, a personal computer with HyperSpec III software, a slider system which guaranteed the stable motion of the sensor system, a white reference panel and a Siemens star, which was used to evaluate the spatial resolution.
Hyperspectral images were recorded at different distances between the sensor and the target- from 5m to 100m. During the registration process of each acquired image, many exposure parameters were changed, such as: the aperture value, exposure time and
speed of the camera’s movement on the slider. Based on all of the registered hyperspectral images, some dependencies between chosen parameters had been developed:
the Ground Sampling Distance – GSD and the distance between the sensor and the target, the speed of the camera and the distance between the sensor and the target,
the exposure time and the gain value, the Density Number and the gain value.
The developed methodology allowed us to determine the speed and the altitude of an unmanned aerial vehicle on which the sensor would be mounted, ensuring that the registered hyperspectral images have the required spatial resolution.
* Corresponding author
1. INTRODUCTION
Nowadays, unmanned aerial vehicles are commonly used both for the military operations and civilian applications. The development of new technologies in avionics and imagining sensors influenced the creation of new structures of UAVs that are dedicated for acquisition of geospatial information. Specially designed flying platforms allow for installation of digital sensors, that can be characterized with different spatial, spectral and radiometric resolutions. Currently, the hyperspectral imagery is one of the most important data used in various remote sensing applications. Those data type, in comparison to the multispectral data significantly had facilitate the process of identification and analysis of investigated objects (e.g. Zagajewski, 2010; J Quin, 2012; Mariotto et al., 2012; Sawicki, 2012; Jianwei et al., 2013; Kedzierski et al., 2014; Marshall and Thenkabail, 2015; Jiangbo Li et al., 2016; Vaglio et al., 2016). The combination of the information capacity of hundreds of spectral channels with a relatively rapid data acquisition, certainly has a great impact on dynamic development of remote sensing techniques.
Hyperspectral imaging data obtained from low altitudes are increasingly used by scientists around the world. Authors
(Lehmann et al., 2015) used hyperspectral data obtained with low altitudes to detect forests’ damage caused by insects. In agricultural applications, low latitude hyperspectral data were used to monitor the health status of olive orchards (Calderón et al., 2013) and citrus (Garcia-Ruiz, 2013). Authors (Zarco-Tejada et al., 2012) had used hyperspectral data for detection of water stress in plants. Moreover hyperspectral data obtained from low altitudes are used for very accurate analysis of vegetation, that includes an evaluation of the content of chlorophyll and green biomass (Lucieer et al., 2014). Hyperspectral images obtained with UAV platforms were also used to estimate the content of carotenoids in the leaves of the vine (Zarco-Tejada et al., 2012). As can be observed hyperspectral data can be used in many areas of research- their applications are only limited by the imagination of researchers.
This article presents the methodology that allows the registration of hyperspectral images with a defined spatial resolution on a horizontal plane and allows for determination of optimal exposure parameters for push- broom hyperspectral sensor. The results obtained within this research could then be used to establish the optimum sensor and flight parameters for collecting aerial imagery data using an UAV or other aerial system. The methodology is based on an user-selected optimal The International Archives of the Photogrammetry, Remote Sensing and Spatial Information Sciences, Volume XLI-B1, 2016
camera exposure parameters (i.e. time, gain value) and flight parameters (i.e. altitude, velocity). The developed methodology allow to determine the speed and the altitude of an unmanned aerial vehicle on which the sensor would be mounted, ensuring that the registered hyperspectral images have the required spatial resolution. The methodology developed on the basis of hundreds of measurements can support the process of image acquisition with push- broom camera. The user would have only to select some input data, such as: the exposure time, the gain value and expected value of GSD. When such data are input into the algorithm the user is shown the values of the following parameters: the minimum and maximum value of GSD, the required altitude of flight, the flight speed and the sensor swath width.
2. SPECIFICATION OF PUS- BROOM CAMERA
In presented research work the research team from the Military University of Technology, the Faculty of Civil Engineering and Geodesy, the Department of Remote Sensing and Photogrammetry had used the push-broom hyperspectral imager- the Headwall MicroHyperspec A-series VNIR. That
sensor’s type allows for continuous recording of the image line by line.
Figure 1. The push-broom hyperspectral imager- the Headwall MicroHyperspec A-series VNIR
Registration of images with this type of scanner is only possible when there is motion of sensor or the object is moving. For purpose of this paper, research data were obtained through flight simulation- therefore the camera was placed on the slider that provoked the motion of the scanner.
Figure 2. Example of measurement station
This hyperspectral scanner allows for registration of images with 324 spectral channels with a 1.9 nm spectral bandwidth in the 380- 1000 nm range. In addition to that, the camera can be characterized by a relatively small weight approximately to 0.68 kg, therefore can be easily mounted on dedicated UAVs or aerial platforms.
Software dedicated for the sensor- HyperSpec III, allows for
camera’s control and selection of exposure parameters, i.e. the exposure time, the gain value, the number of frames per second.
3. THE DEVELOPMENT OF THE METHODOLOGY
The research work presented in this paper, was conducted to determine some dependencies between chosen parameters:
the Ground Sampling Distance – GSD and the distance between the sensor and the target,
the speed of the camera and the distance between the sensor and the target,
the exposure time and the gain value,
the Density Number and the gain value.
Presented dependencies were determined on the basis of hundreds of images acquired with Headwall hyperspectral camera. All conducted experiments were done under favourable weather conditions, i.e. in the absence of precipitation, air temperature above 10°C and a relatively delicate breeze. During conducted measurements and image acquisitions, the light meter was used to control the light intensity at the time of individual image registration.
Depending on the light intensity and the distance between the sensor and the target distance the following camera parameters were being changed: the camera aperture, the exposure time, the gain value, speed of the camera.
The first part of presented study was focused on determination of the pixel dimensions on the ground.
First, for the calculation of the GSD value in For the calculation of GSD in a transverse direction to the movement of the camera, a following formula was developed: a transverse direction to the flight [m]
f = focal length H = flight height [m]
α= the angle of inclination between the optical axis and the plumb line
pixel = single detector size
During the imagery acquisition the angle of inclination was equal to 0°. When imagery is acquired with camera mounted on UAV platform the consideration of the angle α is mandatory. In addition, the GSD values were calculated on the basis of acquired images with a Siemens star (consisting of 96 sectors), that is commonly used as test to determine spatial resolution (Dabrowski et al., 2015; Orych, 2015). Some of acquired images was used for the accuracy control of determined GSD values.
The relationship between the GSD value in a transverse
direction to the camera’s flight and the distance to the target can
be easily presented on the diagram (Figure 3).
Figure 3. The relationship between the GSD value in a
transverse direction to the camera’s flight and the distance to
the target
With the increase of the distance between the sensor and the target, the spatial resolution of acquired image is decreasing (the size of pixel dimension on the ground is increasing). For investigated hyperspectral sensor it can be described by the formula (2):
0.0015
t
GSD H (2)
where: GSDt = the pixel dimension on the ground in a transverse direction to the flight [m]
H = flight height [m]
On the other hand the size of pixel on the ground in the
direction of the flight depends on the flight speed and camera’s
exposure parameters, according to formula (3):
d g
GSD w t v (3)
where: GSDd = the pixel dimension on the ground in the direction of the flight [m]
wg = factor that depends on the gain value t = the exposure time [ms]
v = the flight speed [km/h]
The GSD value in the direction of the flight not only depends on exposure parameters, but also on the flight speed, that depends on the altitude of the sensor during imagery acquisition. The greater the distance between the sensor and the target, the flight speed is relatively greater. The conducted investigation allowed to determine formula that describes this relationship for the used Headwall push- broom scanner (4):
0.004
v H (4)
Along with the change of atmospheric and luminance
conditions it is necessary to change the camera’s exposure
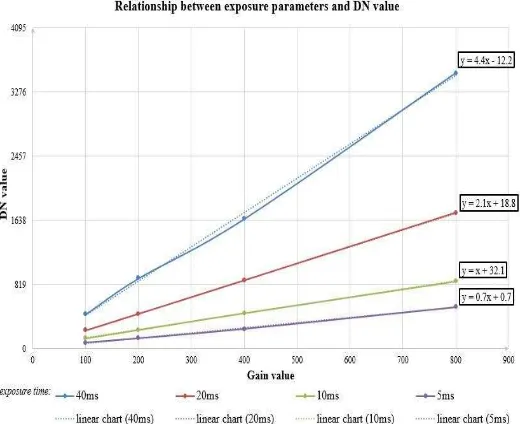
parameters. For the Headwall camera it is possible to change the exposure time and the gain level. During the conducted experiment, dozens of images with different exposure times (i.e.: 40ms, 20ms, 10ms, 5ms and gain values (i.e.: 800, 400, 200, 100) were acquired. The relationship between the exposure parameters and DN value is shown on the Figure 4.
Figure 4. The relationship between the DN value and exposure parameters
The Figure 4 presents how the DN value is changing with different exposure parameters. The change of those parameters can be approximated with line functions.
When we want to use formula (3) we have to assume that one of the exposure parameters is constant, i.e. the exposure time or the gain value. Along with greater values of exposure parameters it is possible to obtain greater range of DN values- the radiometric range is greater, therefore the interpretation capacity of such image is greater (Orych et al., 2014).
4. SUMMARY
Presented experiments and analyses of hyperspectral images that were obtained in different light conditions and different distance between the sensor and the target led to development of the methodology that allows to determine the speed and the altitude of an unmanned aerial vehicle on which the sensor would be mounted, ensuring that the registered hyperspectral images have the required spatial resolution.
After analyses of geometric properties of the scanner sensor, it was also possible to determine the maximum and the minimum values of GSD during the image acquisition- when the CCD detectors of the imaging sensor are not parallel to the imaged terrain (Figure 5, Figure 6).
Figure 5. The diagram of image acquisition with electro- optic scanner (A)
Figure 6. The diagram of image acquisition with electro- optic scanner (B)
The value of angle γ (equal to the half of FOV of the camera) was calculated on the basis of value of focal length of camera and the dimensions of line of detectors.
The calculated value was taken into account when determining the minimum and maximum pixel dimension and the range of CCD line on the ground. The minimum and maximum GSD values were calculated based on the following equations (5), (6):
min
pixel
GSD H
f
(5)
max
pixel
GSD H
f
(6)
where: GSDmin = the minimum pixel dimension on the ground in the transverse direction to the flight [m]
GSDmax = the maximum pixel dimension on the ground in the transverse direction to the flight [m] Hα-γ = the distance to the first pixel in the line (the closest to the plumb line) [m]- Figure 5
Hα+γ = the distance to the last pixel in the line (the farthest from the plumb line) [m]- Figure 5
f = focal length pixel = single detector
Therefore the range of sensor line- Z on the ground in the transverse direction to the flight can be calculated from the equation (7):
Z H tg
tg
(7)The developed methodology allows to determine the values of individual parameters in order to obtain the square pixel. In fact, in the case of push- broom scanner, it is very difficult acquire image where GSD values in two directions would be equal. For the investigated camera the pixel would have the same dimensions in two directions (0.07 x 0.07 m) for the flight altitude 500 m if the flying platform would be moving with the speed of 7.2 km/ h (which in practice is far too slow) and the exposure parameters of the camera would be: the exposure time: 10 ms, the gain level: 200.
All obtained results will simplify the image registration process with Headwall MicroHyperspec A-series VNIR camera placed on UAV. The developed methodology allowed to determine the speed and the altitude of an unmanned aerial vehicle on which the sensor would be mounted, ensuring that the registered hyperspectral images have the required spatial resolution. The input data are: the exposure time, the gain value and expected value of GSD. When such data are input into the algorithm the user is shown the values of the following parameters: the minimum and maximum value of GSD, the required altitude of flight, the flight speed and the sensor swath width.
ACKNOWLEDGEMENTS
The presented article is part of research work carried out in the research project PBS 933/2016 financed by the Military University of Technology, the Faculty of Civil Engineering and Geodesy, Department of Remote Sensing and Photogrammetry.
REFERENCES
Calderón, R., Navas-Cortés, J.A., Lucena, C., Zarco-Tejada, P.J., 2013. High-resolution airborne hyperspectral and thermal imagery for early detection of verticillium wilt of olive using fluorescence, temperature and narrow-band spectral indices. Remote Sens. Environ., 139, pp. 231–245.
Dabrowski, R., Orych, A., Jenerowicz, A., Walczykowski, P., 2015. Preliminary results from the Portable Imagery Quality Assessment Test Field (PIQuAT) of UAV imagery for imagery reconnaissance purposes, International Archives of the Photogrammetry, Remote Sensing and Spatial Information Sciences, 2015, XL-1/ W4, pp. 111-115.
Garcia-Ruiz, F., Sankaran, S., Maja, J.M., Lee, W.S., Rasmussen, J., Ehsani R., 2013. Comparison of two aerial imaging platforms for identification of Huanglongbing-infected citrus trees. Comput. Electron. Agric., 91, pp. 106–115.
Jiangbo Li, Liping Chen, Wenqian Huang, Qingyan Wang, Baohua Zhang, Xi Tian, Shuxiang Fan, Bin Li, 2016. Multispectral detection of skin defects of bi-colored peaches The International Archives of the Photogrammetry, Remote Sensing and Spatial Information Sciences, Volume XLI-B1, 2016
based on vis–NIR hyperspectral imaging, Postharvest Biology and Technology, Volume 112, February 2016, pp. 121-133.
Jianwei Q., Kuanglin, C., Moon S. K., Renfu. L., Lu, Burks, T. F., 2013. Hyperspectral and multispectral imaging for evaluating food safety and quality, Journal of Food Engineering, Volume 118, Issue 2, September 2013, pp. 157-171.
J Qin, 2012. 2 - Hyperspectral and multispectral imaging in the food and beverage industries, In Woodhead Publishing Series in Food Science, Technology and Nutrition, edited by Da-Wen Sun,, Woodhead Publishing, 2012, pp. 27-63.
Kędzierski M., Fryśkowska A., Wierzbicki D., 2014.
Opracowania fotogrametryczne z niskich pułapów, Wojskowa Akademia Techniczna, Warszawa.
Lehmann, J.R., Nieberding, F., Prinz, T., Knoth, C., 2015. Analysis of unmanned aerial system-based CIR images in forestry—A new perspective to monitor pest infestation levels. Forests, 6, pp. 594–612.
Lucieer, A., Malenovsky, Z., Veness, T., Wallace, L., 2014. HyperUAS – Imaging spectroscopy from a multirotor unmanned aircraft system, Journal of Field Robotics, 31 (4), pp. 571-590.
Mariotto, I., Thenkabail, P. S., Huete, A., Slonecker, E. T., Platonov, A., 2013. Hyperspectral versus multispectral crop-productivity modeling and type discrimination for the HyspIRI mission, Remote Sensing of Environment, Volume 139, December 2013, pp. 291-305.
Marshall, M., Thenkabail, P., 2015. Advantage of hyperspectral EO-1 Hyperion over multispectral IKONOS, GeoEye-1, WorldView-2, Landsat ETM+, and MODIS vegetation indices in crop biomass estimation, ISPRS Journal of Photogrammetry and Remote Sensing, Volume 108, October 2015, pp. 205-218.
Orych, A., 2015. Review of methods for determining the spatial resolution of UAV sensors, International Archives of the Photogrammetry, Remote Sensing and Spatial Information Sciences, 2015, XL-1/ W4, pp. 391-395.
Orych, A., Walczykowski, P., Jenerowicz, A., Zdunek, Z., 2014. Impact of the Cameras Radiometric Resolution on the Accuracy of Determining Spectral Reflectance Coefficients, International Archives of the Photogrammetry, Remote Sensing and Spatial Information Sciences, 2014, XL-1,pp. 347-349.
Sawicki P., 2012. Bezzałogowe aparaty latające UAV w
fotogrametrii i teledetekcji – stan obecny i kierunki rozwoju, Archiwum Fotogrametrii, Kartografii i Teledetekcji, Olsztyn.
Vaglio Laurin, G., Puletti, N., Hawthorne, W., Liesenberg, V., Corona, P., Papale, D., Chen, Q., Valentini, R., 2016. Discrimination of tropical forest types, dominant species, and mapping of functional guilds by hyperspectral and simulated multispectral Sentinel-2 data, Remote Sensing of Environment, Volume 176, April 2016, pp. 163-176
Zagajewski B., 2010. Podstawy teledetekcji hiperspektralnej,
Ocena przydatności sieci neuronowych i danych hiperspektralnych do klasyfikacji roślinności Tatr Wysokich, Teledetekcja Środowiska.
Zarco-Tejada, P.J., González-Dugo, V., Berni, J.A.J. 2012. Fluorescence, temperature and narrow-band indices acquired from a UAV platform for water stress detection using a micro-hyperspectral imager and a thermal camera. Remote Sens. Environ., 117, pp. 322–337.
Zarco-Tejada, P.J., Guillén-Climent, M.L., Hernández-Clemente R., Catalina, A., González, M.R., Martín P., 2013. Estimating leaf carotenoid content in vineyards using high resolution hyperspectral imagery acquired from an unmanned aerial vehicle (UAV), Agricultural and Forest Meteorology, Vol. 171-172, pp. 281–294.
Revised June 2015