EVALUATION DIGITAL ELEVATION MODEL GENERATED BY SYNTHETIC
APERTURE RADAR DATA
H. B. Makineci a*, H. Karabörk a a
Selcuk University, Engineering Faculty, 42075 Selcuklu Konya, Turkey - (bilgehanmakineci, karabork)@selcuk.edu.tr
Commission I, WG I/2
KEY WORDS: Interferometry, RADAR, Digital Elevation Model, European Space Agency, Sentinel1-A, Interferometry Wide
Swath, Synthetic Aperture Radar, SAR, DEM
ABSTRACT:
Digital elevation model, showing the physical and topographical situation of the earth, is defined a tree-dimensional digital model obtained from the elevation of the surface by using of selected an appropriate interpolation method. DEMs are used in many areas such as management of natural resources, engineering and infrastructure projects, disaster and risk analysis, archaeology, security, aviation, forestry, energy, topographic mapping, landslide and flood analysis, Geographic Information Systems (GIS). Digital elevation models, which are the fundamental components of cartography, is calculated by many methods. Digital elevation models can be obtained terrestrial methods or data obtained by digitization of maps by processing the digital platform in general. Today, Digital elevation model data is generated by the processing of stereo optical satellite images, radar images (radargrammetry, interferometry) and lidar data using remote sensing and photogrammetric techniques with the help of improving technology. One of the fundamental components of remote sensing radar technology is very advanced nowadays. In response to this progress it began to be used more frequently in various fields. Determining the shape of topography and creating digital elevation model comes the beginning topics of these areas.
It is aimed in this work , the differences of evaluation of quality between Sentinel-1A SAR image ,which is sent by European Space Agency ESA and Interferometry Wide Swath imaging mode and C band type , and DTED-2 (Digital Terrain Elevation Data) and application between them. The application includes RMS static method for detecting precision of data. Results show us to variance of points make a high decrease from mountain area to plane area.
1. INTRODUCTION
Learning about our planet in every aspect is very important for human life. In these days, some different developments make our ideas smaller. Digital Elevation Models that are used for visualising the earth are growing with update technology. Radar technology and connected technologies like SAR, inSAR, DInsar etc. grow up day by day fast. To determine on deformation of megacity there is a work about DInsar for monitoring deformation. (Calò, 2015) Furthermore, DEM obtained from InSAR technic is evaluated and analysed. (Sefercik, 2007) And also DEM was researched by almost all different areas like mountainous or plane.(Liao,2007) In addition to all, different works were done by several researchers in this topic and close to this topic. To compare band differences on interferometric SAR has produced very strong and different results. (Lanari, 1996) For sure these works make this topic important and help to improve recent years. Some kind of software has been written for process of SAR data and every kind of software varied from algorithmic combinations. Open source software are generally used but new generation windows software is released to the internet with any payment. In this work we used ESA’s S1 SNAP toolbox of special Sentinel-1A generated from The NEST software. In contrast of this, Doris and StamPS are useful open sources software that was researched about evaluating DEM using SAR data. If you understand writing your own code, it would be a better solution to generation of DEM. Results of your research includes different meaning statically. Doris is useful for this process and
The Sentinel-1A mission is very fresh for all other similar. There has not research on it yet. Our aim is make DEM from free source of sentinel data hub and then make new perspective in this SAR process. Collected points are not Ground Control Ranging. There are two kind of radar type in general use. Dual antenna radar(SRTM) and single antenna radar(cosmo skymed,alos-palsar etc.). For detecting, the scattering radar waves touch the things as a laser wave but not seemless, after that back scatter to the antenna. It is enough to make a phase difference for dual antenna radars. However single antenna radars must more than one monitoring to generate phase difference. As a result, radar determines the range, angle, or velocity of objects. RADAR uses for monitoring deformation, detection of a car speed, counting ice volume and likely more different topics.
2.2 What is SAR and Interferometry?
SAR is a kind of radar which is used for remote sensing and The International Archives of the Photogrammetry, Remote Sensing and Spatial Information Sciences, Volume XLI-B1, 2016
and phase differences between return signal and created signal. But interferometry’s method is detecting of reflected radiation of every passes (more than one pass) on the same orbit to the centre of antenna (URL1, 2016)
2.3 Information about Digital Elevation Model - DEM
To monitor whatsoever point coordinates or elevation data from digitally you must have a digital elevation model (DEM). DEM is a method, generally creating from stereo images or from satellite images or from digitalized scaled plates etc. To make a DEM first you need to learn some certain coordinates and convert them to the essential projection model. Then it could be able to interpolate. As a result of interpolation you have DEM kind of point cloud to reach all points inside.
2.4 About Satellite and Missions
There are some kind of SAR satellites and missions.(Table 1) And apart from these, there are too many different SAR radar missions kind of operators erogate too much time and money for this technology.
Satellite Name Mission
Launch End Revisit Band Type
Cosmosky-Med 4 2010 - 16 X Band
Table 1. Kinds of Radar Products and Missions
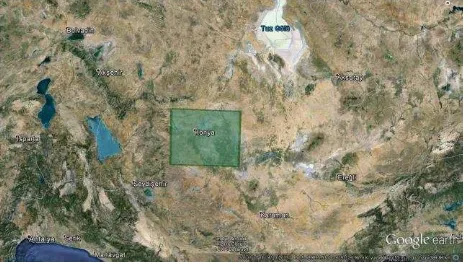
2.5 Test Area traditional lowland which is inseminated by people for hundred years and not too much slope differences in there. Last reason, Researchers had been completed and discussed in this area. Last reason makes our work more reliable and safe.
Figure 1. A Map about Test Area
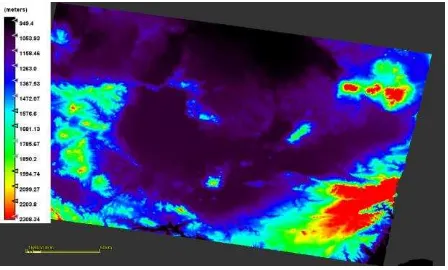
You can catch sight of elevation map and its legend of the same area, created from Sentinel 1-A radar image.
Figure 2. Elevation Map and Legend on Test Area
2.6 Data
The first SENTINEL-1 satellite (SENTINEL-1A) is planned for launch on a SOYUZ rocket from Europe's Spaceport in French Guiana in early 2014 followed by the second (SENTINEL-1B) in 2016. The SENTINEL-1 mission includes C-band imaging operating in four exclusive imaging modes with different resolution (down to 5 m) and coverage (up to 400 km). It provides dual polarisation (HH/VV/HV/VH) capability, very short revisit times (12 days) and rapid product delivery. From ESA’s data hub you can easily download different kind of radar view (StripMap, IWS, ExtraWS and WM imaging modes) and mine is Interferometry Wide Swath imaging mode and C band type, resolution of view is 5*20 m. In addition to these, A digital terrain elevation data (DTED), which is gained from 1/5000 raster data, is used for validate our work sensitive. To correct coordinates, Root Mean Square (RMS) is utilized for statically analyse method. (El Hage, 2012)
Six steps to do we have to follow carefully. First, the Sentinel-1A images are not ready to use directly. Before the start step, statical analyse become a part of the process. As a result of these steps we are composed a report about DEM achieved from Sentinel-1A image.
Figure 3. Map of Intensity
To create a significant model from intensity map, some of processes we have to do. Begin of process is calibration. Polarisation is important for calibration. You must decide the true polarisation of view. We did it with VV polarisation band. Thermal Noise rectification for same polarisation at the second. On the Figure 4 Calibrated and Thermal Noise corrected image view is seen.
Figure 4. Re-introduced Thermal Noise Map Normally, our product has 3 part of view bands. Every figure shows us to a one part of view. But after TOPSAR Deburst rectification, image view is normalized and demonstrated the all part of view as a one. View of image after TOPSAR Deburst correction seen on figure 5.
Figure 5. TOPSAR Deburst Rectificated View
Multilooking rectification has modifiable features. You can change number of range looks and azimuth looks for different aims and also you can prefer rectification way GR square pixel or independent looks. Every step creates a different result of view. But at the opening of image view looks like they are all the same. The difference starts in pixel values. The final step is terrain correction. The end of the process, after terrain correction, we will have a DEM interpolated from view and SRTM or ASTER DEM data (selectional) with different resampling methods. (Bilinear interpolation, cubic convolution etc...) To make logical DEM you must choose the best option before interpolation. Otherwise, it is possible to get faulty pixel values from DEM. The faulty depends on the area inside the map. Some interpolation methods make DEM best for hill areas, the other make it better for plain or urban areas. The important point is which you want to work with. Figure 6 and Figure 7 show us to how much they could be the similar.
Figure 6. DEM Generated With Bilinear Interpolation
Figure 7. DEM Generated With Nearest Neighbour Interpolation
The differences between two legend values and territorial pixel values are enunciative of every interpolation method’s accuracy independent from others. An example of a pixel, the 17590 x and 12560 y coordinates pixel correspond to 2317.3892 meters in Z at the DEM obtained from Bilinear Interpolation, same coordinate pixel 2318.9497 meters in Z at the DEM obtained from Nearest Neighbour Interpolation. In our work, bilinear interpolation was used. (Histogram 1)
Histogram 1. Pixel Frequency on Digital Elevation Model Obtained From Sentinel-1A with Bilinear Interpolation Method
in Meters
After, creating DEM you could convert it to more useful data type for impose and analyse. However, creating subset from view make it easy to process before the converting. Just because our product 250 km2 size, too many detail is unimportant inside the view. As a result, we had made a small size subset which has our test area inside.
2.8 Digitalized Raster Images
While the processes of digitizing is being done, the question of solving the problem is the most appropriate transformation model can be applied to the maps, forming the source of information, has been faced frequently. This transformation models has the ability to control points generated from the map in terms of robust or other logical tests within the framework of statistical rules statistical hypothesis testing. (Uzun, 2005)
3. RESULTS AND DISCUSSION
3.1 Choosing Control Points
When we created two different DEMs, it is possible to say compare. Two different points, gain from different DEM, made the results different on every choice. But picking of points is not easy as seen. You could pick points by different methods. But in this work we want to research differences on comparable areas. For this reason, 30 points per taking from plane, mountain and average areas.
Figure 8. DEM of Sentinel-1A image (Test Area Subset)
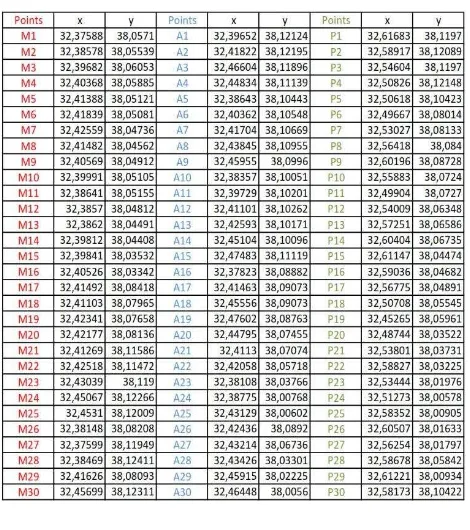
Figure 9. Overlap of DTED DEM and Sentinel-1A DEM After overlapping the data, totally 90 points are picked from different areas for compare to each other. That is the coordinate list of points and name of points means characteristic symbol in it. The “M” symbolized points mean mountain area, “A” means average (not too sloppy, not too plane) and last “P” symbolized
points mean plate area.
Table 1. Points List
As you see on figure that points in the point list are separated by randomly and according to an array.
Figure 10.Separation of Points(Green Triangle= M, Blue Point Dot Inside= A, Red Circle Point= P)
3.2 Analyse
In this work, analyse must be very accurate to understand if the elevation values correct or not. For this reason, we analyse elevation (Z) values with Root Mean Square (RMS) method. RMS, also known as quadratic mean, derived from sum of square of all values which is result of differences between 2 elevation values. Equations of this:
Where ZR= elevation value of reference surface ZN= elevation value of created DEM n= number of point evaluated
After calculate all RMS values for all different type of area you can understand what you can do to correction on your work and interpret easily what it means. On the table of RMS values, results show us differences between mountain area, plane area and average area.
Table 2. Statistics
From the table 2 we could interpret that, the created DEM from Sentinel-1A SAR image bring to a conclusion every area different RMS and precision. To make better DEM users would try it on plane areas. Sensibility of SAR images get more lower on mountain area but this is not meaning of inadequate precision of DEM.
Figure 11. RMS of Experiments
In addition to this figure, the frequency table and the confidence level table demonstrate distributions of points. This demonstration is commentated all kind of area precise. Table 3 and table 4 are for demonstration.
Table 3. Frequency Table
Table 4. Confidence Level Table
4. CONCLUSION
Statical results show us if you want to create a DEM from Sentinel-1A SAR images, you could do better DEM for low slope terrains and density of gradient effect your DEM’s elevation precision directly. In this work, we had created a The International Archives of the Photogrammetry, Remote Sensing and Spatial Information Sciences, Volume XLI-B1, 2016
Then create a model which has 3 type of terrain inside. After that, randomly choose points were calculated in RMS method for researching precision of elevation value. At first look statical model looks scattering distributions are normally and precise level of scatter is increasing up to slope level. They are possible to say that the elevation results are acceptable because it is free. (URL 2, 2016)And also Sentinel-1A could be a chance for countries which has their own data in data hub. Thus, Digital Elevation Model is so important for geomatic engineering and remote sensing and also it is important for almost all geo science. If the precision is enough for your work and your area is inside the Sentinel-1A data hub, it will be a good solution for creating a DEM in close future for developing countries.
ACKNOWLEDGEMENTS (OPTIONAL)
This work is generated from Hasan Bilgehan Makineci’s thesis who is MSc student at the Selcuk University in Konya, TURKEY.
This research was funded by ACADEMIC STAFF TRAINING PROGRAM (OYP) with 2015-OYP-100 number of Selcuk University.
REFERENCES
Calò, F., Abdikan, S., Görüm, T., Pepe, A., Kiliç, H., & Balik Şanli, F. (2015). The Space-Borne SBAS-DInSAR Technique as a Supporting Tool for Sustainable Urban Policies: The Case of Istanbul Megacity, Turkey. Remote Sensing, 7(12), 16519-16536.
Sefercik, U. G. (2007, June). Comparison of DEM accuracies generated by various methods. In Recent Advances in Space Technologies, 2007. RAST'07. 3rd International Conference on (pp. 379-382). IEEE.
Liao, M., Wang, T., Lu, L., Zhou, W., & Li, D. (2007). Reconstruction of DEMs from ERS-1/2 tandem data in mountainous area facilitated by SRTM data.Geoscience and Remote Sensing, IEEE Transactions on, 45(7), 2325-2335. Lanari, R., Fornaro, G., Riccio, D., Migliaccio, M., Papathanassiou, K. P., Moreira, J. R., ... & Coltelli, M. (1996). Generation of digital elevation models by using SIR-C/X-SAR multifrequency two-pass interferometry: the Etna case study. Geoscience and Remote Sensing, IEEE Transactions on, 34(5), 1097-1114.
Geymen, A. (2014). Digital elevation model (DEM) generation using the SAR interferometry technique. Arabian Journal of Geosciences, 7(2), 827-837.
Toutin, T. (2000). Evaluation of radargrammetric DEM from RADARSAT images in high relief areas. Geoscience and Remote Sensing, IEEE Transactions on,38(2), 782-789. El Hage, M., Simonetto, E., Faour, G., & Polidori, L. (2012, August). Evaluation of elevation, slope and stream network
quality of SPOT DEMs. InXXII ISPRS congress. International Archives of the Photogrammetry, Remote Sensing and Spatial Information Science (Vol. 25).
Uzun, S., and friends Report on the Joint TMMOB Türkiye Scientific and Technical Symposium “Digitizing Models And The Reability Of Digitized Map Information”, Ankara, Turkey