EXTRACTING MOBILE OBJECTS IN IMAGES USING A VELODYNE LIDAR POINT
CLOUD
Bruno Vallet, Wen Xiao, Mathieu Br´edif
IGN, Laboratoire MATIS 73 avenue de Paris 94165 Saint-Mand´e, FRANCE
[email protected] recherche.ign.fr/labos/matis/∼vallet
Commission III/3
KEY WORDS:Tracking, Lidar, Image, Dempster-Shafer, Graph-cuts
ABSTRACT:
This paper presents a full pipeline to extract mobile objects in images based on a simultaneous laser acquisition with a Velodyne scanner. The point cloud is first analysed to extract mobile objects in 3D. This is done using Dempster-Shafer theory and it results in weights telling for each points if it corresponds to a mobile object, a fixed object or if no decision can be made based on the data (unknown). These weights are projected in an image acquired simultaneously and used to segment the image between the mobile and the static part of the scene.
1 INTRODUCTION
1.1 Context
Mobile objects occupy a large portion of urban scenes. For map-ping purposes, these non permanent objects should be detected and removed. On the opposite, these objects can serve to validate traffic simulations on both roads and side-walks. Conversely, the results of such simulations can be visualized in an image based viewer (street view like), where existing mobile objects have been removed (Br´edif, 2013). In both cases, it is important to extract the mobile objects from their more permanent background. The Velodyne laser scanner is a great tool to perform this task as it gives a 4D representation of urban scenes, consisting of both the (x, y, z)point geometry and the timetat which each point was acquired. On the opposite images are static, but would benefit from an external data source to separate mobile from static ob-jects. In particular image based 3D scene reconstruction often relies on the hypothesis of a static scene between images.
This paper proposes a full processing pipeline to perform this separation between static and mobile objects in images based on Velodyne data.
1.2 Related works
The topic of separating the mobile from the static part of an im-age is related to object tracking in videos. However, we did not investigate the very large literature on this topic for two reasons:
1. The images in this study are acquired every 5 meters (cf Section 3), independently of a time rate, so can hardly be considered as videos.
2. The cameras used are mounted on a mobile mapping system so all the scene moves, making it extremely difficult to de-fine what is static in a frame attached to the scene and not to the vehicle.
The most closely related topic is detection and tracking of mo-bile objects (DATMO) from Velodyne scanning which is a topic
intensively studied in the robotics community (Azim and Aycard, 2012). AS in our paper, the central issue is to model and store the occupancy information provided by the laser scan. The storage is usually done in a voxel grid (Elfes, 1987) or an octree (Azim and Aycard, 2012). Conversely, we only need to compute this information on the points of the closest frame (in time) to the corresponding image, so there is no need for a voxel grid or oc-tree structure. To our knowledge, the closest work to ours focuses in image/Lidar pedestrian detection (Premebida et al., 2009). If the data used is the same, the goal differs as in this work, image and lidar data is exploited in a classification framework to decide if an object is a pedestrian, whereas in our work, we aim at a precise image segmentation of the mobile objects using the Lidar information, and we are not interested in the type of the object (car, pedestrian, bicycle,...).
1.3 Method overview
The approach that we propose relies on mobile objects detection from Velodyne data. This is done by Dempster-Shafer based time aggregation of the occupancy information provided by the laser scan as detailed in Section 2. This information is then transferred to the image by projection, and regularized based on the image discontinuities using a graph-cut framework as detailed in Sec-tion 3. Results will be commented in SecSec-tion 4.
2 EXTRACTION OF MOBILE OBJECTS IN VELODYNE DATA
2.1 Velodyne data
Figure 1: StereopolisII mobile mapping system that acquired the data used in this paper. Velodyne is circled in green and panoramic head in red.
Figure 2: Velodyne data acquired over a 3 seconds interval, coloured according to backscattered intensity (blue:low, white: average, red: high)
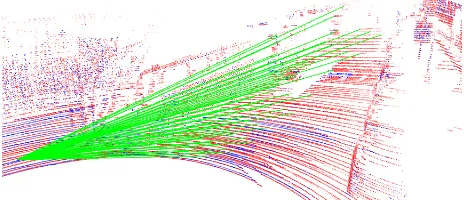
Figure 3: Arrangement of the 64 Velodyne sensors visualized through the 64 laser rays that they emit (green)
records around 1.3 million points per second, that is 130 thou-sand points per full rotation at the 10Hz rotation speed used dur-ing this study. At this speed, the horizontal angular resolution is 0.23◦
. Vertically, the Velodyne covers an angle from45◦
below horizontal to10◦
above. The vertical resolution is not constant as the sensor arrangement is not regular as shown in Figure 3, but it is in average(45 + 10)/64≈0.86◦
. For each point, the system records:
• The(x, y, z)position of the target hit by the ray
• The(x, y, z)position of the point from which the ray was emitted, which gives access to the 3D equation of the ray and allows the ray representation in 3.
• The backscattered intensity, used to colour Figure 2 • The id of the sensor
• The exact GPS time at which the ray was emitted.
• The angle formed by the rigid head on which the sensors are mounted with the base attached to the MMS.
This very complete information (in particular ray equation) lead us to choose an occupancy based method for mobile points ex-traction.
2.2 Geometric vs semantic mobile objects extraction
From the very large amount of points recorded by the Velodyne laser scanner, our objective is now to distinguish which points belong to fixed objects (with respect to a geographical frame) and which points belong to mobile objects:
• Pedestrians
• 2 wheelers: bikes, mopeds, motorbikes • 4 Cars, vans, trucks, buses
This distinction could be made semantically by using an exist-ing urban point cloud analysis methods. This can be done ei-ther based on supervised learning based on the shape of the point cloud (Golovinskiy et al., 2009) (Serna and Marcotegui, 2014), or with Markov networks (Munoz et al., 2009) (Shapovalov et al., 2010). However, these approaches rely on a static scene as-sumption. For mobile objects we are in one of the two following cases:
1. The laser scanner sweeps a fixed plane relative to the MMS (which is the case of most actual Mobile laser scanning sys-tems): in this case, the mobile object will be distorted de-pending on its speed relative to that of the MMS.
2. The laser rotates as the Velodyne described in Section 2.1: In this case, the method should be adapted to take into ac-count the multiple overlapping instances of the mobile ob-jects. Moreover, the point density for one instance will be much lower and less accurate than with a laser of the first type.
In both cases, the semantic distinction will work well only for static objects. Moreover, in both approaches will usually fail to correctly label mobile objects for the reasons listed above. Con-versely, we are precisely interested in detecting mobile objects in this study, which is complementary to such semantic approaches: by detecting mobile objects, we can remove them from the scene such that the static assumption made by the aforementioned se-mantic approaches is verified.
2.3 Mobile points extraction
We will now briefly summarize the work of (Xiao et al., 2013) that we used to determine which points in the Velodyne data correspond to mobile objects. The central point of this work is to model the information that laser rays give us about the occu-pancy of space. Space is obviously empty between the laser cen-ter and the hit point, full around the target and unknown behind. This information is formalized using Dempster-Shafer Theory (DST), such that the occupancy of space is given by three func-tions(e, o, u):R3→T ={(e, o, u)∈[0,1]3|e+o+u= 1}. We thus have three extreme cases:
1. (1,0,0): it is certain that the space is empty at this point
2. (0,1,0): it is certain that the space is full at this point
3. (0,0,1): nothing is known on the occupancy of space at this point
The DST defines an aggregation operator⊕for this type of infor-mation:
that is commutative and associative. K is the conflict and in-dicates an incoherence in the aggregated information. In (Xiao et al., 2013), this operator is used to aggregate all the informa-tion from individual rays in one scan of the scene. To com-pare a scans 1 with a scan 2 of the same scene, the(e2, o2, u2) of scan 2 are computed at the point locations of scan 1 where (e1, o1, u1) = (0,1,0)(space is full where there is a point). The result can be interpreted the following way:
1. e2indicates change: scan 1 is full at this point whereas scan 2 is empty, indicating that the scene has changed in the time interval between scans 1 and 2
2. o2indicates consistency: scan 1 and 2 are full at this point, indicating that the scene is the same.
3. u2indicates uncertainty: there is no information at that point in scan 2 so nothing can be said about it. This occurs mainly in occlusions.
The same analysis can be performed between scan 2 and scan 1 by reversing their roles, such that for each scan we can know what has changed or not compared to the other.
In this paper, we propose to apply this methodology to mobile objects detection by simply defining the scans to compare at a much shorter time interval: between Velodyne frames (defined as a full360◦
rotation of the Velodyne head around the vertical axis). More precisely, scan 1 will be a Velodyne frame, and scan 2 will be a set ofnf rame frames before and after the frame of
scan 1. The parameternf rameshould be tuned according to the
scanning frequencyfand the expected sizeszand speedspof the mobile objects that we cant to detect. To be fully detected with this approach, a mobile object needs to have fully moved outside of the volume it occupies in space between the studied frame and the furthest one (in time). An object of sizeszand
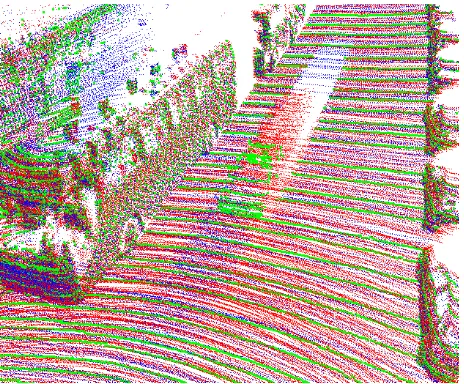
Figure 4: A single Velodyne frame (green) with the 10 past frames (red) and the 10 future frames (blue)
speedsptakes a timesz/spto achieve this, so the time interval nf rames/fshould be greater:
nf rames> f
sz sp
the order of magnitude for common mobile objects (for f = 10Hz) is:
1. Pedestrian: sz = 0.5m (in the direction of movement), sp= 1m/s,nf rames>5
2. Bicycle: sz = 2m(in the direction of movement),sp = 4m/s,nf rames>5
3. Car:sz= 5m(in the direction of movement),sp= 10m/s, nf rames>5
so very roughly, the number of frames to use is the same for these mobile objects. In practice, we usednf rames = 10in order to
fully detect objects moving at half the expected speeds mentioned above. For even lower speeds, only a part of the object will be detected (the front and the back in moving direction) which may still lead to good image extraction.
Withnf rames = 10, scan 2 consists of 20 frames (10 before
and 10 after the frame of scan 1). Adding the past and the future makes the detection more robust. A result of this adaptation of (Xiao et al., 2013) to Velodyne data is presented on Figure 5. The moving car is very well detected, but the method tends to over detection (points on the street or top of parked cars are detected as mobile). This is due to the fact that our method requires a great accuracy, and the Velodyne is not a metrologic sensor. Thus for point far away, the precision is low such that fixed surface can be interpreted as moving because it is not exactly at the same position between the first and the last frame. Fixing this issue would require a very fine, probably non rigid registration of the velodyne frames, and a better calibration of the Velodyne itself.
3 MOBILE OBJECTS DELINEATION IN IMAGES
Figure 5: Result of the mobile points extraction from Velodyne data for the single frame of Figure 4
used in this study, the explain the time aware projection of points in these images, and finally detail our graph-cut based approach to mobile objects delineation.
3.1 Oriented images
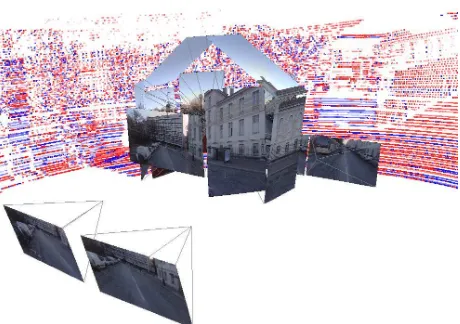
Figure 6: The 14 oriented images visualized with the Velodyne data acquired simultaneously in the background
In this study, we used oriented images acquired simultaneously to the Velodyne data. These images are acquired by 14 cameras mounted on the MMS, and precisely calibrated (both internally and externally) by the method described in (Cannelle et al., 2012). For each such image, we have a time stamp indicating the exact moment at which it was taken.
The MMS has a georeferencing system providing its location in a geographical frame with a high precision (decimetric) when it is static and in an open environment, but is subject to a drift when it is moving in urban areas where satellites are harder to acquire and their signal is perturbed by echoes on faades. However, the inertial unit ensures that this drift is sufficiently slow (below 1cm per second) to be neglected in this study.
Figure 7: Histogram of number of points that project in an im-age every 0.01s time intervals. Exact imim-age acquisition time is marked by a red dot.
3.2 Time aware projection
Thanks to a precise calibration of both the images orientations and Velodyne laser, we are able to project the Velodyne points in each acquired image. However, for the projected points to be coherent with the image content, this should be done by taking special care of the timing of the acquisition: the points to be pro-jected in the image should have been acquired as close as possi-ble (temporally) to the image. Because of its regular rotation, the laser scan spans regularly (every tenth of a second with our 10Hz setting) the part of the scene seen by the image. This can be vi-sualized through an histogram showing how many points project in the image for small time intervals as shown in Figure 7.
From that histogram, we see that the laser does not necessarily sweep the portion of the scene seen by the image at the exact time that the image is acquired. To minimize the time shift between acquisition time of the image and points projected in it, we select the closest frame by the following algorithm:
1. For imagei, compute its time histogram by counting how many points acquired in each time interval of the histogram project in the image (cf Figure 7).
2. Extract the local maximatjof the histogram
3. Find the local maximatj∗the closest to the acquisition time ti
of imagei
4. For an acquisition frequencyf (10Hz in our case), define the time frame of imageias[ti−1/2f, ti+ 1/2f]
As Figure 7 shows, for each 360 rotation of the Velodyne (every 0.1s) acquired points project in the image for a time interval of around 0.03s. Thus, in the worst case scenario (image was ac-quired when Velodyne was acquiring the opposite direction), the maximum time shift between the acquisition time of a point and that of the image is1/2f+0.03/2 = 0.065s. Thus a vehicle with speed10ms−1relative to the MMS (common for a car crossing the vehicle) may have moved of10×0.065 = 0.65mbetween its acquisition by the Velodyne and the image in the worst case. Obviously, the average case is much better (a few centimetres for vehicles moving in the same direction as the MMS, 10-20cms for pedestrians). Hence, we need our image delineation algorithm to be robust to such uncertainties.
(a) Crop of input image
(b) Projected weights image (red=mobile, green=static, blue=unknown)
(c) Image and weights overlapped with pixels where no point projects made transparent
Figure 8: Inputs to the graph cut algorithm
pixels where no point project are attributed the weights(0,0,1) (completely unknown) as illustrated in Figure 8(b). We will now make use of this weight imagewto segment the mobile objects from the static background of the image.
3.3 Graph-cut segmentation
We will now formulate the segmentation problem between mo-bile and static objects. We look for a labellingL :I → {0,1} whereIis the set of pixels of the image, and label 0 is for static pixels and 1 is for mobile. The labelLwill be optimized through three concurrent objectives:
1. Laser consistency: The labelling should be as consistent as possible with the weightsw. In other terms, whenw = (1,0,0)(mobile),Lshould be 1, whenw= (0,1,0)(static) Lshould be 0, and whenw = (0,0,1)(unknown),Lcan be indifferently 0 or 1.
2. Image Regularity: We are looking for mobile objects, which are quite large scale, so the delineation should be quite coarse. More formally, we will penalize the label changes, that is the number of transitions ofLfrom 0 to 1 (or the opposite) on neighbouring pixels.
3. Image consistency: transitions between labels should be more easy on image edges.
Those two objectives are formulated through an energy to mini-mize:
E(L) =X
p∈I
sL(p)+m(1−L(p))+ X (p,q)∈N4
λ|L(p)−L(q)| d(I(p), I(q)) +ǫ
whereN4 is the set of adjacent pairs of pixels in imageI in 4-connectivity,λandǫare parameters that will be discussed in Sec-tion 4 anddis a distance on image colors, that we defined as:
d(I(p), I(q)) = p
(rq−rp)2+ (gq−gp)2+ (bq−bp)2
255
where(r., g., b.)are the red, green and blue components of the
image in[0,255]atpandq. This minimization problem writes naturally as a graph cut problem (Boykov and Kolmogorov, 2004) where each pixel is a node, and there are two types of with edges:
1. Edges between source/sink and a node, with weightss be-tween the node and the source, andmbetween the node and the sink.
2. Edges between nodes corresponding to adjacent pixelspand qwith weights(d(I(p), I(q)) +ǫ)−1.
One can readily check that for any cut of this graph separating source from sink, all node pixels are attached either to the node and the sink, and that if we label them 0 (source) and 1 (sink), the corresponding labelling has an energyE(L)equal to the cost of the cut (sum of all the weights of the cut edges).
4 RESULTS AND DISCUSSION
We applied the methodology described in this paper to an ac-quisition by the StereopolisII MMS in Paris where images and Velodyne laser point cloud were acquired simultaneously. Re-sults for various parameter values are displayed in Figures 9 and 10. Concerning the influence of the parameters:
1. The parameternf rames: as explained in Section 2.3, we
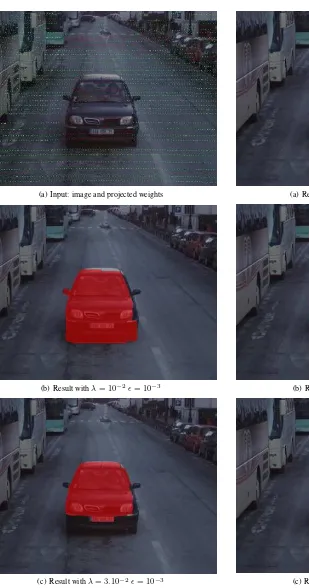
(a) Input: image and projected weights
(b) Result withλ= 10−2ǫ= 10−3
(c) Result withλ= 3.10−2ǫ= 10−3
Figure 9: Results for average parameter values. Extracted mobile objects are highlighted in red.
2. The parameterǫ > 0weights the image attachment term. For a high value, image consistency term is almost constant, so the attachment to the image will be very weak and only compactness of the regions will be favoured (Figure 10(b)). On the opposite, for low values transitions between pixels with similar values will be highly penalized, such that re-gion boundaries will align with image edges (Figure 9(b)). For good image attachment, we chooseǫvery small (usually
(a) Result withλ= 10−3ǫ= 10−3
(b) Result withλ= 10−3ǫ= 103
(c) Result withλ= 5.102ǫ= 103
Figure 10: Results for extreme parameter values. Extracted mo-bile objects are highlighted in red.
10−3
). Note thatǫshould never be 0 because in that case we risk division by 0 if adjacent pixels have the same color, so it should be chosen as a small strictly positive value.
compact (and image aligned ifǫis small) regions at the cost of higher distance from the input (Figure 10(c)), with the risk of having a single region ifλis too high.
We see in the results that most of the errors come from two causes:
1. Misalignment between the image and the laser. This comes from the fact that the Velodyne is not a metrologic sensor and has imprecisions, from the image and Velodyne calibra-tion, and from the fact that there are naturally temporal shifts between the image where all pixels are acquired simultane-ously and the laser that sweeps the scene continusimultane-ously.
2. Errors in the points weights which are also mainly due to Velodyne imprecision.
The calibration of the Velodyne was made with a very rigorous methodology so there is probably limited possible improvement there. Concerning Velodyne imprecision, the best way to go is a frame by frame or even temporal self-registration to enhance the self-consistency of the data (fixed objects stay at the exact same place through time). Finally, concerning the temporal shift, a possible solution would be to estimate an object speed and use this speed to estimate the points position at the exact instant that the image was taken.
Concerning processing time, the mobile weights computation is by far the most time consuming (15s) even though the space queries are optimized by a kd-tree. The projection in the image takes around 1s (including the histogram construction and anal-ysis) and the graph construction and minimum cut computation takes around 0.5s on a full HD 1920x1080 image, all in single thread on an Intel Core i7 CPU at 3.33GHz processor.
5 CONCLUSIONS AND FUTURE WORK
We have presented a full pipeline to extract mobile objects in im-ages based on a simultaneous Velodyne scan. It relies on an anal-ysis of the evolution of space occupancy with Dempster-Shafer theory, a projection of this information in images, and finally a graph-cut optimization to extract the mobile objects in the image coherently with both the image content and the projected weights. The algorithm shows satisfying results considering the challeng-ing data, and several leads for improvement have been proposed.
In the future, we plan on analysing more finely the laser at various level:
• Self-registration to ensure that fixed objects are stable through time
• Object tracking to reach an object level representation in the laser, allowing to interpolate its position between its acqui-sition instants for a closer matching with the image.
• Deeper image/laser collaboration by expressing the two parts of the problem (mobile points extraction and their cluster-ing) in a single general formulation combining 3D and im-age.
ACKNOWLEDGEMENTS
This research is partially funded by the French National Research Agency (ANR) within the iSpace&Time (Grant ANR-10-CORD-023)
REFERENCES
Azim, A. and Aycard, O., 2012. Detection, classification and tracking of moving objects in a 3d environment. IEEE Intelligent Vehicles Symposium (IV), 3-7 June 2012 pp. 802–807.
Boykov, Y. and Kolmogorov, V., 2004. An experimental com-parison of min-cut/max-flow algorithms for energy minimization in vision. IEEE Transactions on Pattern Analysis and Machine Intelligence 26(9), pp. 1124–1137.
Br´edif, M., 2013. Image-based rendering of lod1 3d city models for traffic-augmented immersive street-view navigation. In: IS-PRS Annals CMRT13 City Models, Roads and Traffic, Vol. Vol-ume II-3/W3, WG III/4, ICWG III/VII, Antalya, Turkey, Novem-ber 2013, pp. 7–11.
Cannelle, B., Paparoditis, N., Pierrot-Deseilligny, M. and Pa-pelard., J.-P., 2012. Off-line vs. on-line calibration of a panoramic-based mobile mapping system. In: ISPRS Annals of the Photogrammetry, Remote Sensing and Spatial Information Sciences, XXII ISPRS Congress, 25 August 01 September 2012, Vol. I-3, Melbourne, Australia.
Elfes, A., 1987. Occupancy grids: A probabilistic framework for robot perception and navigation. Journal of Robotics and Au-tomation 3, pp. 249–265.
Golovinskiy, A., Kim, V. and Funkhouser, T., 2009. Shape-based recognition of 3d point clouds in urban environments. In: Inter-national Conference on Computer Vision.
Munoz, D., Bagnell, J., Vandapel, N. and Hebert, M., 2009. Con-textual classification with functional max-margin markov net-works. In: IEEE Computer Society Conference on Computer Vision and Pattern Recognition (CVPR).
Paparoditis, N., Papelard, J.-P., Cannelle, B., Devaux, A., So-heilian, B., David, N. and Houzay, E., 2012. Stereopolis 2: A multi-purpose and multi-sensor 3d mobile mapping system for street visualisation and 3d metrology. In: Revue Francaise de Photogramm´etrie et de T´el´ed´etection, Vol. 200, pp. 69–79.
Premebida, C., Ludwig, O. and Nunes, U., 2009. Lidar and vision-based pedestrian detection system. Journal of Field Robotics 26, pp. 696–711.
Serna, A. and Marcotegui, B., 2014. Detection, segmentation and classification of 3d urban objects using mathematical morphol-ogy and supervised learning. ISPRS Journal of Photogrammetry & Remote Sensing 93, pp. 243–255.
Shapovalov, R., Velizhev, A. and Barinova, O., 2010. Non-associative markov networks for 3d point cloud classification. The International Archives of the Photogrammetry, Remote Sensing and Spatial Information Sciences XXXVIII, Part 3A, pp. 103–108.