DEM GENERATION FROM HIGH RESOLUTION SATELLITE IMAGES THROUGH A
NEW 3D LEAST SQUARES MATCHING ALGORITHM
Taejung Kim, Sooahm Rhee
Department of Geoinformatic Engineering, Inha University, 253 Yonghyun-Dong, Namgu, Incheon Korea
tezid@inha.ac.kr, ahmkun@inha.edu
Commission I, WG I/4
KEY WORDS: Matching, DEM, Least Squares Estimation, High Resolution Satellite images
ABSTRACT:
Automated generation of digital elevation models (DEMs) from high resolution satellite images (HRSIs) has been an active research topic for many years. However, stereo matching of HRSIs, in particular based on image-space search, is still difficult due to occlusions and building facades within them. Object-space matching schemes, proposed to overcome these problem, often are very time consuming and critical to the dimensions of voxels. In this paper, we tried a new least square matching (LSM) algorithm that works in a 3D object space. The algorithm starts with an initial height value on one location of the object space. From this 3D point, the left and right image points are projected. The true height is calculated by iterative least squares estimation based on the grey level differences between the left and right patches centred on the projected left and right points. We tested the 3D LSM to the Worldview images over ‘Terrassa Sud’ provided by the ISPRS WG I/4. We also compared the performance of the 3D LSM with the correlation matching based on 2D image space and the correlation matching based on 3D object space. The accuracy of the DEM from each method was analysed against the ground truth. Test results showed that 3D LSM offers more accurate DEMs over the conventional matching algorithms. Results also showed that 3D LSM is sensitive to the accuracy of initial height value to start the estimation. We combined the 3D COM and 3D LSM for accurate and robust DEM generation from HRSIs. The major contribution of this paper is that we proposed and validated that LSM can be applied to object space and that the combination of 3D correlation and 3D LSM can be a good solution for automated DEM generation from HRSIs.
1. INTRODUCTION
Understanding the exact shape of the earth surface has been one of the primary goals of the modern science. It will enable precise biophysical study of the earth environments and accurate analysis of human effects on the earth environments. Very powerful sources to capture the earth surface shape are high resolution satellite images (HRSIs). They are free from accessibility and can be obtained globally consistently. They offer cost-effective and visible data to model the earth surface. Hence, automated generation of DEMs from HRSIs has been an active research topic for many years.
It is known that stereo matching of HRSIs is difficult due to singularities caused by the intrinsic nature of them, such as occlusions and building facades (Kim, 2005). Height profiles generated from HRSIs are often very crude and contain blunders or holes. In many occasions there is little improvement in DEMs from HRSIs compared to those from medium resolution images. For this reason multiple optical images (Okutomi and Kanade, 1996; Gruen and Baltsavias, 1998), instead of two, or other data sources, such as laser scanner data and differential SAR data, are utilized for DEM generations. In this paper, we report our work on automated DEM generation from stereo pairs of HRSIs. We are pursuing our research under the activities of the ISPRS WG I/4 on ‘benchmarking and quality analysis of DEM generated from high and very high resolution optical stereo satellite data’ and we report our interim results. We propose a new matching scheme for automated DEM generation that utilizes least squares correlation matching in an object space. We compare the new matching scheme with existing ones and combine them together for reliable DEM extraction.
We believe that the reason for the failure of producing DEMs of good quality lies in matching schemes. Most of stereo matching algorithms proposed for HRSIs are based on image-space search. For an image point within a reference image, its corresponding image point within a target image is searched for (Lee et al., 2003). This scheme may work well with medium resolution images, where the singularities are rarely observed. This scheme, however, is vulnerable for HRSIs, where image points often lie on the singularities. To overcome this problem, we believe that matching has to be performed in an object space with a more intelligent correspondence search scheme.
On the other hands, object-space matching schemes define voxels within a 3D object space, project each voxel onto the left and right image spaces, and check similarities by grey-level correlation. Often they are very time consuming and critical to the dimensions of voxels. This method may not produce better performance to the matching algorithms based on the image space.
In this paper, we tried a new least square matching (LSM) algorithm that works in a 3D object space. The algorithm starts with an initial height value on one location of the object space. From this 3D point, the left and right image points are projected. The true height is calculated by iterative least squares estimation based on the grey levels of the left and right patches centred on the projected left and right points. This 3D LSM can overcome the problems of the image space matching since the projected image points will not lie on the singularities. The 3D LSM will overcome the problems of the conventional object space matching algorithms since there is no need to define the voxel dimensions.
We tested the 3D LSM to the Worldview images over ‘Terrassa Sud’ provided by the ISPRS WG I/4. We compared the performance of the 3D LSM with the correlation matching based on 2D image space, (Lee et al., 2003) and a correlation matching based on 3D object space. The accuracy of the DEM from each method was analysed against the ground truth. Test results showed that 3D LSM offers more accurate DEMs over the conventional matching algorithms. Results also showed that 3D LSM is sensitive to the accuracy of initial height value to start the estimation. We combined the 3D correlation matching and 3D LSM for accurate and robust DEM generation from HRSIs.
2. 3D LEASET SQUARES MATCHING METHOD
This section describes a new least square matching method based on the 3D object space, 3D LSM. The LSM based on the 2D image space (2D LSM) is a well-known method to produce accurate DEMs image matching method (Gruen, 1985). However, 2D LSM is sensitive to initial position values. If the initial value does not lie within pull-in ranges, the solution will not converge to the right one. To minimize this effect used are good initial positions from existing DEMs or tie-point matching results. Because of these characteristics, 2D LSM is often used to improve performance of the 2D correlation matching. The proposed 3D LSM method utilized the relationship between the sensor and the object space in matching. This method is different from the previous 2D LSM method that works in 2D image space. The 2D LSM minimizes the grey level difference between the left and right patches by iteratively changing the image positions. For image position change and for establishing observation matrix, 2D transformation equations such as affine transformation are used. The 3D LSM minimizes the grey level difference between the left and right patches by iteratively changing the surface heights for a fixed object location X and Y. For height change and establishing observation matrix, the geometric models between the sensor and the object space are used.
When 3D coordinates X, Y, H are given, image coordinates are related to 3D coordinates by equation (1).
(1) where, cl and rl areimage coordinates of the left image, cr and rr areimage coordinates of the right image and P and Q are the geometric models between the sensor and the object space. When F and G are the grey-level functions for an image point (c, r), we have the equation (2). equations of image coordinate by equation (4).
(4) A combination of equation (3)-(4) yields
(5) The above equation can be used for finding H iteratively through least squares estimation. In the above equation, dH is the only unknown. It means that this method is more convenient to calculate and easier to limit the search scope than traditional methods. This method creates a virtual plain on the 3D-coordinate, and H values are changed to find the best match. This method performs matching with the fixed X and Y. Therefore, by selecting X and Y values for DEM grids, this method eliminates the need for DEM interpolation.
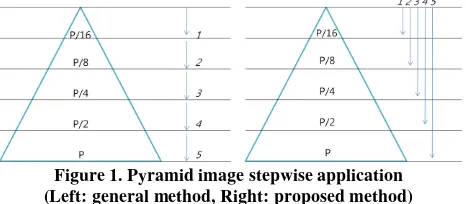
This method is suitable to apply the pyramid image matching. In general, a pyramid image matching method stores matching results in low resolution matching and uses these results as initial points for higher resolution matching. 3D LSM may adopt this scheme. 3D LSM can also apply pyramid matching differently by using image patches at different resolution and including all image patches simultaneously for least squares estimation. For a 3D object point with a given height, its image positions in the left and right images are calculated and the left and right patches at different resolutions are generated and used for LSM. This multi-layered matching scheme may decrease mis-matching rates as lower resolution image patches prevent mismatches. This may increase match precision as higher resolution image patches enables matching at finer scale. Figure 1 shows the difference between general and proposed pyramid matching method.
Figure 1. Pyramid image stepwise application (Left: general method, Right: proposed method) matching performance, we have given weight to image patches at different scales. The 2D Gaussian distribution was used to weight definition. The general form of 2D Gaussian distribution is given as
(6)
where σ is the scale parameter of Gaussian kernel. We determine the optimum sigma value is 0.2 times of search window size by experiments.
3. DATASET
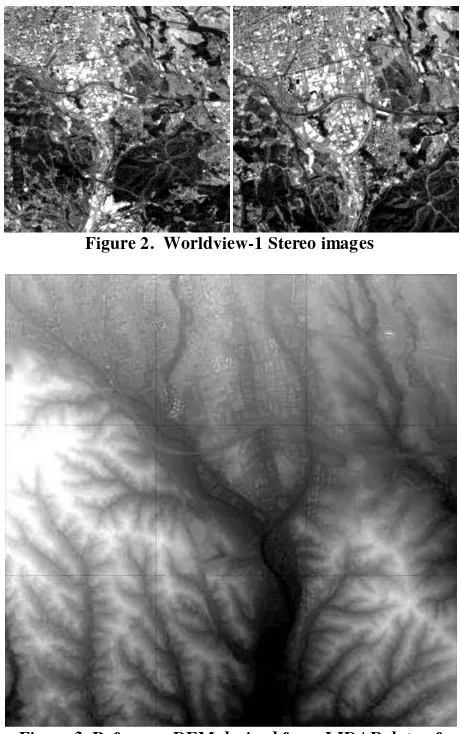
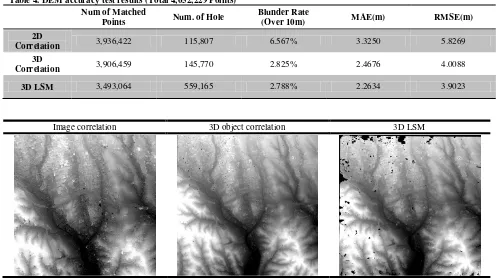
We used one of the dataset over Terrasa, Spain provided by the ISPRS working group I/4. The dataset consisted of two Worldview-1 images were at a resolution of about 0.5m and the reference DEM at 1m grid spacing acquired from LIDAR. The image size was 10000x10000 pixels and captured in August, 2008. Figure 2 and 3 show the images used and the reference DEM. Table 1 summarizes the properties of the area used for DEM extraction.
Figure 2. Worldview-1 Stereo images
Figure 3. Reference DEM derived from LIDAR data of Terrassa.
Table 1. Properties of the Terrassa area Lower left
(UTM31N, WGS84) Area size Area type
417400E control points (GCPs) were obtained from the LIDAR data. For the left and right images, 11 GCPs were collected. They were used to calculate the bias correction parameters. The accuracy
of the sensor model was found to be within 1 Pixel as shown in Table 2.
Table 2. Properties of the Terrassa area
Scene 1 Scene 2
Col RMSE (Pixel) 0.7999 0.6806 Row RMSE
(Pixel)
0.7157 0.3000
Magnitude (Pixel) 1.0733 0.7438
4. RESULTS AND DISCUSSIONS
Performance of 3D LSM
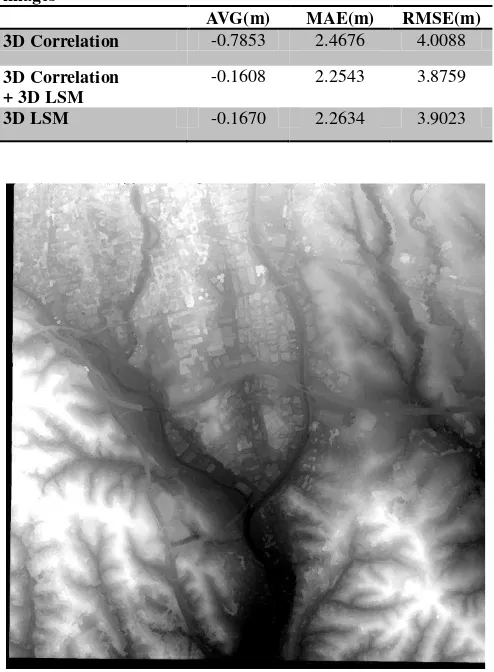
3D LSM was applied to the test dataset and a DEM at 2.5m grid spacing was generated. The accuracy of the DEM generated was compared with the reference DEM. For accurate verification of matching algorithm performance, we did not apply any post-process such as interpolation or image filtering. Through 3D LSM, 3,493,064 points were matched out of total 4,052,229 DEM grid points; this shows 86% of matching success rate. All match points were compared with the height in the reference DEM. In Table 3, the results show that the RMSE (Root Mean Square Error) was about 3.9m and the MAE (Mean Absolute Error) was about 2.3m. The average error was 0.1670m, showing that no significant biases were introduced in the DEM generated. matching schemes, 2D correlation matching and 3D correlation matching developed in-house (Lee et al., 2003; Kim, 2005). All three matching algorithms were applied to the test data under the same condition. Figure 4 shows the DEMs generated. As before, no error correction or filtering operations were applied. For 2D correlation, the DEM was generated by nearest neighbour interpolation with very small interpolation radius (2,5m) and for others no interpolation was applied. All matched points matched points were compared against the reference DEM and table 4 summarizes the DEM accuracy test results .
According to the results, the DEM from 2D correlation produced largest matched points with least accuracy. The blunder rate was over 6.5%. The DEMs from 3D correlation and 3D LSM showed much improved accuracy. This supports that the matching schemes performed in 3D object space could bypass the singularity problems of the matching in 2D image space. We can also compare the accuracy from the histograms in figure 5 and conclude that object space matching produced better results that the image space matching for HRSIs. International Archives of the Photogrammetry, Remote Sensing and Spatial Information Sciences, Volume XXXVIII-4/W19, 2011
Table 4. DEM accuracy test results (Total 4,052,229 Points) Num of Matched
Points Num. of Hole
Blunder Rate
(Over 10m) MAE(m) RMSE(m)
2D
Correlation 3,936,422 115,807 6.567% 3.3250 5.8269
3D
Correlation 3,906,459 145,770 2.825% 2.4676 4.0088
3D LSM 3,493,064 559,165 2.788% 2.2634 3.9023
Image correlation 3D object correlation 3D LSM
Figure 4. Generated DEM images
Image correlation 3D correlation 3D LSM
Figure 5. Histogram of DEM Accuracy
Between the two object space matching schemes, 3D LSM produced more accurate results but it also produced a lot of holes. This is because least squares estimation requires good initial points. Similar to the 2D case, LSM in 3D object space also required good initial heights.
Combination of 3D Correlation and 3D LSM
Based on these results, we could combine 3D correlation with 3D LSM to overcome the problem of 3D LSM and to produce the DEM with better accuracy. For this, we applied 3D LSM by using the heights generated from 3D correlation as initial heights.
In Table 5, the combination of 3D correlation and 3D LSM outperformed each individual matching scheme. Notably, the DEM from 3D correlation showed the significant bias of nearly 0.8 m and this was removed by 3D LSM. Figure 6 shows the DEM from the combination of 3D correlation and 3D LSM. By combining the two, the most of holes from 3D LSM were removed.
In 2D image space matching, the combination of correlation and LSM provides optimum solution in terms of accuracy and DEM coverage. In our experiments, we observed similar results for 3D object space matching. The combination of correlation and LSM improved the results of individual matching scheme. 0.00%
10.00% 20.00% 30.00% 40.00% 50.00%
1 2 3 4 5 6 7 8 9 10 11
0.00% 10.00% 20.00% 30.00% 40.00% 50.00%
1 2 3 4 5 6 7 8 9 10 11
0.00% 10.00% 20.00% 30.00% 40.00% 50.00%
1 2 3 4 5 6 7 8 9 10 11
Error(m) Error(m) Error(m)
Table 5. DEM accuracy test results by number of pyramid images
AVG(m) MAE(m) RMSE(m) 3D Correlation -0.7853 2.4676 4.0088 3D Correlation
+ 3D LSM
-0.1608 2.2543 3.8759
3D LSM -0.1670 2.2634 3.9023
Figure 6. DEM Images of Terrassa (3D Correlation + 3D LSM)
5. CONCLUSIONS
In this paper, we proposed a new least squares matching scheme based on the 3D object space. We introduced the concept and brief mathematical derivation of 3D LSM and showed its performance. We also compared 3D LSM with correlation matching based on image space and on object space. We showed that the combination of correlation and LSM in 3D object space could produce optimum DEMs similar to the 2D image space case.
The major contribution of this paper is that we proposed and validated that LSM can be applied to object space and that the combination of 3D correlation and 3D LSM can be a good solution for automated DEM generation from HRSIs. The work in the paper is on-going. Other aspects of 3D LSM and the experiments with other test dataset are being studied. These will be reported in near future.
REFERENCES
Kim, T., 2005. Singularity Mitigation in Automated DEM Extraction from IKONOS Images. Proc. of Asian Conference on Remote Sensing, 7-11 Nov., Hanoi, Vietnam.
Gruen A. and Baltsavias E., 1998. Geometrically Constrained Multiphoto Matching. Photogrammetric Engineering and Remote Sensing, vol. 54, No. 4, pp. 633-641.
Okutomi M. and Kanade T., 1996. A multiple-baseline stereo. IEEE Trans. Pattern Anal. Mach. Intell. Vol. 15, No. 4, pp. 353-363.
Lee, H. Y., Kim, T., Park, W., and Lee, H. K., 2003. Extraction of Digital Elevation Models from satellite stereo images through stereo matching based on Epipolarity and Scene Geometry. Image and Vision Computing, 21(9):789-796.
Gruen, A.W., 1985. Adaptive Least Squares Correlation : A Powerful Image Matching Techniques. South African Journal of Photogrammetry, Remote Sensing and Cartography. 14(3):175-187.