MAXIMUM LIKELIHOOD CLASSIFICATION OF HIGH-RESOLUTION SAR IMAGES
IN URBAN AREA
Maryam Soheili Majd, Elisabeth Simonetto, Laurent Polidori
L2G JE 2508, IRSTV FR CNRS 2488, ESGT, 1 Bd Pythagore, 72000 Le Mans, France [email protected]
KEY WORDS: SAR, Urban area, supervised classification, Maximum–Likelihood
ABSTRACT:
In this work, we propose a state-of-the-art on statistical analysis of polarimetric synthetic aperture radar (SAR) data, through the modeling of several indices. We concentrate on eight ground classes which have been carried out from amplitudes, co-polarisation ratio, depolarization ratios, and other polarimetric descriptors. To study their different statistical behaviours, we consider Gauss, log-normal, Beta I, Weibull, Gamma, and Fisher statistical models and estimate their parameters using three methods: method of moments (MoM), maximum-likelihood (ML) methodology, and log-cumulants method (MoML). Then, we study the opportunity of introducing this information in an adapted supervised classification scheme based on Maximum–Likelihood and Fisher pdf. Our work relies on an image of a suburban area, acquired by the airborne RAMSES SAR sensor of ONERA. The results prove the potential of such data to discriminate urban surfaces and show the usefulness of adapting any classical classification algorithm however classification maps present a persistant class confusion between flat gravelled or concrete roofs and trees.
1. INTRODUCTION
Statistical modelling is essential to SAR image interpretation. It can provide a technical support for a comprehensive understanding of terrain scattering mechanism, which helps to develop algorithms for effective image interpretation and creditable image simulation [1]. For that purpose, we concentrate to eight ground classes which have been carried out from amplitudes, co-polarisation ratio, depolarization ratios, and other polarimetric descriptors [2,3].
In the first part of this work, particular attention to several different theoretic and heuristic models for the probability distribution function (pdf) of SAR descriptors is proposed. After analyzing several parametric statistical distribution models (Gauss, Gamma, Beta, Weibull, Log-normal, Fisher), their parameters are estimated on real data according to different methods: method of moments (MoM), maximum-likelihood (ML) methodology, and log-cumulants method (MoML) [4]. Then the fitting of the estimated models is checked using K-S (Kolmogorov-Smirnov) test, correlation coefficients and visual analysis [5].
In the second part, a supervised technique for classification is proposed. For that purpose, an adapted likelihood distance measurement based on the previous statistical analysis is introduced in a Maximum Likelihood algorithm. In order to assess the performance of our method, our result is compared with other results from supervised classification such as SVM [6] or supervised ML Wishart classification [7]. The experiments are held on a POLSAR image provided by the RAMSES SAR sensor of ONERA over a suburban area.
The studied area and radar data are presented in the next part of this paper. We describe shortly the polarimetric indices used in the feature vector [8]. Then in the third part, we briefly expose the principle of the statistical analysis and results. In part four,
we deal with supervised classification methods and results. Conclusions are presented in the last part of the paper.
2. SITE AREA AND DATA SET 2.1 SAR data
We investigate the potential of X-band fully polarimetric data for discriminating between the principal classes present over a site around Toulouse, France (Figure 1). Data is from the ONERA airborne RAMSES (Radar Aéroporté Multi-Spectral d'Etude des Signatures) SAR [9, 10] and is delivered in SLC (Single Look Complex) format, acquired in 2006 with an incidence angle of 60° and a sub-metric pixel size in both azimuthal and range directions. These sampling sizes allow observing lots of urban objects (large and small buildings, natural and artificial soils). Because of the large incidence viewing angle, roofs are well represented whereas the facades are not visible [3].
2.2 Training data
The main objective is to estimate different urban classes, in particular we are interested in discriminating three types of building roofs: flat concreted or graveled roofs, sloped tiled roofs and metallic roofs. The other classes are labeled "lawns", including lawns and bare soils, "trees" including trees and small shrubs, "highways" including roads and car parks, and also two classes, "radar shadows" and "bright pixels" that have appeared useful to limit the misclassification rate.
International Archives of the Photogrammetry, Remote Sensing and Spatial Information Sciences, Volume XXXVIII-4/W19, 2011 ISPRS Hannover 2011 Workshop, 14-17 June 2011, Hannover, Germany
Figure 1. Studied site (Toulouse, France), represented in RGB Pauli composition
We define two sets of knowledge: training samples as input in the supervised classification and control samples to assess the classification performance. Training and control data has been manually extracted by visual interpretation of optical views and the radar image using the RGB Pauli representation. The list of knowledge data is summarized in Table 1.
Classes Training data Control data
Radar shadows 3596 2083
Highways (roads, parks…) 8538 12537
Lawns (lawns, bare soils) 17955 10163
Trees (trees, small shrubs) 4281 3719
Bright pixels 1990 766
Metallic roofs 546 423
Flat graveled or Concrete roofs 4958 2615
Sloped tiled roofs 235 240
Table 1. Training and control samples in pixel number
2.3 Polarimetric descriptors
The fully polarimetric radar system records the complete characterization of the scattering field in all the configurations (HH, VV, HV, and VH), with their intensities or amplitudes and relative phases. The recorded polarimetric data allows a better characterization of the scatters based on the decomposition theorems [8]. In this work, we use several descriptors of interest summarized in Table 2.
3. STATISTICAL ANALYSIS
The precise knowledge of the statistical properties of the SAR data plays a central role in SAR image processing and understanding. The purpose of this part of paper is to test the availability of discriminating each type of surface according to its statistical behavior and modeling the polarimetric indices by a theoretical model. The process of parametric modeling consists of: (1) selecting several known statistical distribution models; (2) estimating the distribution parameters; (3) assessing the goodness-of-fit of the models [1].
Table 2. Polarimetric parameters considered in this work
We selecte the most widely used distributions in the literature, which are the Gauss, Gamma, Weibull, Beta I, Lognormal, and Fisher pdfs. The goal is to determine which one is the most appropriate for SAR data statistical characterization. We expect the Fisher distribution to be the more appropriate as it has already been adopted for the high-resolution SAR statistics over urban regions [4,11,12].
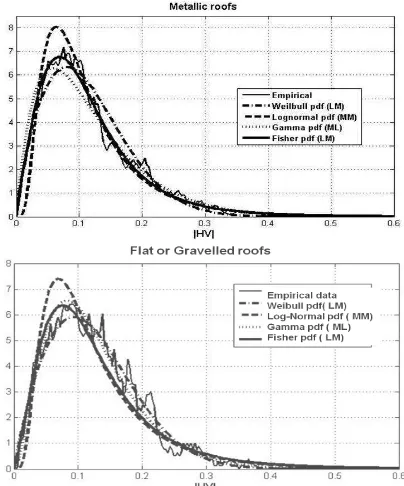
Three methods of estimation of the parameter are considered. These methods are method of moments (MoM), maximum-likelihood (ML) methodology, and log-cumulant method (MoML) [4]. For comparison, we represent in Figure 2, the different results of estimated parameters of Gamma, Weibull, Log-normal, and Fisher distributions for one descriptor and two classes using MoM and ML. We notice that the curve of the Fisher distribution is situated between the Gamma distribution and Weibull distribution curves.
Figure 2. Empirical |HV|-histograms and pdfs estimated using ML or MoM for two classes
We use different approaches to realize a GoF (Goodness-of-Fit) test between empirical model and theoretical parametric model [12]: the popular Kolmogorov-Smirnov test, correlation coefficients and visual analysis. As general remark, the ML estimation method is more accurate than the MoM. Nevertheless, in the case where the number of the independent
No. Feature Expression
1 |Red Pauli | R =|S - S |/(√2)
2 |Blue Pauli | B =|S + S |/(√2)
3 Amplitude |S |
4 Amplitude |S |
5 Amplitude |S |
6 Entropy (H) ∑ P log(P )
7 Anisotropy A= (λ2- λ3 )/ (λ2+ λ3) 8 Alpha α= α1P1+P2 α2 + P3α3 9 Copolarisation ratio |HH|/|VV|
10 |HV|/|VV|
11 Depolarisation ratios |HV|/|HH|
International Archives of the Photogrammetry, Remote Sensing and Spatial Information Sciences, Volume XXXVIII-4/W19, 2011 ISPRS Hannover 2011 Workshop, 14-17 June 2011, Hannover, Germany
samples is sufficients, the MoM provides a precise estimate of the value of the parameters with a lower computation time. With our high-resolution image, it turns out that the Fisher distribution leads to the best modeling of SAR descriptors. Fisher parameters estimated by the MoML fit better the empirical distributions than the one estimated by MoM whereas the one estimated by ML are the most relevant. However, in some cases, ML estimation does not lead to any result. For these reasons, we select the Fisher distribution, using MoML, to model POLSAR descriptors. The result of the statistical analysis using Fisher pdf, in each of all eight classes, for two different descriptors, is shown in Figure 3.
Figure 3. Estimated Fisher distribution by MoML for the eight classes and two different descriptors
4. CLASSIFICATION AND RESULTS 4.1 Methodology
For classification of polarimetric SAR images, several methods have been proposed. Some of them are based on physical scattering mechanisms using various polarimetric decomposition methods. For example, the target entropy (H) and scattering angle (α) are calculated from such decomposition. H provides information on the scattering degree of randomness and α indicates the nature of the scattering mechanism. By dividing H and α plane into eight zones, different physical scattering characteristics of a terrain can be classified[13,24]. Or using more descriptors, the polarimetric information is converted into three parameters (H, α and Anisotropy A) to which a physical interpretation is associated [15].
Some other classification methods are based on statistical characteristics of data and coherency matrix and derive a distance measure based on the complex Wishart distribution [7] or the complex Gaussian distribution. We use it for maximum-likelihood (ML) classification of single-look polarimetric SAR data.
Also there exist classification algorithms based on image processing techniques: unsupervised approaches using for instance the Markov theory [11,16,17] or supervised
approaches, for example using Support Vector Machine (SVM) [6].
In a first experiment [3], the data made from the 11 polarimetric descriptors, was classified using unsupervised H/α Wishart classification (with POLSARPRO). The result was very confused. Then a decision tree was manually built, in order to reduce classification ambiguities. This leads to better results, with overall accuracy close to 70%. This first experiment tends to the object that the initial classification algorithms have not exploit all the statistical information of the 11 polarimetric descriptors. However, a decision tree is not a good solution as it is manually built according to the class ambiguities that we can observe in the classified image. Using a supervised classification such as SVM, a decision tree seems to be less useful (see Table 3). However, some ambiguities, in particular between shadows and highways and between flat roofs and trees are present in both results.
So, we think that an automatic classification algorithm may be built, based on adapted statistical criteria, and improve the result. In this context, we propose a supervised ML classification method based on Fisher pdf as prior knowledge. The performance of this new algorithm, implemented in MATLAB, is compared with three different methods of supervised approaches: SVM classification (using ENVI), G-ML (circular Gaussian-based G-ML) classification (MATLAB code) and Complex Wishart classification (MATLAB code). For this last method, the ML criterion is performed on the polarimetric covariance matrix and not on the 11 descriptors.
4.2 Results
Table 3 give the performance of the different approaches. Let us note that each classification result is largely improved by a local 5x5 majority vote. Besides, in order to use ENVI SVM algorithm, we were compelled to reduce the size of the training samples.
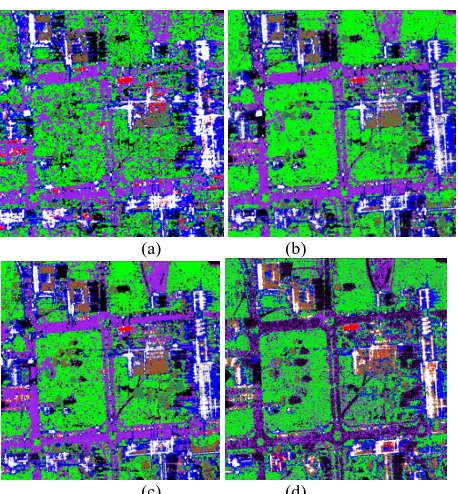
The adapted ML Fisher classification based on the 11 descriptors has not led to better results than the G-ML algorithm (figure 4). This may be due to the fact that we assume in our Fisher criterion that the 11 descriptors are independent. In addition, ambiguities between highways and radar shadows and also between flat roofs and trees still occur.
The Wishart based classification result is more noisy than the two previous ones. In the SVM result, important confusions occur between highways and shadows.
The rate of good classification of sloped tiled roof pixels seems perfect. However the image shows few sloped roofs and we think that in a larger area, one class (and so one training sample) should be defined for each different orientation of slope compared to the radar antenna side-looking angle.
5. CONCLUSIONS AND PERSPECTIVES This paper has presented a validation of the Fisher pdf to model eleven polarimetric descriptors and a new supervised ML classification based on the Fisher pdf. The result is compared with several supervised classification results (SVM, ML based on a Gaussian pdf, Complex Wishart ML algorithm). The overall performance obtained with the different classifications is around 70%. The classification result from Fisher ML criterion, although it does not show the best overall accuracy, seems less noisy than the others. Nevertheless misclassifications still occur between flat graveled or concrete roofs and trees.
International Archives of the Photogrammetry, Remote Sensing and Spatial Information Sciences, Volume XXXVIII-4/W19, 2011 ISPRS Hannover 2011 Workshop, 14-17 June 2011, Hannover, Germany
Although the results could seem poor compared to those that one can obtain using an optical data, a first work has shown that the radar classified image provide a complementary information to a spectral classified map [18].
In the future works, we will study a new Fisher ML criterion that take into account the correlation between the eleven descriptors. Besides, polarimetric correlation descriptors should be introduced in our analyse. Then we project to extend our work to unsupervised ML algorithm.
From these results, we think that contextual information is necessary to discrimate flat graveled or concrete roofs from trees. Contextual information could be other radar images (with different wavelength), spectral data, or geometric information (shape or elevation). These topics may be investigated in future studies.
Shadows Highways Lawns Trees Bright Pixels
Table 3. Performance of tested classification methods. DT=Decision Tree. F-ML = ML method based on Fisher pdf.
W-ML = Wishart ML classification
(a) (b)
(c) (d)
Figure 4: Classification result: (a) SVM (b) G-ML (c) F-ML (d) Wishart ML
REFERENCES
[1] G. Gao, “Statistical Modeling of SAR Images: A Survey,” National University of Defence Technology, Changsha 410073, Sensors, vol. 10, pp. 775-795, 2010.
[2] J.-S. Lee, E. Pottier, “Polarimetric Radar Imaging: From Basics to Applications,” ser. Optical Science and Engineering, Frascati, Italy, Apr. 2009.Boca Raton, USA: CRC Press, n. 143, 2009.
[3] E. Simonetto, C. Malak, “Urban area structuring mapping using an airborne polarimetric SAR image,” in Proc. SPIE Remote Sensing, vol. 7477, 74771X, 2009.
[4] J.M. Nicolas, “Application de la transformée de Mellin: Etude des lois statistiques de l’imagerie cohérente,” Ecole Nationale Supérieure des Télécommunications, Paris, France, Tech. Rep. 2006. D010.
[5] V. Krylov, G. Moser, Sebastiano B. Serpico, Zerubia, “Modeling the statistics of high resolution SAR images,” inria-00342681, version 2 - 30 Jan 2009.
[6] S. Fukuda, H. Hirosawa, “Support vector machine classification of land cover: application to polarimetric SAR data,” IGARSS ’01, vol. 1, pp. 187–189, Sydney, Australia, July 2001.
[7] J.S. Lee, M.R. Grunes, E. Pottier, “Quantitative Comparison of Classification Capability : Fully Polarimetric versus Multipolarisation SAR,” IEEE Transactions on Geoscience and Remote Sensing, Vol 39, pp 2343 2351, November 2001.
[8] S.R. Cloude, E. Pottier, “A Review of Target Decomposition Theorems in Radar Polarimetry,” IEEE TGRS, vol. 34, no. 2, pp. 498-518, Sept. 1995.
[9] J.M. Boutry, “ONERA airborne SAR facilities,” Presented at 2nd Int. Airborne Remote Sensing Conf., San Francisco, USA, June 1996.
[10] P. Dreuillet, H. Cantalloube, E. Colin, P. Dubois-Fernandez, X. Dupuis, P. Fromage, F. Garestier, D. Heuze, H. Oriot, J. Peron, J. Peyret, G. Bonin, O. Du Plessis, J. Nouvel, B. Vaizan, “The ONERA RAMSES SAR: latest significant results and future developments,” IEEE Conf. Radar, pp. 518-524, 2006.
[11] C. Tison, J.M. Nicolas, F. Tupin, H. Maître, “A new statistical model for markovian classification of urban areas in high resolution SAR images,” IEEE TGRS, vol 42, issue 10, pp 2046-2057, 2004.
[12] L. Bombrun et J.-M. Beaulieu, “Fisher Distribution for Texture Modelling of Polarimetric SAR Data,” IEEE Geoscience and Remote Sensing Letters, Juillet 2008, Vol. 5, n. 3, pp. 512-516.
[13] S.R. Cloude, E. Pottier, “Entropy based classification scheme for land Applications of polarimetric SAR,” IEEE TGRS, vol. 35, pp. 68-78, January 1997.
[14] J.S. Lee, M.R. Grunes, E. Pottier, L. Ferro-Famil, “Unsupervised terrain classification preserving scattering characteristics,” IEEE TGRS, vol. 42, no. 4, pp. 722-731, April, 2004.
[15] J.S. Lee, M.R. Grunes, T.L. Ainsworth, L.J. Du, D.L. Schuler, S.R. Cloude, “Unsupervised Classification using Polarimetric Decomposition and Complex Wishart Distribution,” IEEE TGRS, vol. 37/1, N. 5, pp. 2249-2259, Sep 1999.
[16] G. Moser, V. Krylov, S.B. Serpico, J. Zerubia, “High-resolution SAR-image classification by Markov random fields and finite mixtures,” Proc. SPIE Electronic imaging, vol 7533, 753308, 2010.
[17] E. Simonetto, H. Oriot, R. Garello, “Extraction of industrial buildings from stereoscopic airborne radar images,” Proc. SPIE Remote Sensing, vol. 4543, pp. 121-129, 2002.
[18] N. Long, E. Simonetto, E. Bocher, “A conbined approach to detect urban features from multi-spectral and radar data”, IGARSS, pp. 1469-1472, Honolulu, Hawaii, 25-30 July 2010.
ACKNOWLEDGMENT
We thank ONERA/DEMR for providing the RAMSES data.
International Archives of the Photogrammetry, Remote Sensing and Spatial Information Sciences, Volume XXXVIII-4/W19, 2011 ISPRS Hannover 2011 Workshop, 14-17 June 2011, Hannover, Germany