UAVS TO ASSESS THE EVOLUTION OF EMBRYO DUNES
Y. Taddiaa,∗, C. Corbaub, E. Zambelloa, V. Russoc, U. Simeonib, P. Russoaand A. Pellegrinellia
aEngineering Department, University of Ferrara, Saragat 1, 44122, Ferrara, Italy
-(yuri.taddia, elena.zambello, alberto.pellegrinelli, paolo.russo)@unife.it,
bPhysics and Earth Sciences Department, University of Ferrara, Saragat 1, 44122, Ferrara, Italy
-(corinne.corbau, umberto.simeoni)@unife.it, c
ERREALCUBO, Engineering and Architecture Technical Studio, Ghirardacci 1, 40137, Bologna, Italy -([email protected])
KEY WORDS:Embryo Dunes, Geomorphological Evolution, Coastal Environment, Unmanned Aerial Vehicles (UAVs), Structure
from Motion (SfM), Photogrammetry, Low-Cost Multispectral Sensor, Agisoft PhotoScan
ABSTRACT:
The balance of a coastal environment is particularly complex: the continuous formation of dunes, their destruction as a result of violent storms, the growth of vegetation and the consequent growth of the dunes themselves are phenomena that significantly affect this balance. This work presents an approach to the long-term monitoring of a complex dune system by means of Unmanned Aerial Vehicles (UAVs). Four different surveys were carried out between November 2015 and November 2016. Aerial photogrammetric data were acquired during flights by a DJI Phantom 2 and a DJI Phantom 3 with cameras in a nadiral arrangement. GNSS receivers in Network Real Time Kinematic (NRTK) mode were used to frame models in the European Terrestrial Reference System. Processing of the captured images consisted in reconstruction of a three-dimensional model using the principles of Structure from Motion (SfM). Particular care was necessary due to the vegetation: filtering of the dense cloud, mainly based on slope detection, was performed to minimize this issue. Final products of the SfM approach were represented by Digital Elevation Models (DEMs) of the sandy coastal environment. Each model was validated by comparison through specially surveyed points. Other analyses were also performed, such as cross sections and computing elevation variations over time. The use of digital photogrammetry by UAVs is particularly reliable: fast acquisition of the images, reconstruction of high-density point clouds, high resolution of final elevation models, as well as flexibility, low cost and accuracy comparable with other available techniques.
1. INTRODUCTION
Digital Elevation Models (DEMs) are a fundamental tool to de-tect the morphology of a system, especially when the shapes are very complex and change rapidly in both time and space. Many different techniques are now available for generating DEMs, with a wide range of spatial resolution.
In a discrete approach, an even larger number of points can be directly surveyed using GNSS by means of a fast Network Real Time Kinematic (NRTK) technique or a total station in order to manually map shapes: however, this method is very time consum-ing and cannot be applied to broad extensions. Other approaches, with more dense (and practically continuous) data, such as Ter-restrial Laser Scanners (TLS), airborne LIDAR (LIght Detection And Ranging) and aerial photogrammetry by Unmanned Aerial Vehicles (UAVs), allow the mapping of wide areas with good ac-curacies.
In recent years, LIDAR has been the most commonly employed technique for the mapping of long coastline stretches. Although the raw data acquired by LIDAR have higher resolution, the data processing is generally set up to provide a resampled model with a ground sample distance of about 0.5 – 1 meters. However, for the currently available LIDAR data, the characteristics of the instruments used to acquire the raw data are not well known, nor are the processing procedures (filtering and georeferencing techniques) applied to the raw data to obtain the final products (clouds, DEMs). This type of approach is certainly very good for
∗Corresponding author
monitoring large areas, especially using helicopters to adjust the speed of flight. However, the sandy coastal environment evolves rapidly and is easily affected by many natural and human fac-tors. For advanced studies in coastal geomorphology, a different method is needed, able to provide better spatial resolutions at a more reasonable cost.
The recent availability of increasingly lightweight and compact digital cameras, the continuous development of algorithms in computer vision and the use of even smaller UAVs has trans-formed classical aerial photogrammetry into new digital pho-togrammetry for a Structure from Motion (SfM) approach, pro-viding excellent results in terms of spatial resolution at low cost (Westoby et al., 2012).
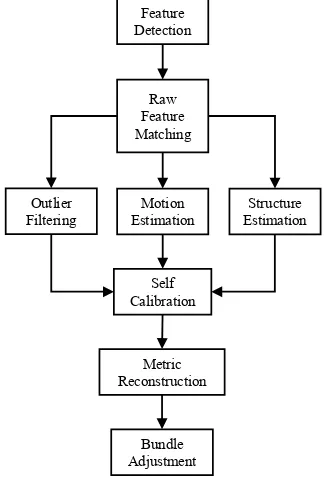
The SfM process is an advanced computer vision method: since a complete and detailed explanation of SfM is beyond the scope of this paper, only information relevant to geomatics applications will be given. A general workflow is shown in Figure 1.
and modeled in terms of both symmetric and asymmetric radial distortion. Once the 3D geometry is reconstructed, a dense point cloud can be obtained with specialized algorithms able to recon-struct depths: the dense cloud, containing up to ca. 80 million points, is the basis for any further processing.
To georeference the dense point cloud, a set of GCPs was sur-veyed by GNSS geodetic receivers through NRTK: accuracies achievable in this way are completely comparable with the SfM approach. To frame the model in the same reference system of Ground Control Points, a bundle adjustment procedure was adopted, within the same software used to perform the geome-try reconstruction (Agisoft PhotoScan Professional). Bundle ad-justment can consider nonlinearities, providing better results than with a simpler similarity transformation.
Feature
Figure 1. The Structure from Motion workflow
Structure from Motion by UAVs was adopted for all the above reasons, especially its versatility, low cost and significantly higher spatial resolution. There are few reports in the literature of applications similar to the one presented in this paper: one of the most recent can be found in (Gonc¸alves and Henriques, 2015) concerning a sandy coastal environment. Other authors tested the SfM approach with UAV (Mancini et al., 2013) or investigated the accuracy of georeferenced point clouds produced via multi-view stereopsis from UAV imagery (Harwin and Lucieer, 2012) in analogue operative conditions.
An innovative aspect of the present study is repetition of the sur-vey for the purpose of monitoring the study area in order to ana-lyze and explain the dynamics of the geomorphological evolution of the beach and the complex dune system. The monitoring also considered the vegetation distribution, with an experimental in-tegration of multispectral data collected via a low-cost sensor in addition to the RGB images.
2. THE CASE STUDY
Beaches often have a vegetated dune system that performs a mul-titude of functions valuable to the ecosystem: protection against
ingression of the sea during storms, reserve deposits to mitigate the erosion of shorelines, ecological niches for flora and fauna. In a natural evolutionary context, avandunes are preceded by em-bryo dunes characterized by high dynamics. The site chosen for the monitoring (Fig. 2a) presents all the typical characteristics of a dune system mentioned above. It is located in the northern Adriatic Sea between Venice and the Po River delta (Italy), more precisely in the southern part (3 km long) of Rosolina Mare, in the Porto Caleri area. The beach is up to three hundred meters wide in the North-South direction and is bounded to the land side by a complex strip of dunes consisting of stabilized fossil dunes, vege-tated avandunes and embryo dunes, proceeding from land to sea. The back-dunes environment is characterized by the presence of infra-dune depressions where rainwater is collected, allowing the growth of a particular hygrophilous vegetation. Stabilized dunes are covered with a patch of bushy plants that spatially precedes arboreal formations, such as the forest of autochthonous holm oaks or pine forests of artificial origin. Inclusion of this coastal section in the “Coastal Botanical Gardens” of Porto Caleri (ca. 23 ha in extent) ensures complete conservation and natural evo-lution of this coastal environment, without any significant impact of human activities. Hence the site is perfectly suitable for study of the natural geomorphological evolution of dunes, from their creation to their stabilization. Over the past 50 years, the entire southern coast of Rosolina Mare has been characterized by a sig-nificant progradation of the shoreline, with a maximum of 5 me-ters per year, and thus presents an evident coastline displacement. Figure 2b shows the progress of the limit of embryo dunes over about 20 years, as detected by aerial orthophotos and satellite im-ages. Survey techniques based on remote sensing from satellites, often conducted with reference to the evolution of shorelines, are known in the literature (Alesheikh et al., 2007). This progra-dation phenomenon is still active at the monitored site. From a geomorphological point of view, embryo dunes present the most interesting shapes because they are very sensitive to even small changes in coastal environment factors and they can quickly be destroyed as they are created. However, due to the prograda-tion in this area, mainly caused by aeolian transport (Lynch et al., 2009), the embryo dunes generally grow and join each other.
3. SURVEYING METHODOLOGY
Unmanned Aerial Vehicles were used to detect and reconstruct the morphology of the dune system, in particular as regards the embryo dunes characterized by small size and where LIDAR res-olution (resampled at 0.5 – 1 m GSD) is unsuitable for this pur-pose (Casella et al., 2016). This choice was dictated by the great potential of the technique, including relatively fast acquisition of individual images, the possibility to obtain very high resolution orthophotos (Wulder et al., 2004) with a Ground Sample Distance of about 2 centimeters at a flight altitude of 40 meters, as well as the low cost.
available at the time of the first survey. It was also very interesting to test a UAV equipped also with a low-cost multispectral sensor instead of always using the same camera mounted on the DJI Phantom 2; indeed the SfM approach with bundle adjustment can model every kind of camera, with very good estimation of all intrinsic parameters and lens distortion, especially when there is a redundant set of images, thus minimizing the influence of the adopted camera on the final accuracy of each survey.
1990
2009
0 50 100 150 200 250 500 m
b
SITE
Rosolina
a
Figure 2. (a): Study area (Google Earth); (b): Progradation of embryo dunes
Figure 3. DJI Phantom 3 equipped with a Sentera Single sensor
Four survey repetitions were carried out in November 2015, March 2016, June 2016 and November 2016. For each flight, a specific programmed mission was set up: generally, due to the limited autonomy of the UAV (related to battery capacity) as well as the need to maintain a low altitude to ensure the desired spatial
resolution, a minimum of two flights per repetition were neces-sary to map the full extension of the monitored area.
The main parameters set for flight plans were: flight altitude 40 meters, longitudinal overlapping of 80%, transverse overlapping of 60%, speed ca. 3 m/s, camera in a nadiral asset. The other camera settings were varied according to the real brightness at the time of each flight.
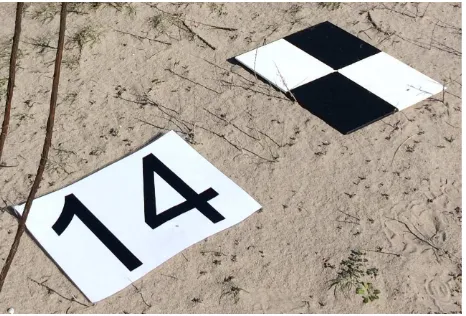
All the surveys were framed within the international reference system, in its ETRF 2000 (2008.0) realization, materialized in Italy by the National Dynamic Network (RDN). Targets used as Ground Control Points (Fig. 4), generally between 14 and 18, were distributed over the ground to almost completely enclose the surveyed area (Fig. 5). The targets, well visible in aerial im-ages and with a clear and unmistakable position of their centers, were surveyed with GNSS geodetic receivers in Network Real Time Kinematic (NRTK) mode. The accuracy achievable with a kinematic “stop and go” technique, with corrections transmitted in real time from a network of permanent stations (the ItalPoS service was used for this purpose), is sufficient and completely compatible with the precision of a 3D model generated by aerial photogrammetry with a Structure from Motion approach. The need for post-processing to calculate the coordinates of the tar-gets is also eliminated in this way. The ITALGEO 05 geoidal separation model was used to convert ellipsoidic heights to or-thometric elevations.
Figure 4. Example of a target used as Ground Control Point
Furthermore, the necessity to number each GCP to recognize it in the aerial images was successfully overcome thanks to the GPS EXIF metadata in the images acquired with the DJI Phantom 3 native camera: in fact, relative distances from one target to the others are an order of magnitude higher than the error of the air-craft on-board single frequency GPS, so the raw alignment per-formed using the camera positions is sufficiently precise to estab-lish the most suitable coordinates to apply for each GCP.
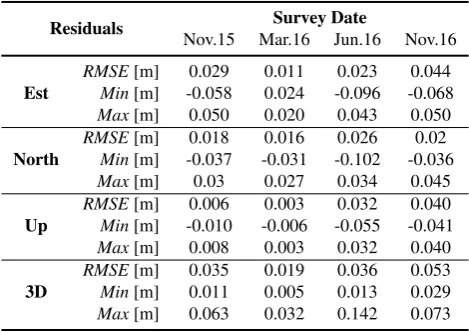
In a further alignment using the GCPs, the camera positions were ignored due to their poor accuracy, and they were assigned a very low weight or even directly deleted; optimization for reproject-ing was performed after the final alignment in order to best fit the intrinsic parameters of the camera and to ensure the maxi-mum possible accuracy of the 3D model (Fig. 6). A summary of residuals is shown in Table 7.
Figure 5. Ground Control Points location
Figure 6. Motion and Structure reconstruction
Residuals Survey Date
Nov.15 Mar.16 Jun.16 Nov.16
Est
RMSE[m] 0.029 0.011 0.023 0.044
Min[m] -0.058 0.024 -0.096 -0.068
Max[m] 0.050 0.020 0.043 0.050
North
RMSE[m] 0.018 0.016 0.026 0.02
Min[m] -0.037 -0.031 -0.102 -0.036
Max[m] 0.03 0.027 0.034 0.045
Up
RMSE[m] 0.006 0.003 0.032 0.040
Min[m] -0.010 -0.006 -0.055 -0.041
Max[m] 0.008 0.003 0.032 0.040
3D
RMSE[m] 0.035 0.019 0.036 0.053
Min[m] 0.011 0.005 0.013 0.029
Max[m] 0.063 0.032 0.142 0.073
Table 7. Summary of the residuals
Once the geometry was reconstructed, a dense cloud was created with robust algorithms of densification implemented in the Ag-isoft PhotoScan software. However, this dense cloud contains points belonging to the vegetation that are not helpful to describe and analyze morphological changes over time. To exclude these points in further processing (including creation of Digital Ele-vation Models) a filter based on slope detection, already avail-able within Agisoft PhotoScan, was applied. This filter (Agisoft, 2015) works through two steps: in the first one, the entire dense cloud is divided into several square cells of a specified size (5 meters×5 meters is the value adopted in this work) and the
low-est point of each cell is assumed to belong to the ground. A first raw model of the ground itself is created in this way. In the sec-ond step, all other points are classified by analyzing both their distance and slope from the ground-classified points. Threshold values for distances and slopes must be specified: in this work the adopted values were 0.15 meters and 15°. The final dense cloud of ground-classified points is shown in Figure 8, where brown areas represent points classified as effective ground.
Figure 8. Ground points classification
Before proceeding with the creation of a Digital Elevation Model of the sandy terrain, a further statistical outlier filter was applied to the dense cloud (in the CloudCompare software) in order to remove residual points. Figure 9 shows the effect of this kind of filter: on the left (Fig. 9a) a raw dense point cloud zoom, on the right (Fig. 9b) the same area after the application of a statistical outliers removal filter. Values for parameters to set in such a filter should be carefully assumed each time in order to maximize the filtering effect.
a
b
Figure 9. Statistical Outliers Filter
Finally, a set of specially surveyed (by NRTK) points was added to the dense cloud to integrate zones where vegetation was re-moved. The entire process described above, with issues and adopted solutions, is summarized in Figure 10, which shows a raw dense cloud profile schematization (Fig. 10a), application of the slope detection algorithm for the ground points classification (Fig. 10b) and the final integration with specially surveyed GNSS points to reconstruct a more faithful profile of the dense cloud (Fig. 10c). Examples of botanical species found in the dune sys-tem areAmmophila arenaria(Fig. 10d) andEchinophora spinosa
(Fig. 10e). The Digital Elevation Model was created by rasteri-zation of the dense cloud, since the density of points was so high (up to 80 million points) as to make it unnecessary to create a Triangulated Irregular Network (TIN) as intermediate step.
to survey directly on the sand, e.g. by using a plate in order to pre-vent the pole tip from sinking, which could have been an impor-tant source of errors even if a hypothetical value for the sinking were taken into account. Furthermore, the check was used to val-idate the accuracy of the elevation model with respect to the real beach morphology. The results are shown in Figure 11, where both the mean and standard deviation values show the full com-patibility with the NRTK method of surveying used to reference the model.
Vegetation Raw dense cloud profile
Real beach morphology GNSS point
Real beach morphology
Dense cloud profile after filter application
Real beach morphology
GNSS point Dense cloud profile after integration by GNSS
a
b
c
d
e
Figure 10. Schematization of the GNSS integration process
−0.08 −0.07 −0.06 −0.05 −0.04 −0.03 −0.02 −0.010 0 0.01 0.02 0.03 0.04 0.05 0.06 0.07 0.08 standard deviation = 0.038 m
Figure 11. Validation results
In addition, a cross section profile was reconstructed through GNSS NRTK in the last survey in order to further validate the use of a plate under the pole. Figure 12 shows the results of a comparison between this profile and its DEM extraction. With the exception of some outliers where the influence of vegetation was still present, the mean value of -1.2 cm for the difference between DEM (red line) and GNSS profiles (blue line) shows an accuracy comparable with the use of NRTK to provide the verti-cal datum.
0 10 20 30 40 50
GNSS surveyed profile DEM extracted profile
60 m
Figure 12. Comparison between GNSS and DEM profiles
4. MULTISPECTRAL LOW-COST SENSOR INTEGRATION
In remote sensing, near infrared (NIR) wavelengths are used to detect the health status of vegetation, typically through satellite images. Many different kinds of low-cost sensors are available to equip UAVs. They are mainly employed in the precision agricul-ture context, although many different applications can take ad-vantage of their ability to detect NIR. The DJI Phantom 3 Pro-fessional used in almost every survey (except the first one) was equipped with the Sentera Single, a low-cost multispectral sen-sor. It is a very small camera with a 1.2 megapixel CMOS, global shutter, HFOV 60°, very low distortion optics and a weight of only 30 grams (Fig. 13). The Sentera Single sensor has a high-pass filter to exclude blue frequencies and then record NIR infor-mation in the blue channel. During each flight, the multispectral sensor was automatically set to acquire images: the only precau-tion needed was to plan flights taking account of the different field of view of this camera with respect to the RGB camera so as to avoid deficiencies in the texture on the RGNIR orthophotos. Once acquired, the RGNIR images were processed following the same steps as the RGB images, even though the final orthophoto was resampled to a wider GSD size (about 50 cm) because the multispectral survey was subsequently used only to recognize the different vegetation density in the dune system and not to analyze the health status of plants. A lower resolution can help to smooth outliers in the calculated NDVI index and provides more reliable data to describe the density distribution of the vegetation.
Figure 13. Both the RGB camera and the Sentera Single sensor
The use of the NIR information instead of the simple RGB data has shown how this complementary multispectral knowledge can be successfully exploited to analyze the vegetation distribution and density. This allows a better understanding of the relation-ship of the growth of various kinds of vegetation and the stage of development of dunes, even if a natural color high resolu-tion orthophoto makes possible more precise mapping of differ-ent botanical species (at the expense of the longer time required).
Figure 14. Vegetation density estimation through NDVI
5. RESULTS
After validation of the Digital Elevation Model (an example is shown in Fig. 15) generated for each survey, with validation val-ues similar to those previously shown in Figure 11, a series of further information was extracted and then compared.
Figure 15. Example of the Digital Elevation Model (DEM)
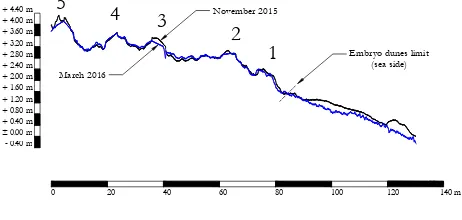
To monitor changes in the morphology, ten cross sections and three longitudinal sections were used to extract profiles. Fig-ure 16 illustrates a typical profile analysis conducted on a cross section to evaluate the winter season effects: geologists recog-nized five different steps in the evolution of embryo dunes, num-bered from 1 (very embryonic) to 5 (vegetation-stabilized embryo dunes).
± 0.00 m - 0.40 m + 0.40 m + 0.80 m + 1.20 m + 1.60 m + 2.00 m + 2.40 m + 2.80 m
0 20 140 m
+ 3.20 m + 3.60 m + 4.00 m + 4.40 m
40 60 80 100 120
5
4
3
2
1
March 2016
November 2015
Embryo dunes limit (sea side)
Figure 16. Cross section profile
A strength of aerial imagery by UAVs, with respect to traditional discrete and time-consuming methods of surveying based on the
use of total stations or GNSS receivers in NRTK, is the possibil-ity to make cross sections in any area of the model at any time, since the data is practically continuous. In addition, an elevation difference was computed for the whole extent of the overlapping between different surveys: in this way it was possible to com-pute a sediment budget through all the compared area extents, in a very simple manner. Figure 17 shows the elevation differences between the last and the first survey, respectively performed in November 2016 and November 2015. Red zones represent accu-mulation (positive sediment budget), while blue zones represent erosion (negative budget). Differences between the last model and all the previous ones were computed each time in order to have a sort of chronology of geomorphological evolution of the whole dune system.
A further analysis that could be performed with DEMs is an eval-uation of marine water ingression through the aeolian channels. Figure 18 shows a very simple example of this kind of process-ing: blue zones represent areas reached by water at a given sea level. A more precise analysis should be conducted considering the full dynamics of the waves, but this is beyond the scope of the present paper.
-0.40 m -0.30 m -0.20 m -0.10 m 0.00 m +0.10 m +0.20 m +0.30 m +0.40 m
Legend
Figure 17. Computation of elevation differences
Figure 18. Example of computation of sea ingression
6. CONCLUSIONS
a Structure from Motion approach using Unmanned Aerial Vehi-cles. This kind of technique combines the accuracy and resolu-tion of laser scanning with very low costs, making it possible to repeat surveys in shorter time intervals. The Structure from Mo-tion approach can be used to reconstruct three-dimensional ge-ometry and it models both the cameras intrinsic parameters and lens distortion, allowing the use of different cameras if necessary. The bundle adjustment can take into account all nonlinearities, in such a way as to ensure the maximum final accuracy. Further-more, the effect of vegetation on the reconstructed surface can be mitigated by the application of slope detection and statistical outliers filters in order to minimize the influence of these factors on the subsequent model comparisons. The use of Network Real Time Kinematic GNSS speeds up the survey of the GCPs needed to georeference dense clouds, DEMs and orthophotos, with ac-curacies comparable with the final precision achievable with the SfM approach. The workflow of the entire process is not very difficult, even though particular care should always be taken and validation through a comparison between data is crucial, in par-ticular whenever interpolation algorithms are used. The commer-cial availability of simple UAVs and software implementing SfM should expand the use of these techniques, not only for coastal environments but wherever rapid acquisition is needed and high resolution must be achieved. Many types of applications can be found in both the scientific and technical literature. Further de-velopments of the present case study should include the use of multispectral data to support filtering algorithms, since residual effects caused by vegetation are still recognizable in some ar-eas of the models. In a more general context, the use of NRTK implemented directly on the UAVs would certainly speed up the survey, avoiding the necessity of ground control points. Instead, small LIDAR directly mounted on UAVs will be an interesting alternative technique. However, at present, photogrammetry still represents a technique able to achieve high spatial and temporal resolution at a truly affordable cost.
REFERENCES
Agisoft, 2015. Agisoft Photoscan User Manual, Professional Edi-tion, Version 1.2.
Alesheikh, A. A., Ghorbanali, A. and Nouri, N., 2007. Coastline change detection using remote sensing. International Journal of
Environmental Science & Technology, 4(1), pp. 61–66.
Casella, E., Rovere, A., Pedroncini, A., Stark, C. P., Casella, M., Ferrari, M. and Firpo, M., 2016. Drones as tools for monitor-ing beach topography changes in the Ligurian Sea (NW Mediter-ranean).Geo-Marine Letters, 36(2), pp. 151–163.
Gonc¸alves, J. A. and Henriques, R., 2015. UAV photogrammetry for topographic monitoring of coastal areas. ISPRS Journal of
Photogrammetry and Remote Sensing, 104, pp. 101–111.
Harwin, S. and Lucieer, A., 2012. Assessing the Accuracy of Georeferenced Point Clouds Produced via Multi-View Stereopsis from Unmanned Aerial Vehicle (UAV) Imagery.Remote Sensing, 4(6), pp. 1573–1599.
Hugenholtz, C. H., Whitehead, K., Brown, O. W., Barchyn, T. E., Moorman, B. J., LeClair, A., Riddell, K. and Hamilton, T., 2013. Geomorphological mapping with a small unmanned aircraft sys-tem (sUAS): Feature detection and accuracy assessment of a photogrammetrically-derived digital terrain model. Geomorphol-ogy, 194, pp. 16 – 24.
Lynch, K., Jackson, D. W. and Cooper, J. A. G., 2009. Fore-dune accretion under offshore winds. Geomorphology, 105(12),
pp. 139 – 146. Contemporary research in aeolian geomorphology 6th International Conference on Aeolian Research (ICAR VI).
Mancini, F., Dubbini, M., Gattelli, M., Stecchi, F., Fabbri, S. and Gabbianelli, G., 2013. Using Unmanned Aerial Vehicles (UAV) for High-Resolution Reconstruction of Topography: The Struc-ture from Motion Approach on Coastal Environments. Remote
Sensing, 5(12), pp. 6880–6898.
Westoby, M., Brasington, J., Glasser, N., Hambrey, M. and Reynolds, J., 2012. Structure-from-Motion photogrammetry: A low-cost, effective tool for geoscience applications. Geomorphol-ogy, 179, pp. 300 – 314.