AN ITERATIVE PIXEL-LEVEL IMAGE MATCHING METHOD FOR MARS MAPPING
USING APPROXIMATE ORTHOPHOTOS
X. Geng a, b,*, Q. Xu a, C.Z. Lana, S. Xing a
a Zhengzhou Institute of Surveying and Mapping, 450052 Zhengzhou, China – [email protected] bXi’an InformationTechnique Institute of Surveying and Mapping, 710054 Xi’an, China
Commission III, ICWG III/II
KEY WORDS: Mars Mapping, Pixel-level Image Matching, Approximate Orthophoto, Linear Array CCD, Back-projection
ABSTRACT:
Mars mapping is essential to the scientific research of the red planet. The special terrain characteristics of Martian surface can be used to develop the targeted image matching method. In this paper, in order to generate high resolution Mars DEM, a pixel-level image matching method for Mars orbital pushbroom images is proposed. The main strategies of our method include: (1) image matching on approximate orthophotos; (2) estimating approximate value of conjugate points by using ground point coordinates of orthophotos; (3) hierarchical image matching; (4) generating DEM and approximate orthophotos at each pyramid level; (5) fast transformation from ground points to image points for pushbroom images. The derived DEM at each pyramid level is used as reference data for the generation of approximate orthophotos at the next pyramid level. With iterative processing, the generated DEM becomes more and more accurate and a very small search window is precise enough for the determination of conjugate points. The images acquired by High Resolution Stereo Camera (HRSC) on European Mars Express were used to verify our method’s feasibility. Experiment results demonstrate that accurate DEM data can be derived with an acceptable time cost by pixel-level image matching.
1. INTRODUCTION
Currently, Mars exploration is the hot spot of deep space exploration. Both scientific research and practical engineering applications such as landing sites selection and rover navigation requires high resolution topographic data (Di, 2008). The Digital Elevation Model (DEM) can be derived through the photogrammetric processing of orbital images. Several data sources can be used to generate Mars topographic data, including Visual Imaging System (VIS) on each of the two Viking orbiters (Rosiek, 2005), Mars Orbiter Camera (MOC) on Mars Global Surveyor (Shan, 2005), High Resolution Stereo Camera (HRSC) on Mars Express (Albertz, 2005), and High Resolution Imaging Science Experiment (HiRISE) on Mars Reconnaissance Orbiter (Kirk, 2008).
Mars global DEM is essential data for planetary science. The Mars Orbiter Laser Altimeter (MOLA) DEM is widely used due to its global coverage and high absolute accuracy. However, the grid spacing of MOLA DEM is about 500m at the equatorial regions, which cannot meet many practical application requirements. When compared to other orbital images, HRSC exhibits advantages in image resolution and multi-stereo capabilities. There are nine CCD line detectors mounted in parallel in the focal plane of HRSC camera, which can obtain five panchromatic stereo images and four colour images simultaneously (Albertz, 2005). The HRSC has been imaging the Martian surface since January 2000, and is still on operational up to now. After more than ten years on-orbit operation, the HRSC images have almost covered the entire Martian surface. The HRSC team and interested researchers have been investigated the generation of DEM from HRSC images (Hirschmüller, 2006; Heipke, 2007; Gwinner, 2009; Sidiropoulos, 2016). The early released standard HRSC Level-4 data are single orbit products.
* Corresponding author.
Recently, new global mapping program using the complete HRSC mission data was performed by the HRSC team, and multi-orbit DEM products were derived (Sidiropoulos, 2016). The HRSC team adopted the MC-30 global mapping scheme and subdivided Mars into 30 quadrangles. Currently, the first HRSC MC-30 half-tile was completed, and the grid spacing of DEM and DOM are 50m and 12.5m respectively. However, considering that the maximum resolution of HRSC images is up to 10m, it is expected that higher resolution Mars global DEM can be generated through pixel-level image matching.
Moreover, it is very meaningful to develop targeted image matching algorithm according to the terrain characteristics of Martian surface (Wu, 2016). In this paper, we propose a pixel-level image matching method to generate high resolution Mars DEM. In section 2, the disadvantages and advantages for Martian surface image matching are discussed. The basic principle and detailed method are described in section 3. The experiment results are presented in section 4. The conclusion is drawn in section 5.
2. MARTIAN SURFACE IMAGE MATCHING CHARACTERISTICS
2.1 Disadvantages
Due to the special terrain characteristics, traditional matching method may fail or deliver poor results for Martian surface image matching. The main disadvantages of Martian surface image matching are summarized as follows.
2. Insufficient feature points. Feature-based matching methods such as Scale-Invariant Feature Transform (SIFT) are more robust than area-based matching methods. Unfortunately, there are insufficient feature points on Martian surface. On the other hand, though a small amount of feature points can be extracted and used as tie points for bundle adjustment, the point density is not enough for surface reconstruction.
3. Poor image quality. Many factors such as imaging instrument, atmospheric environment and illumination conditions have influences on the image quality. In terms of image quality, Martian surface images perform worse than earth observation images.
4. Repetitive pattern. Repetitive pattern is very common on Martian surface. It will result in wrong matched points especially when area-based matching method is used. To address this issue, some constraint conditions such as epipolar line geometry need to be introduced. Meanwhile, precise approximate value of conjugate points is required.
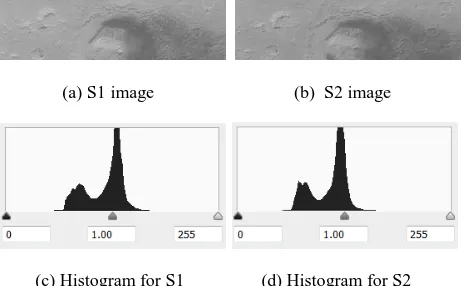
(a) S1 image (b) S2 image
(c) Histogram for S1 (d) Histogram for S2
Figure 1. The histogram of HRSC Level-2 images.
2.2 Advantages
On the other hand, when compared to earth observation images, Mars surface images show some advantages for image matching. Obviously, there are no trees or rivers on Martian surface. Moving objects such as cars are impossible to appear on Martian surface as well. Additionally, occlusion caused by high building and tall trees on earth observation images can be avoided on Martian surface images. In a word, in terms of terrain continuity, Martian surface images perform better than earth observation images. Thus, our image matching method will make full use of this characteristic.
3. PIXEL-LEVEL IMAGE MATCHING METHOD FOR MARS MAPPING
3.1 Basic Principle
A large number of image matching methods have been proposed in the literature. Some practical matching strategies such as hierarchical image matching can be used to perform Martian surface image matching as well. In the recent years, the Semi-Global Matching (SGM) method proposed by Hirschmüller (2008) won great success. SGM was also used to process Mars HRSC images (Hirschmüller, 2006). However, the pixel-level image matching performed with SGM still consumed a lot of processing time, usually several hours for a single orbit. In order to generate high resolution Mars DEM efficiently, targeted image matching method is still required.
Here, we point out that when image matching is performed for DEM generation, the interior orientation (IO) and exterior orientation (EO) data are usually accurately known. Thus, given a stereopair, two orthophotos can be generated through geometric rectification with reference DEM. If the reference DEM is accurate enough, the coordinate displacements of conjugate points at the overlapping area of the two orthophotos will be very small. This interesting and useful information can be used to estimate the approximate value of conjugate points.
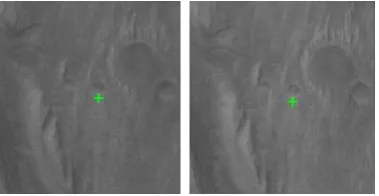
In order to introduce the basic principle of our method in detail, image matching on the third pyramid level of the HRSC Level-3 images was performed with SIFT. The results are presented in Figure 2. The HRSC Level-3 images are generated through geometric rectification with a rough DEM, which can be seen as approximate orthophotos. It is observed that most of the pixel coordinates displacements of conjugate points are less than two pixels in X and Y directions. The point 9 (green cross hair) shows the maximum displacements, and results in less than four pixels. It is noted that point 9 is located at the mountain area. This implies that inaccurate DEM will introduce large coordinate displacements at the overlapping area of two approximate orthophotos. Furthermore, it can be inferred that when image matching is performed at the fourth pyramid level, the pixel coordinates displacements of conjugate points will be less than two pixels. Therefore, at the fourth pyramid level, using the identical pixel coordinates on the left image as approximate value, the conjugate point on the right image can be determined with 5×5 search window.
(a) SIFT matching results
(b) Pixel coordinates displacements of conjugate points
Figure 2. Image matching results on the third pyramid level of HRSC Level-3 images using SIFT method.
3.2 Data Processing Chain
correlation coefficient (NCC) on approximate orthophotos; (2) estimating approximate value of conjugate points by using ground point coordinates of orthophotos; (3) hierarchical image matching and DEM generation at each pyramid level; (4) the DEM generated at current pyramid level is used as reference data for the orthophoto generation at the next pyramid level; and (5) fast coordinates transformation from 3D ground points to 2D image points.
Due to that the HRSC images are suitable for the generation of Mars global DEM, the pixel-level image matching method is designed for the HRSC images in this paper. Indeed, the method can be used to process other orbital images such as MOC and HiRISE. The procedure of pixel-level image matching method for Mars mapping is illustrated in Figure 3.
Pre-processing and bundle adjustment pyramid level i using DEM generated at
upper pyramid level
Pixel-level image matching on orthophotos at pyramid level i
Back-projection conjugate points from orthophotos to original images
3D ground points generation by forward intersection
Error elimination
Error elimination
Generate DEM at pyramid level i
Is highest pyramid
Extract IO, EO, and construct rigorous geometric model for pushbroom images
Figure 3. The pixel-level image matching and DEM generation procedure.
The detailed processing steps are as follows.
1.The Integrated System for Imagers and Spectrometers (ISIS) developed by USGS is used to perform data pre-processing. The HRSC stereo images with raw PDS format are imported into ISIS using ‘hrsc2isis’, and the kernels related to the images are determined with ‘spiceinit’.
2. Data pre-processing such as contrast enhancement and image pyramids generation is performed. The optional bundle adjustment process is carried out with ‘jigsaw’.
3. The interior orientation (IO) data such as pixel size, focal length and initial exterior orientation (EO) data are extracted from SPICE kernels. The scan line exposure time information is acquired with ‘tabledump’. Consequently, the rigorous geometric model for HRSC pushbroom images is constructed.
4. The DEM is generated or refined in an iterative processing way. At the lowest pyramid level, the approximate orthophotos are generated using MOLA DEM. The ground points coordinates are used as approximate value of conjugate points. The conjugate points matched on orthophotos are back-projected to original images. Then, through forward intersection, 3D ground points are generated. The forward intersection residuals are used to eliminate wrong matched points. The DEM generated at current pyramid level is used as reference data to generate approximate orthophotos at the next pyramid level. In order to match more points with pixel-level image matching method, a small NCC threshold is used.
5. Through hierarchical image matching, the generated DEM becomes more and more accurate. At last, the grid spacing of the final DEM product can achieve pixel-level.
3.3 Image Matching Strategies
3.3.1 Image Matching on Approximate Orthophotos: As illustrated in the top plot of Figure 4, due to the different viewing angles and image scale, it is difficult to perform image matching on the original HRSC Level-2 images. Using IO, EO and rough DEM, approximate orthophotos can be generated. Here, ‘approximate’ means that the DEM used for geometric rectification is not accurate enough. As shown in the bottom plot of Figure 4, the image distortions are removed through geometric rectification. Moreover, stereo images are resampled with identical Ground Sample Distance (GSD). Therefore, matching on approximate orthophotos is helpful to improve the success rate and accuracy. Furthermore, there is no need to extract feature points due to that at each pyramid level, image matching is performed with pixel-level.
(c) Level-3 S1 image (d) Level-3 S2 image
Figure 4. Comparison between HRSC Level-2 images and Level-3 images.
3.3.2 Estimating Approximate Value of Conjugate Points: The traditional image matching methods use constraint conditions such as epipolar line or affine transformation to estimate or predict the approximate value of conjugate points. Using our matching strategies, there is no need to estimate the approximate value of conjugate points by complicated technique. As presented in section 3.1, the ground points coordinates of orthophotos can be used to estimate the approximate value of conjugate points. Due to that the image matching is performed on orthophotos, approximate value of conjugate points is determined with an accuracy of several pixels, depending on the resolution and accuracy of reference DEM used in the geometric rectification process.
Given an image point on the left image, the pixel coordinates of point are , and the 2D ground point coordinates of point
are , . Thus, , can be calculated with equation 1.
= + ×
= + ×
(1)
where , are the left bottom corner point coordinates of the orthophoto, and are the pixel resolution in and directions respectively. The pixel coordinates ′, ′ of the conjugate point i' on the right image can be estimated with equation 2.
′ = − /
′ = − /
(2)
Obviously, the point estimation accuracy is influenced by the reference DEM and EO used in the geometric rectification process, assuming that the IO is accurate enough.
3.3.3 Hierarchical Matching: Hierarchical matching is widely used in most of the image matching algorithms. Similarly, our method adopts this practical matching strategy as well. At each image pyramid level, after the pixel-level image matching is completed, the DEM is generated and used as reference data for the geometric rectification at the next pyramid level.
Suppose the original image resolution of HRSC Level-2 images is 25m and image pyramids are generated with four levels. Thus, the image resolution for 1~4 pyramid levels is 50m, 100m, 200m and 400m respectively. At the highest pyramid level, pixel-level image matching can generate DEM with grid spacing of 400m, which is still higher than that of MOLA DEM. The DEM derived at the fourth pyramid level is used as reference data to generate orthophotos at the third pyramid level. Consequently, through hierarchical image matching, the generated DEM are refined iteratively, and the point prediction accuracy of conjugate points will be more accurate.
3.4 Back-projection Conjugate Points: Figure 5 illustrates the matching results on orthophotos and original images. The coordinates transformation from orthophoto to original image is indeed a back-projection process. Given an image point � on orthophoto, the corresponding 3D ground point coordinates are calculated with the DEM used in the geometric rectification process. Through back-projection, the conjugate point �′ on the original image is determined.
(a) conjugate points on orthophotos.
(b) conjugate points on original Level-2 images.
Figure 5. back-projection conjugate points from orthophotos to original images.
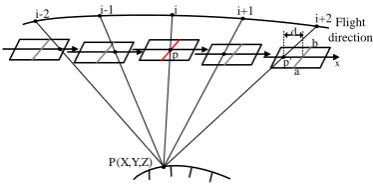
As shown in Figure 6, in order to perform back-projection for pushbroom images, the best scan line for ground point � must be determined. This requires that the rigorous geometric model for pushbroom images is constructed. Due to the special imaging principle of pushbroom images, each scan line has six exterior orientation elements. The rigorous geometric model is constructed with the extended collinear equation for pushbroom images, and the detailed expressions are given in equation 3.
= −� ( − �) + ( − �) + − � ( − �) + ( − �) + − � = −� ( − �) + ( − �) + − � ( − �) + ( − �) + − �
(3)
P(X,Y,Z)
Figure 6. Best scan line searching for pushbroom image.
3.5 DEM Generation
3.5.1 Forward Intersection for Pushbroom Images: Using the matched points on original stereo images, 3D ground points are generated through forward intersection. When compared to the frame images, forward intersection for pushbroom images is more complicated. The detailed processing procedures of forward intersection are illustrated in Figure 7. Assuming that � and � are a pair of conjugate points, ( , ) and ( , ) are pixel coordinates for � and �, ( , ) and ( , ) are focal plane coordinates, ( , , −� ) and ( , , −� ) are image space coordinates respectively, and ( , , ) are the 3D ground point coordinates. Firstly, the pixel coordinates are converted to focal plane coordinates by using the transformation equation obtained from the SPICE kernels. Secondly, the exact exterior orientation elements EO1 and EO2 for sane line and are interpolated by using the EO data. Then, the focal plane coordinates are converted to image space coordinates. At last , the ground point ( , , ) is calculated with extended collinear equation. It is noteworthy that the ground points are defined in body-fixed Martian Cartesian coordinates. In order to generate DEM, map projection and DEM interpolation are required.
(i1, j1) (x1, y1)
Figure 7. The processing procedure of forward intersection for pushbroom images
3.5.2 Wrong Matched Points Elimination
It is no doubt that wrong matched points cannot be avoided. Therefore, it is necessary to detect and eliminate the outliers. Here, we use the residuals of forward intersection to eliminate the wrong matched points. Given a pair of conjugate points on stereo images, in the forward intersection process there are three unknowns and four observation equations. Consequently, the residuals of ground point coordinates can be calculated. Assuming that the IO and EO are accurate enough, the residuals are determined by the image matching accuracy. As shown in
Figure 8. Using forward intersection residuals to eliminate wrong matched points
4. EXPERIMENT RESULTS
The software development for image matching and geometric rectification was carried out using Visual Studio 2013 and Qt 5.4.2 on Windows 7 platform. The rigorous geometric model and forward intersection for pushbroom images are implemented based on the open source photogrammetric software DGAP (Stallman, 2008). The tests were performed on a laptop with Intel Core i5 CPU and 8 GB RAM capacity.
4.1 Test Datasets
Two orbits HRSC Level-2 images are used to test our method. SPICE kernels and images are ingested into ISIS firstly. Then, image pyramids are generated with four levels by using bi-cubic interpolation. The Level-2 images are orthorectified using equirectangular projection. The Martian reference datum is defined using a sphere body with axis of 3396.19 km. The test datasets information is listed in table 1. The image width of orbit 5273 and orbit 5124 are 5176 and 2584 respectively, and each of two orbits has more than 16000 scanlines. The orbit 5273 images are located at Gale crater, which covers the landing area of Curiosity. The search window size is 3×5 and the match window size is 9×9. Stereo matching is performed between S1 and S2 images. The processing time of the image matching process are measured. It is noteworthy that the forward intersection and DEM interpolation with large-scale point clouds requires a lot of Table 1. Information of test datasets.
4.2 Experiment Results
value of conjugate points, which is helpful to improve the image matching efficiency and accuracy.
Figure 9. Point prediction accuracy
4.2.1 Image Matching Results: The top plot of Figure 10 shows the image matching results on approximate orthophotos. The matched points on approximate orthophotos are back-projected to original HRSC Level-2 images, and the results are shown in the bottom plot of Figure 10. It is noteworthy that due to low contrast of Martian surface imagery, the success rate of image matching cannot achieve 100% and pointless regions are observed.
(a) matched points on approximate orthophotos
(b) matched points on original Level-2 images
Figure 10. Image matching results on the third pyramid level (zoom in 4 times).
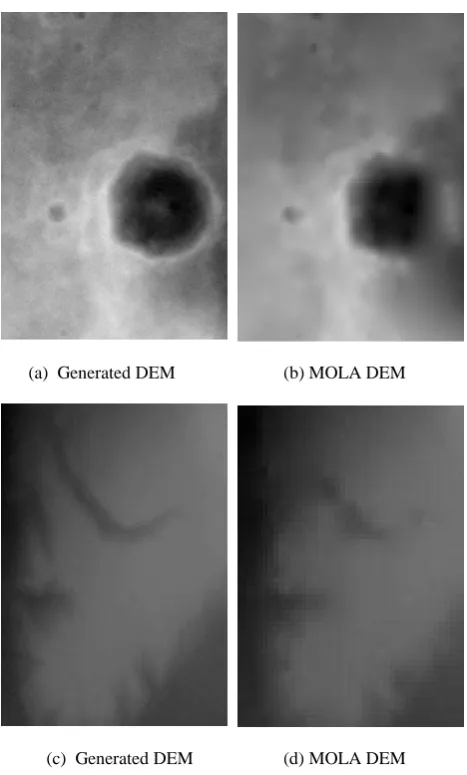
4.2.2 DEM Results: Figure 11 and 12 illustrate the generated DEM. The visual comparison of generated DEM and MOLA DEM is presented in Figure 13. When compared to the MOLA DEM, it is observed that our method provides more detailed information, which show the advantages of pixel-level image matching.
(a) orthophoto (b) DEM
Figure 11. Mars Express orbit 5273 resampled with 25m/pixel
(a) orthophoto (b) DEM
(a) Generated DEM (b) MOLA DEM
(c) Generated DEM (d) MOLA DEM
Figure 13. Visual comparison of generated DEM and MOLA DEM. (Height = intensity)
4.2.3 DEM Accuracy Verification: The height accuracy of generated DEM is compared to the HRSC Level-4 DEM product, and the results are shown in Figure 14. It is observed that the root mean square errors (RMSE) of height displacements are 60.3m for orbit 5273 and 33.7m for orbit 5124 respectively. It is obvious that the results show systematic errors. This may be caused by the inaccurate SPICE kernels. Indeed, the systematic errors can be easily eliminated by using several GCPs collected from HRSC Level-4 DOM and DEM. Therefore, the experiment results demonstrate that the DEM generated with our method show good consistency with the HRSC Level-4 product.
(a) orbit 5273
(b) orbit 5124
Figure 14. Height accuracy comparison between the generated DEM and the HRSC Level-4 DEM.
4.3 Discussions
Our image matching method has the advantage that the a priori knowledge at each pyramid level is utilized to the most extent. In addition, the matching strategies take account of the terrain continuity characteristic, and are especially suitable for Martian surface image matching. However, the generated DEM exhibits some deficiencies. At low contrast area, area-based matching may fail and results in pointless region.
5. CONCLUSION
The objective of this paper is to generate higher resolution Mars DEM through stereo photogrammetry. A targeted pixel-level image matching method for Mars mapping is proposed. The experiment was carried out using only S1 and S2 images. Indeed, more stereo viewing angles images such as nadir, P1 and P2 can be introduced to improve geometric accuracy. Obviously, more images require more data processing time. In order to make our algorithm more practical, the method shall be optimized with parallel processing abilities in the future. Additionally, it is necessary to introduce other image matching strategies into our method to address the topography discontinuity issue at low contrast area.
ACKNOWLEDGEMENTS
This work was funded by the National Basic Research Program of China (973 Program) (2012CB720000) and National Natural Science Foundation Project of China (41401533). We also thank HRSC team for their valuable work in photogrammetric processing and providing the HRSC products to the public.
REFERENCES
Albertz, J., Attwenger, M., Barrett, J., et al., 2005. HRSC on Mars Express–photogrammetric and cartographic research. Photogrammetric Engineering and Remote Sensing, 71(10), pp. 1153-1166.
Di, K.C., Xu, F., Wang, J., et al., 2008. Photogrammetric processing of rover imagery of the 2003 Mars Exploration Rover mission. ISPRS Journal of Photogrammetry and Remote Sensing, 63(2), pp.181-201.
Geng, X., Xu, Q., Xing, S., et. al, 2013. Differential rectification of linear pushbroom imagery based on the fast algorithm for best scan line searching, Acta Geodaetica et Cartographica Sinica, 42(6), pp.861-868.
express HRSC data. Photogrammetric Engineering and Remote Sensing, 75(9), pp.1127-1142.
Heipke, C., Oberst, J., Albertz, J., et al., 2007. Evaluating planetary digital terrain models—The HRSC DTM test. Planetary and Space Science, 55(14), pp.2173-2191.
Hirschmüller, H., Mayer, H., Neukum, G., 2006. Stereo processing of HRSC Mars Express Images by Semi-Global Matching. In: The International Archives of the Photogrammetry, Remote Sensing and Spatial Information Sciences, Goa, India, Vol. XXXVI, Part B4.
Hirschmüller, H., 2008. Stereo Processing by Semi-global Matching and Mutual Information. IEEE Transactions on Pattern Analysis and Machine Intelligence, 30(2), pp.328–341.
Kirk, R.L., Kraus, E.H., Rosiek, R.M., et al., 2008. Ultrahigh resolution topographic mapping of Mars with MRO HiRISE stereo images: meter‐scale slopes of candidate Phoenix landing sites. Journal of Geophysical Research Atmospheres,113(3), pp.5578-5579.
Rosiek, M.R., Kirk, R.L., Archinal B. A, et al., 2005. Utility of Viking Orbiter images and products for Mars mapping. Photogrammetric Engineering and Remote Sensing, 71(10), pp.1187-1195.
Shan, J., Yoon, J., Lee, D.S., et al., 2005. Photogrammetric analysis of the Mars Global Surveyor mapping data. Photogrammetric Engineering and Remote Sensing, 71(1), pp.97-108.
Sidiropoulos, P., Muller, J., 2016. Batch co-registration of Mars high-resolution images to HRSC MC11-E mosaic. In: The International Archives of the Photogrammetry, Remote Sensing and Spatial Information Sciences, Prague, Czech, Vol. XLI, Part B4, pp. 491-495.
Stallman, D., 2008. DGAP notes, Stuttgart, Germany. http://www.ifp.uni-tuttgart.de/publications/software/openbundle /index.en.html (accessed 23 June, 2017).
Wang, M., Hu, F., Li, J., Pan, J., 2009. A fast approach to best scanline search of airborne linear pushbroom images. Photogrammetric Engineering and Remote Sensing, 75(9), pp.1059-1067.