MONITORING OF RAPID LAND COVER CHANGES IN EASTERN JAPAN
USING TERRA/MODIS DATA
I. Harada a, *, K. Hara a, J. Park a, I. Asanuma a, M. Tomita a, D. Hasegawa a, K. Short a, M. Fujihara b
a
Department of Informatics, Tokyo University of Information Sciences, 4-1 Onaridai Wakaba-ku, Chiba, 265-8501 Japan – *[email protected]
b
Graduate School of Landscape Design and Management, University of Hyogo/Awaji Landscape Planning and Horticulture Academy, 954-2 Nojimatokiwa, Awaji, Hyogo Prefecture, 656-1726 Japan – [email protected]
Commission VIII, WG VIII/8
KEY WORDS: Vegetation Map, National Survey of the Natural Environment, Landscape Changes, Terra/MODIS, Landsat, LTS, the Great Eastern Japan Earthquake
ABSTRACT:
Vegetation and land cover in Japan are rapidly changing. Abandoned farmland in 2010, for example, was 396,000 ha, or triple that of 1985. Efficient monitoring of changes in land cover is vital to both conservation of biodiversity and sustainable regional development. The Ministry of Environment is currently producing 1/25,000 scale vegetation maps for all of Japan, but the work is not yet completed. Traditional research is time consuming, and has difficulty coping with the rapid nature of change in the modern world. In this situation, classification of various scale remotely sensed data can be of premier use for efficient and timely monitoring of changes in vegetation.. In this research Terra/MODIS data is utilized to classify land cover in all of eastern Japan. Emphasis is placed on the Tohoku area, where large scale and rapid changes in vegetation have occurred in the aftermath of the Great Eastern Japan Earthquake of 11 March 2011. Large sections of coastal forest and agricultural lands, for example, were directly damaged by the earthquake or inundated by subsequent tsunami. Agricultural land was also abandoned due to radioactive contamination from the Fukushima nuclear power plant accident. The classification results are interpreted within the framework of a Landscape Transformation Sere model developed by Hara et al (2010), which presents a multi-staged pattern for tracking vegetation changes under successively heavy levels of human interference. The results of the research will be useful for balancing conservation of biodiversity and ecosystems with the needs for regional redevelopment.
* Corresponding author. This is useful to know for communication with the appropriate person in cases with more than one author.
1. INTRODUCTION
Vegetation and land cover in Japan are rapidly changing. Over the past half century, for example, coppices and other managed secondary woodlands, which had formerly provided various vital ecosystem services, were abandoned when fossil fuels replaced firewood and charcoal as the main source of energy. These abandoned secondary woodlands revert to the natural forest cycle, and are now slowly moving back to their original climax stage. Urbanization, as well as depopulation in rural areas, also produce wide spread shifts in land cover. Natural disasters can result in dramatic changes. The Great East Japan Earthquake of March, 2011 and the subsequent tsunami, for example, caused massive abandonment of farmland and damage to various vegetation communities, especially in the heavily-damaged Tohoku Region.
In this environment, accurate, comprehensive and up-to-date data on changes in land cover and vegetation are required for proper planning and management of land and resources. In Japan, basic national level data for ecosystem and biodiversity conservation were first produced by the Ministry of Environment (MOE) National Survey of the Natural Environment project, which lasted from 1973 to 1998. These 1/50,000 scale maps provided a crucial understanding of Japan’s vegetation patterns, and for several decades were the
standard reference work for ecological studies and environmental impact assessments.
This first series of national level vegetation maps, however, gradually became out-dated, and in 1999 MOE began a new project to update them with 1/25,000 scale maps. Unfortunately, this work has proved costly and time-consuming, and as of March 2013 only 68% of the national land area had been completed. As can be seen in Figure 1, the new maps as they stand are still insufficient for following rapid vegetation changes, especially in mountainous areas. Furthermore, accurate, detailed continuously updated land cover data is now required for assessing this damage caused by the 2011 earthquake and tsunami, and also for designing reconstruction strategies that balance social and economic recovery with conservation of biodiversity and ecosystems.
Remote sensing research shows a great potential to respond to this need for timely land cover data. Remote sensing enjoys relatively low financial and labor costs; and can be implemented safely and effectively even on steep mountainsides and in disaster areas where access is limited. In addition, the research can be conducted over a wide region on an immediate or periodic basis.
(1994) and Loveland et al. (2000), for example, employed this remote sensing data to map global vegetation. In 1999, NOAA launched the Terra/MODIS satellite, which was designed as the successor to NOAA AVHRR. MODIS, covers a 2330 km wide swath, and passes over the same spot twice daily. Improved functions include spatial and spectral resolution, orbital data, and on-board luminance correction Justice et al. 1998 .
MODIS researches focusing on vegetation patterns in East Asia, however, have been few. To quantify general trends in land cover change over the past century, Harada et al (2011, 2014) combined MODIS data with digitalized versions of historic maps and maps of potential vegetation as predicted by Warmth Index. The ultimate goal of this continuing research is to take advantage of the wide scale and regularity of MODIS data to develop a system for timely monitoring of land cover for all of Japan. This system can supplement the MOE vegetation
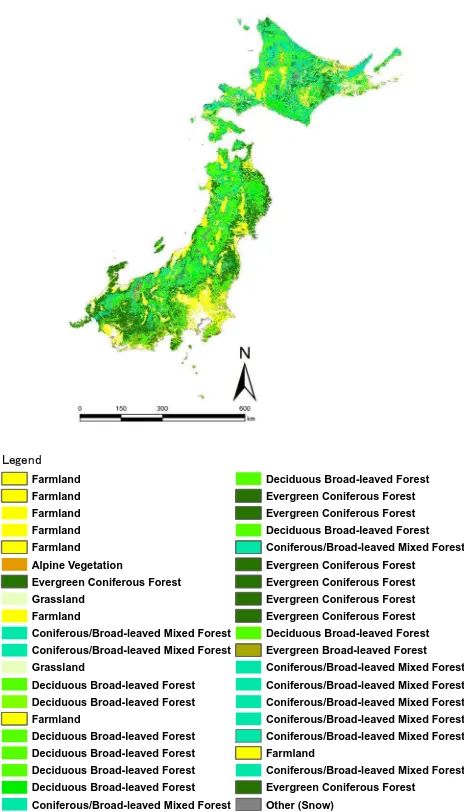
Figure 1. Area of Japan currently covered by National Survey of the Natural Environment 1/25,000 scale vegetation maps
(green) (http://www.vegetation.biodic.go.jp)
2. DATA AND MONTHLY COMPOSITE IMAGES
At Tokyo University of Information Sciences (TUIS), MODIS data from the Terra and Aqua satellites has been directly acquired since November of 2000, and VIIRS data from the Suomi-NPP satellite since May of 2001. 500m resolution atmospherically-corrected MODIS data sets have been archived since 2001. Since these data sets cover the time periods both before and after the 2011 earthquake and tsunami, they can be utilized to analyse land cover changes caused by the disaster.
Multi-temporal composite Terra/MODIS data sets with the effects of cloud cover removed were constructed, and used to generate vegetation maps of the Tohoku Region before and after the disaster. Compositing generally results in loss of vegetative phonological information. In this research, however, a system proposed by Park et al (2009), which utilizes the resolution data sets, the data must be acquired at high frequency. NASA does provide atmospherically-corrected composite images with cloud cover removed, but to assemble these on a scale such as all Japan would be exceedingly difficult. TUIS, however, acquires MODIS data at three spots; Miyake Island in the southern Ryukyus, the main campus near Tokyo in central Honshu, and Abashiri along the Sea Of Okhotsk in eastern Hokkaido. This allows high frequency data acquisition over an area stretching from the Philippine Sea to the Okhotsk Sea. As a result, monthly composite data sets with the effects of cloud October and 155 from November, were used to construct multi-temporal monthly composite data sets with the effects of cloud cover removed. In order to eliminate distorted images, only data from a sensor zenith angle of 40 degrees or less were used. Monthly composite maps were generated for April to November 2013 (Figure 2). Data for July was less than for other months, so the results for this month were not included in the subsequent analyses. The composite data for the seven remaining months was then integrated into image data. Nine bands (Surface Reflectance Bands1-7+NDVI+RVI) for 7 months resulted in a total of 63 bands.
Apr. May June July
Aug. Sep. Oct. Nov.
Figure 2. Monthly Composite Images from Terra/MODIS data for 2013
3. LAND COVER CHANGES IN EASTERN JAPAN
Figure 3. Flowchart for constructing vegetation maps from Terra/MODIS data
Lgn
Farmland Farmland Farmland Farmland Farmland Alpine Vegetation Evergreen Coniferous Forest Grassland
Farmland
Coniferous/Broad-leaved Mixed Forest Coniferous/Broad-leaved Mixed Forest Grassland
Deciduous Broad-leaved Forest Deciduous Broad-leaved Forest Farmland
Deciduous Broad-leaved Forest Deciduous Broad-leaved Forest Deciduous Broad-leaved Forest Deciduous Broad-leaved Forest Coniferous/Broad-leaved Mixed Forest
Deciduous Broad-leaved Forest Evergreen Coniferous Forest Evergreen Coniferous Forest Deciduous Broad-leaved Forest Coniferous/Broad-leaved Mixed Forest Evergreen Coniferous Forest Evergreen Coniferous Forest Evergreen Coniferous Forest Evergreen Coniferous Forest Deciduous Broad-leaved Forest Evergreen Broad-leaved Forest Coniferous/Broad-leaved Mixed Forest Coniferous/Broad-leaved Mixed Forest Coniferous/Broad-leaved Mixed Forest Coniferous/Broad-leaved Mixed Forest Coniferous/Broad-leaved Mixed Forest Farmland
Coniferous/Broad-leaved Mixed Forest Evergreen Coniferous Forest Other (Snow)
Figure 4. 40 vegetated categories by ISODATA method classification of Terra/MODIS data
Figure 5. 10 non-vegetated categories by ISODATA method classification of Terra/MODIS data
Figure 6. Land Cover Map in eastern Japan based on Terra/MODIS data for 2013
A total of 50 initial classification categories were established using the ISODATA method (non-hierarchical cluster analyses). These included 40 vegetated categories and 10 non-vegetated categories. The distribution of the 40 vegetated categories are shown in Figure 4, and the 10 non-vegetated categories in Figure 5.
consolidated. As a result, the 50 initial vegetated categories were consolidated into the following categories: Alpine Vegetation; Evergreen Coniferous Forest; Deciduous Broad-leaved Forest; Evergreen Broad-leaved Forest; Coniferous/Broad-leaved Mixed Forest; Grassland; Farmland; Urban Area and Open Water.
The accuracy of the map was evaluated using ENV15.1 (Exelis VIS) image analyses software. References used included GIS data from the 1:25,000 scale MOE maps (incomplete), the 1:50,000 scale MOE maps (complete) and Landsat5-8 satellite data (USGS). To implement this MOE comparison the 9 classification categories adopted here were collated with the 58 categories employed on the MOE maps. The results of the classification are shown in Figure 6.
4. LAND COVER CHANGES IN THE DISASTER REGION cover classification for the Tohoku region implemented in 2001, before the disaster (Hara et al. 2010 and Harada et al., 2014).
The results of his comparison are indicated in Figure 7. As radioactive substances into the surrounding atmosphere. These substances were carried by the wind, and the area within a 30 km radius of the plant was designated as an Evacuation Zone, with about 30,000 residents being evacuated. Today entry to the zone remains closed or restricted.
In addition, analysis of the Evacuation Zone is being implemented using MODIS (500 m resolution), Landsat (30 m resolution) and GIS data. The purpose of this part of the research is to clarify the general land cover changes discussed above in greater detail, and also to develop a system for continual monitoring of this area.
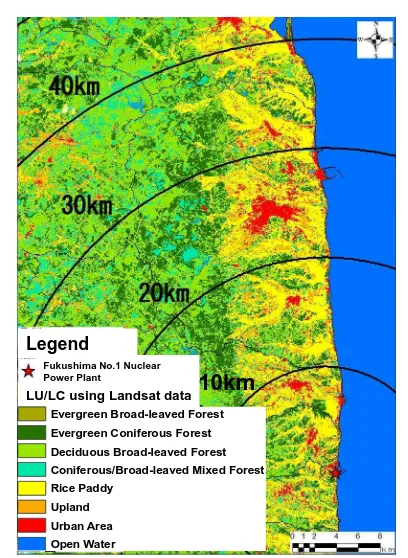
As a baseline, the land cover in the target area was analysed using USGS Landsat data (http://www.usgs.gov/) downloaded for 3 July 2000, 3 March 2002 and 9 May 2003. The ISODATA (non-hierarchical clustering) using ENVI5.1 was employed to classify the data into 50 initial categories, which were then consolidated using ArcGIS into 9 land cover categories. These categories are basically the same as those employed in the MODIS classifications, but Grassland has been eliminated, and Farmland has been divided into Upland Field (non-irrigated) and Rice Paddy (irrigated). The results of this classification are shown in Figure 8. The only vegetation reference data available for this area was the MOE 1:50,000 map.
In addition, Landsat-5 TM data for 2 June 2009 was downloaded from USGS (http://www.usgs.gov/). Figure 9 presents this image in natural color (RGB=band3, band5, band1). This image was then compared with the classification results shown in Figure 8. In both images large areas of rice paddy filled with water, dark red in Figure 9 and yellow in Figure 8, can be seen along the coastal plain.
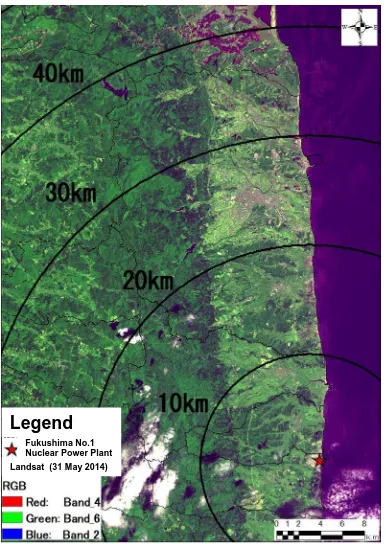
To further understand these changes in land cover caused by the disaster, a Landsat-8 OLI image for 31 May 2014 was downloaded from USGS. This image is shown in natural color (RGB=band4, band6, band2) in Figure 10. As can be clearly
seen, rice paddies along the coastal plain remain only at the top of the image, around 40 km from the power station. The paddies closer to the station are no longer filled with water, indicating that they have been abandoned.
Alpine Vegetation
Figure 7. Land cover change in eastern Japan based on Terra/MODIS data for 2001 and 2013
Legend
Legend
Fukushima No.1 Nuclear Power Plant Landsat (2 June 2009)
Figure 9.
Natural Color Image using Landsat-5 TM data (2 June 2009, RGB:3,5,1)
Legend
Fukushima No.1 Nuclear Power Plant Landsat (31 May 2014)
Figure 10. Natural Color Image using Landsat-8 OLI data (31 May 2014, RGB:4,6,2)
5. CONCLUSIONS
The amount of abandoned farmland in Japan remained steady until around 1985 (130,000 ha). After 1990, however, the pace of farmland abandonment increased rapidly, and by 2010 had
reached 396,000 hectares (Ministry of Agriculture, Forestry and Fisheries, 2011). The earthquake and tsunami of 2011 inundated rice paddies and dealt a powerful blow to agricultural production in the Tohoku Region. Four years later the industry is yet to recover. Restoration efforts are hampered by a loss of population and aging of the agricultural workforce, and also by negative consumer images generated by the nuclear fallout.
Abandoned farmland first reverts to weed-field, but the subsequent changes in vegetation vary according to factors such as climate, altitude and topography. Hara et al (2010) have compared actual land cover based on multi-temporal Terra/MODIS data to natural land cover as predicted by climate zone; and used the results to develop a Landscape Transformation Sere (LTS) model for predicting how vegetation and land cover change under increasing levels of human intervention. The basic pattern is presented in Figure 11; and involves change from primary forest to managed secondary woodland, then on to grassland, agricultural land and finally non-vegetated residential or industrial area. Abandoned farmland may be expected to change in the opposite direction.
Climax Forest (CF)
Secondary Forest (SF)
Grassland (GL)
Dry/Paddy Field (DPF)
Rural/Urban (RU)
Natural Human Intervention Artificial
Figure 11. Typical Landscape Transformation Sere (LTS) model (after Hara et al.,2009)
This research clearly demonstrates that wide-scale remote sensing data such as MODIS and Landsat are effective tools for supplementing the Ministry of Environment’s vegetation mapping, and also for evaluating and monitoring rapid changes in land cover such as those caused by large-scale infrequent disasters.
ACKNOWLEDGEMENTS
This research was supported in part by the MEXT Strategic Research Infrastructure Formation Project “Research project for sustainable development of economic and social structure dependent on the environment of the eastern coast of Asia (TUIS)”; by the Environment Research and Technology Development Fund (1-1405) of Ministry of Environment, Japan; and by a MEXT Japan grant-in-aid for scientific research (No. 26350403).
REFERENCES
Ehrlich, D., Estes, J., E. & Singh, A., 1994. Applications of NOAA-AVHRR 1 km data for environmental monitoring, International Journal of Remote Sensing, 15(1), pp. 145-161. Ministry of Agriculture, Forestry and Fisheries, 2010. Report
on Results of 2010 Census of Agriculture and Forestry in Japan.
Justice, C., et al., 1998. The Moderate Resolution Imaging Spectroradiometer (MODIS): land remote sensing for global change research. IEEE Trans. On Geosci. And Remote Sens., 36(4), 1228-1249.
Landscape ecology - methods, applications and interdisciplinary approach, 165-172.
Harada, I., Matsumura, T., Hara, K. and Kondoh, A., 2011. Spatial analysis of changes in Japanese forests during the process of modernization, Landscape Ecology and Management, 16(1), 17-32. (in Japanese with English abstract) Harada, I., Hara, K., Tomita, M., Short, K. and Park, J. 2014. Monitoring landscape changes in Japan using classification of MODIS data combined with a Landscape Transformation Sere (LTS) model, Journal of Landscape Ecology, 7(3), 23-38. Loveland, T. R., Reed, B. C., Brown, J. F., Ohlen, D. O., Zhu,
z,, Yang, L., and Merchant, J.W., 2000. Development of a global land cover characteristics database and IGBP DISCover from 1 km AVHRR data, International Journal of Remote Sensing, 21, 1303-1330.
Park, J., Yasuda, Y., Sekine, H., Tateishi, R. and Susaki, J.,2009. Estimation of the cloud cover ratio in a pixel using MODIS data , Journal of the Japan Society of Photogrammetry and Remote Sensing, 47(6), 30-37. (in Japanese with English abstract)