ASSESSING THE IMPACT OF URBANIZATION ON URBAN CLIMATE BY REMOTE
SENSING PERSPECTIVE: A CASE STUDY IN DANANG CITY, VIETNAM
Nguyen Hoang Khanh Linh a,*, Huynh Van Chuong a a
Faculty of Land Resources and Agricultural Environment, Hue University of Agriculture and Forestry, 102 Phung Hung, Hue City, Vietnam – (nguyenhoangkhanhlinh, huynhvanchuong)@huaf.edu.vn
Commission ATMC – Atmosphere, weather and climate
KEY WORDS: Danang, urban climate, urbanization, change detection,
ABSTRACT:
Urban climate, one of the challenges of human being in 21 century, is known as the results of land use/cover transformation. Its characteristics are distinguished by different varieties of climatic conditions in comparison with those of less built-up areas. The alterations lead to “Urban Heat Island”, in which temperature in urban places is higher than surrounding environment. This happens not only in mega cities but also in less urbanized sites. The results determine the change of land use/cover and land surface temperature in Danang city by using multi-temporal Landsat and ASTER data for the period of 1990-2009. Based on the supervised classification method of maximum likelihood algorithm, satellite images in 1990, 2003, 2009 were classified into five classes: water, forest, shrub, agriculture, barren land and built-up area. For accuracy assessment, the error metric tabulations of mapped classes and reference classes were made. The Kappa statistics, derived from error matrices, were over 80% for all of land use maps. An comparison change detection algorithm was made in three intervals, 1990-2003, 2003-2009 and 1990-2009. The results showed that built-up area increased from 8.95% to 17.87% between 1990 and 2009, while agriculture, shrub and barren decreased from 12.98% to 7.53%, 15.72% to 9.89% and 3.88% to 1.77% due to urbanization that resulted from increasing of urban population and economic development, respectively. Land surface temperature (LST) maps were retrieved from thermal infrared bands of Landsat and ASTER data. The result indicated that the temperature in study area increased from 39oC to 41oC for the period of 1990-2009. Our analysis showed that built-up area had the highest LST values, whereas water bodies had the least LST. This study is expected to be useful for decision makers to make an appropriate land use planning which can mitigate the effect to urban climate.
1. INTRODUCTION
Urbanization is believed one of the most prevalent anthropogenic causes of the losing arable land, devastating habitats, and the decline in natural vegetation cover (Dewan and Yamaguchi, 2009). As a consequence, rural areas have been converted into urban areas with an unprecedented rate and making a noted effect on the natural functioning of ecosystems (Turner, 1994). Consequently, a profound understanding of land use change is very important to have a proper land use planning and sustainable development policies (Braimoh and Onishi, 2007).
According to Myint and Wang (2006), to fulfil such a sustainable urban development, urban and regional planners have to summarise from numerous decisions. However, these decisions must be extracted from huge data sources, which represent physical, biological and social parameters of urban areas in the continued spectrum of spatial and temporal domains. Hence, it is important to have an effective spatial dynamic tool, which is used to understand urban land-use and land-cover change (LULC) for predicting future change. Compared with various methods used to collect land use data, remote satellite technologies has proven its capacity in providing accurate and timely information on the geographic distribution of land use, especially for regional size areas (Sun et al., 2009). With the support of Geographical Information Systems (GIS), satellite images can effectively estimate and analyse changes and LULC trends (Hathout, 2002).
Recently, various studies on urban heat island (UHI) have been based on remote satellite images instead of air temperature obtained from weather stations (Li et al., 2009). It shows that data got from these in situ data can only give accurate local
meteorological data, which are normally distributed as discrete points and hardly displayed as spatial variation (Owen et al., 1998).To determine the increase of thermal environment in urban, the land surface temperature (LST) of study area is calculated from available infrared information of satellite images (X.,Zhou, Y.-C. Wang., 2011). Voogt and Oke (1998) and Weng (2009) indicated that LST parameter is able to modulate the air temperature above the earth surface and close related to surface radiation and energy exchange. In addition, previous authors gave the evidences that rapid urban sprawl and population growth in metropolitan change physical properties of urban land surface, in which, temperature in urban areas are a few degrees higher than in surrounding non-urbanized areas (Xian and Crane, 2005). In fact, UHI distributes not only in mega cities but also in medium and small cities. Therefore, this research had been investigated to illustrate the significant relationship between land use/cover (LULC) type and surface temperature even though in small scale.
.
2. STUDY AREA
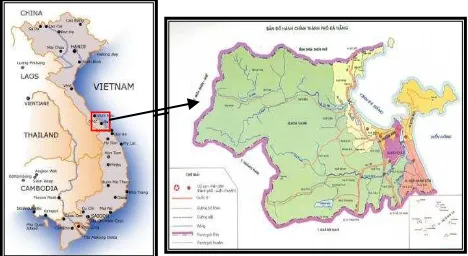
Figure 1. General location of Danang city, Vietnam wet (August-December) and the dry (January-July). In 2009, the total population is about 887,070 and the population density is 906.7 persons per km2. Danang city is known as one of the most densely populated and urbanized area in Vietnam. With the economy development and population increasing, the local LULC in Danang city has changed seriously.
3. DATA AND METHOD
3.1 Data sources and Image preprocessing
Landsat imagery were used for this study. The following criteria were considered for choosing proper data: (1) the images should be long time enough for detecting the land use change; (2) study area should not have cloud cover. Unfortunately, the study area is located near coastal. Due to the influence of weather, there are not many data satisfied both conditions. The images always have some thick cloud cover or haze. In addition, the study area is not entirely contained within one scene of Landsat Therefore, having acquisition images near anniversary dates for changing detection as Jensen mentioned (2005) was unavailable. In this study, three periods of satellite images were selected to classify study area: Landsat-5 TM August 24, 1990; Landsat-7 ETM+ March 04 and April 14, 2003; Landsat-5 TM Jun 2009 (download free at http://earthexplorer.usgs.gov/ and http://glovis.usgs.gov/ ); and ASTER image (April 02, 2009) was purchased from Japan Space Systems/Earth Remote Sensing Division (ERSDAC) was used as reference image. The details of data were described in Table 1. For this study, the reference data were also used, included: (1) topographic map 2001, at scale of 1/50.000; (2) land use maps in 1997, 2003 and 2010, at scale of 1/25.000.
Because Landsat and ASTER imagery were collected at level 1T and 1B respectively, geometric correction do not require. However, images were acquired at different spatial resolution and projections. Therefore, all images were first rectified to Universal Transverse Mercator (UTM) coordinate system, Datum WGS 84, Zone 48 North for matching the geographic projection of the reference data. Images were also co-registered together within 25 well distributed GCPs (ground control points) and polynomial 1sd by means of OrthoEngine provided by PCI Geomatica 10.3 software. RMS <0.5 was received. In addition, Nearest Neighbour resampling was set for not changing heavily the radiometric characteristic of image. In this study, the iteratively re-weighted multivariate alteration detection (IR-MAD) transformation was used for automatic
radiometric normalization for all images by means of ENVI 4.8 software; see (Canty, 2010, A. A. Nielsen et al., 1998, Canty and Nielsen, 2008). ASTER 02/04/2009 was chosen as reference image. However, this image does not cover all the region of study area, therefore a subset of 1800x1100 pixels with 30m spatial resolution including 968.17km2 was created for all images for further studying. This territory was chosen to ensure the specific study area was in the analysis image. Besides the requirement of the same dimension, images must have the same spectral resolution. Hence, the composite of standard false colours was used for this study: Landsat TM/ETM+ (432). 3.2 LULC classification and Change detection
Six land use/cover classes were defined for image classification based on the modified Anderson land use/cover scheme level I (Anderson et al., 1976), included: (1) water, (2) forest, (3) shrub, (4) agriculture, (5) barren and (6) urban land. Supervised classification using maximum likelihood approach in ENVI 4.8 was individually applied for each image of study area to classify land use/cover. Maximum likelihood algorithm was preferred because this rule is considered to have accurate results because it has more accurate results than other algorithms (Mengistu D. A. and Salami A. T., 2007, Reis, 2008, Diallo Y. et al., 2009). Because of various image acquisition dates, training areas for the images of the years 1990, 2003 and 2009 were different during the classification. In addition, the training areas were verified by references data. As the next step, post-classification comparison change detection algorithm was selected to detect changes in LULC from 1990 to 2009 in study area. In order to minimize the problem in radiometric calibration of imagery of two different dates. For comparison of the classification results of two dates, a change detection matrix was created based on imagery was derived as following two steps: firstly, the satellite-based digital number is converted to at-sensor spectral radiance (L ) by using Eq (1) (Landsat Project Science Office, 2002):
(1) Where DN is the digital number of thermal band, and the corresponding spectral radiance. The gain (GAINS) offset (BIASES) values can be obtained from the image header file. The second step is to convert spectral radiance values from thermal band to brightness temperature using the formula (2) (Schott and Volchok, 1985; Wukelic et al., 1989):
The temperature calculated in Eq (2) is not the actual LST, but the at-satellite temperature. In this study, single-channel method by Jiménez-Muñoz, Juan C. Sobrino, José A (2003) and Sobrino et al., (2004):
γ =
(4)
(5)
Where L is sensor radiance, Tk is brightness temperature, is the effective wavelength (11.457 m for Landsat TM6 band), c1 = 1.19104 x 10⁸Wm-2sr-1 m4, c2 = 14387.7 m K. 1, 2, and 3 can be calculated as a function of the total atmospheric water vapour content ( )
1 = 0.1471 2 – 0.15583 + 1.1234
(5a) 2 = - 1.1836
2–
0.37607 – 0.52894 (5b)
3 = - 0.0455 2 + 1.8719 – 0.39071 (5c)
3.4. Normalized Difference Vegetation Index
The Normalized Difference Vegetation index (NDVI) is a simple graphical indicator to measure the live green vegetation from remote satellite imagery. It can be calculated from these individual measurements as follows:
(6)
Where VIS and NIR stand for the spectral reflectance measurement acquired in the visible (red) and near-infrared regions, respectively. NDVI values range from -1 to 1;
Type of sensor Spatial resolution
(m)
Band Date Path Row Average cloud coverage (%)
Landsat-5 TM 30 1-5, 7 August 24, 1990 124 49 0
Landsat-7 ETM+ 30 1-5, 7 March 04, 2003 125 49 34.7 *
30 1-5,7 April 14, 2003 124 49 0.3
Landsat-5 TM 30 1-5, 7 Jun 25, 2009 124 49 3.7
ASTER 15 1-3 April 02, 2009 - - 4.0
(* Although the average cloud coverage of Landsat-7 ETM+ is very high, there is almost no cloud in study area at that time). Table 1. Characteristics of satellite data used in study area
4. RESULTS AND DISCUSSION
4.1 Land Use/ Cover Changes
Before doing any other interpretations, thematic LULC maps (1990, 2003 and 2009) were assessed their accuracy through four measurable means of error matrix: overall accuracy, producer’s accuracy, user’s accuracy and Kappa coefficient. A total of 300 stratified random pixels was taken for each LULC map and then checked with reference data. According to the accuracy assessment results of classified maps, the overall accuracy for Landsat TM 1990, Landsat ETM+ 2003 and Landsat TM 2009 was 84.44% and 89.00%, and 92.15% respectively; the Kappa Coefficient of those maps reached at 0.7534, 0.8005, and 0.9021 respectively. Collating with the minimum 85% accuracy stipulated by the Anderson classification scheme for satellite-derived LULC maps, these statistics were adequate for continuously studying (Anderson et al., 1976, Kamusoko and AniYa, 2006).
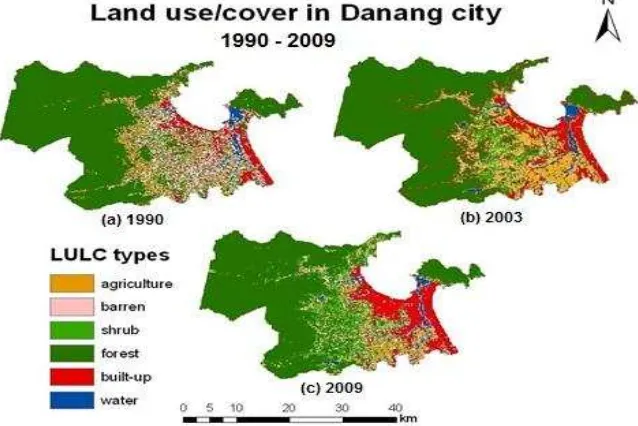
The LULC maps of study area were generated for all three years (Figure 2) and classification area statistics were summarised in table 3. The classified areas were measured by multiplying the number of pixel with spatial resolution of remote data (i.e. 30m), in which the pixel number was determined after applying postclassification analysis. And then changes were defined based on the difference of pixel number between two dates. Based on Figure 2, forest and urban areas were the dominant LULC classes in spatial distribution pattern. Accordingly, forest area was counted for about 64%, 62.2% and 59.8% of the total area in 1990, 2003 and 2009 respectively; meanwhile urban area was occupied 6.5%, 11.3% and 17.9% of the total area in 1990, 2003 and 2009 respectively. The surface water body covers about 2.5%, 3.3% and 3.1% of the total region study in 1990, 2003 and 2009, respectively. The results also showed that from 1990 to 2009 LULC units under shrub, agriculture and barren decreased from 10.1% to 9.9%, 12.4% to 7.5% and 4.5% to 1.8%, respectively.
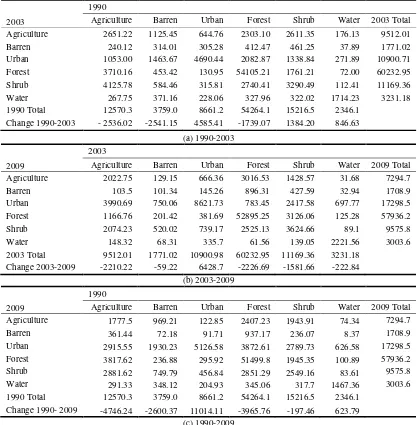
To provide a further comprehensive calculation in losing and gaining among the six LULC classes, the from-to change matrix of land use/cover in Danang city were created in three intervals,1990-2003, 2003-2009 and 1990-2009 (Table 4).
Figure 3. Areas land use/cover classes of Danang city
In cross tabulation, unchanged pixels were located along the major diagonal of the matrix while conversion values of classes were arranged in descending order.
LULC class
1990 2003 2009
Area
(ha) (%)
Area
(ha) (%)
Area
(ha) (%)
Agri-culture 12570.3 13.0 9512.0 9.8 7294.7 7.5
Barren 3759.0 3.9 1771.0 1.8 1708.9 1.8
Urban 8661.2 8.9 10900.7 11.3 17298.5 17.9
Forest 54264.1 56.0 60233.0 62.2 57936.2 59.8
Shrub 15216.5 15.7 11169.4 11.5 9575.8 9.9
Water 2346.1 2.4 3231.2 3.3 3003.6 3.1
Total 96817.2 100 96817.2 100 96817.7 100
Table 3. Results of and use/cover classification for 1990, 2003 and 2009 images
(a) 1990-2003
2009
2003
Agriculture Barren Urban Forest Shrub Water 2009 Total
Agriculture 2022.75 129.15 666.36 3016.53 1428.57 31.68 7294.7
Barren 103.5 101.34 145.26 896.31 427.59 32.94 1708.9
Urban 3990.69 750.06 8621.73 783.45 2417.58 697.77 17298.5
Forest 1166.76 201.42 381.69 52895.25 3126.06 125.28 57936.2
Shrub 2074.23 520.02 739.17 2525.13 3624.66 89.1 9575.8
Water 148.32 68.31 335.7 61.56 139.05 2221.56 3003.6
2003 Total 9512.01 1771.02 10900.98 60232.95 11169.36 3231.18 Change 2003-2009 -2210.22 -59.22 6428.7 -2226.69 -1581.66 -222.84
(b) 2003-2009
2009
1990
Agriculture Barren Urban Forest Shrub Water 2009 Total
Agriculture 1777.5 969.21 122.85 2407.23 1943.91 74.34 7294.7
Barren 361.44 72.18 91.71 937.17 236.07 8.37 1708.9
Urban 2915.55 1930.23 5126.58 3872.61 2789.73 626.58 17298.5
Forest 3817.62 236.88 295.92 51499.8 1945.35 100.89 57936.2
Shrub 2881.62 749.79 456.84 2851.29 2549.16 83.61 9575.8
Water 291.33 348.12 204.93 345.06 317.7 1467.36 3003.6
1990 Total 12570.3 3759.0 8661.2 54264.1 15216.5 2346.1
Change 1990- 2009 -4746.24 -2600.37 11014.11 -3965.76 -197.46 623.79 (c) 1990-2009
Table 4. Matrices of land use/cover changes in Danang city, Vietnam in hectares During 1990-2003, results showed that agriculture, barren
and forestry decreased strongly while urban area, shrub and water body increased, notably the raising of urban area. Table 4(a) indicated that the expansion of urban area was the most dramatic changes in the region, which was the result of
promptly growing up of economic after applying “DOI MOI” policy. Based on statistic, 4585.41ha of urbanized area in this period was calculated, which was nearly as large as the coverage of urban area in 1990, thus representing an increase of 73%. Analysing the component of the conversion of growth in urban 2003
1990
Agriculture Barren Urban Forest Shrub Water 2003 Total
Agriculture 2651.22 1125.45 644.76 2303.10 2611.35 176.13 9512.01
Barren 240.12 314.01 305.28 412.47 461.25 37.89 1771.02
Urban 1053.00 1463.67 4690.44 2082.87 1338.84 271.89 10900.71
Forest 3710.16 453.42 130.95 54105.21 1761.21 72.00 60232.95
Shrub 4125.78 584.46 315.81 2740.41 3290.49 112.41 11169.36
Water 267.75 371.16 228.06 327.96 322.02 1714.23 3231.18
1990 Total 12570.3 3759.0 8661.2 54264.1 15216.5 2346.1
area, 42.6% was converted from forestry, 25.3% from barren and 22.3% from shrub. The coverage of water body between 1990 and 2003 was significant difference because of the construction of two new reservoirs in study area. In second period, from 2003 to 2009, urban area was the only one which continuously increased, whereas the other classes decreased. Statistic from Table 4(b) showed the amount of urbanized area as 6428.7ha. The increase of urban area could be represented as 59% of its 2003 area by 2009. Of the area that urban got from 2003 to 2009, 51.7% was converted from agriculture and 26.1% from shrub. In the span of 20 years, the coverage of urban area has incessantly increased from 8861.2ha in 1990 to 17298.5ha in 2009, thus representing an increase of 95.2%% (8437.3ha). Table 4(c) indicated that the increasing of urban area in Danang city mainly came from about 32.5%, 25.4%, 25.3% and 17.5% of forestry, agriculture, shrub and barren area, respectively. Based on Figure 3, the difference of spatial distribution of urban area could be clearly observed by the years. In 1990, the urban area dispersedly located along the costal line. By 2003, this area was expanded more concentrated along coastal zone and moved toward Sontra peninsula. From 2003 to 2009, the urban expansion changed the direction from costal toward in land.
4.2 Land surface temperature
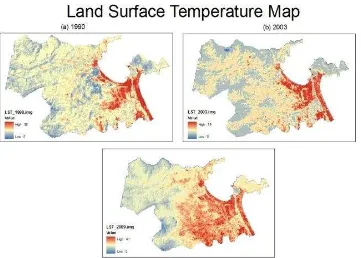
Figure 4 shows the results of surface temperature distribution across the city of Danang. Observations map shows the highest surface temperature during study period ranges from
38oC - 41oC. In particular, the construction of high-density
land surface temperature has the largest, with an average value is 37°C and are shown in red on the map; concentrated in the urban areas along the coastal region. In contrast, the forestland and the green area of agricultural land remaining lower temperatures. Particularly, the surface temperature of the water in the soil is low, with average values reaching
20oC and is shown in dark blue on the map. The results also
show that the temperature in vegetated areas was lower in comparison with built-up areas. Because vegetation has the
capability of evaporating, which help to accelerate the process of heat transfer between land surface and atmosphere. Meanwhile, temperature in urban area covered by impervious surfaces was higher due to its construction materials shown a tendency in absorbing and holding heat, and less evaporating.
Over the years, various studies have shown that the change of LULC overlay huge impact on the environment. To clarify this statement by remote sensing, through linear regression method we analyzed the relationship between the difference vegetation index (NDVI) and surface temperature (LST) of each land use/cover type. From the data in Table 5, it shows that NDVI of water surface gets the lowest value. Meanwhile, built-up area, covered by impervious surface has high temperature. Thus, the NDVI and LST of different land use/cover type tend inversely proportional to each other.
Table 5. Values of LST and NDVI at different LCLV type in classified map 2009
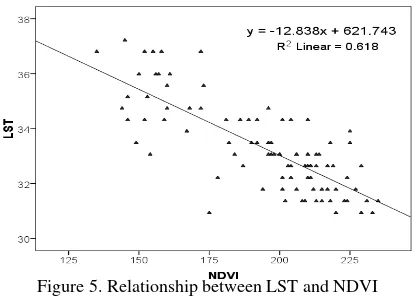
Using random sampling method, 100 samples generated from the classified map 2009, in which pixels value NDVI of water had been removed. Next, the values NDVI and LST of different LULC at each sample point were determined. Results of linear regression analysis showed that NDVI and LST of land use/land cover has a negative correlation with a correlation coefficient R2 = 0.618. As can be seen from Figure 5, the points located at the right bottom corner have high value of NDVI, and conversely. Similarly, on the top left corner, the points got high value of LST, low value of NDVI. It means that, changing the type of LULC will affect directly the surface temperature within Danang.
Figure 4. Land surface temperate map of Danang city No LULC type LST (oC) NDVI
1 Water 28.41 58.5
2 Forestland 31.13 228
3 Agriculture 32.42 203
4 Bare soil 33.67 184
5 Built-up area low density 37.01 135.5
Figure 5. Relationship between LST and NDVI agriculture, forest, barren and shrub because of conversion to urban land during the span of 20 years has taken place. Surface temperature in Danang city increases continuously from 38oC to 41oC. For further understanding the effect of changing LULC to environment, the relationship between LST and NDVI taken within classified map 2009 were perform. Accordingly, urban area showed high value of LST and low value of NDVI.
References
A. A. Nielsen, Conradsen, K. & Simpson, J., 1998. Multivariate alteration dectection (MAD) and MAF postprocessing in multispectral, bitemporal image data: new approaches to change detection studies, Remote Sensing of Environment, 64, 1-19.
Anderson, J.R., Hardy, E.E., Roach, J. & Witmer, R.E., 1976. A land use/cover classification system for use with remote sensor data, US Geological Survey Professional 964: Sious Falls, SD.
Braimoh, A.K. & Onishi, T., 2007. Geostatistical techniques for incorporating spatial correlation into land use change models, International Journal of Applied Earth Observation and Geoinformation, 9, 438.
Canty, M.J., 2010. Image analysis, classification and change detection in remote sensing with algorithms for ENVI/IDL, Second edn, Vol., pp. Pages, Taylor and Francis.
Canty, M.J. & Nielsen, A.A., 2008. Automatic radiometric normalization of multitemporal satellite imagery with the iteratively re-weighted MAD transformation, Remote Sensing of Environment, 112, 1025-1036.
Dewan, A.M. & Yamaguchi, Y., 2009. Land use and land cover change in Greater Dhaka, Bangladesh: Using remote sensing to promote sustainable urbanization, Applied Geography, 29, 390-401.
Diallo Y., Hu G. & Wen X., 2009. Applications of Remote Sensing in Land Use/Land Cover Change Detection in Puer and Simao Counties, Yunnan Province, Journal of American Science, 5, 157-166.
Hathout, S., 2002. The use of GIS for monitoring and predicting urban growth in East and West St Paul, Winnipeg, Manitoba, Canada, Journal of Environmental Management, 66, 229-238.
http://www.danang.gov.vn/ Retrieved 10/04/2010, from http://www.danang.gov.vn/TabID/76/CID/711/ItemID/874 3/default.aspx.
http://www.myvietnam.info/ Retrieved 20/12/2011, from http://www.myvietnam.info/
Li,J.-., Wang, X.-R., X.-J., Ma, W.-C. and Zhang, H., 2009, Remote sensing evaluation of urban heat island and its spatial pattern of the Shanghai metropolitan, China, Ecological Complexity 6, 413-420
Jensen, J.R., 2005. Introductory digital image processing: a remote sensing perspective, 3nd edn, Vol., pp. Pages, 3nd Edition, NJ: Prentice-Hall.
Jiménez-Muñoz, J. C., and Sobrino, J. A., 2003, A generalized single-channel method for retrieving land surface temperature from remote sensing data: Journal of Geophysical Research: Atmospheres, v. 108, no. D22. Owen, T. W., Carlson, T.N. and Gillies, R.R.,, 1998, An
assessment of satellite remotely-sensed land cover parameters in quantitatively describing the climate effect of urbanization.: international Journal of Remote Sensing, v. 19, p. 1663-1681.
Landsat Project Science Office, L. P. S., 2002, Landsat 7 Science Data User's Handbook. Available at. http://landsathandbook.gsfc.nasa.gov/.
Kamusoko, C. & AniYa, M., 2006. Land use/cover change and landscape fragmentation analysis in the Bindura district, Zimbabwe, Land Degradation and Development, 18, 221-233.
Mengistu D. A. & Salami A. T., 2007. Application of remote sensing and GIS inland use/land cover mapping and change detection in a part of south western Nigeria, African Journal of Environmental Science and Technology, 1, 99-109. Myint, S.W. & Wang, L., 2006. Multicriteria decision approach
for land use land cover change using Markov chain analysis and a cellular automata approach, Canadian of Remote Sensing, 32, 390-404.
Reis, S., 2008. Analyzing Land Use/Land Cover Changes Using Remote Sensing and GIS in Rize, North-East Turkey, Sensors, 8, 6188-6202.
Sorbrino, J. A., Jiménez-Muñoz, J. C., Paolini, L., 2004. Land surface temperature retrieval from Landsat TM5. Remote Sensing of Environment 90, 434-440
Schott, J.R., Volchok, W.T., 1985. Thematic mapper thermal infrared calibration. Photogrammetric Engineering and Remote Sensing 51 (9), 1351 -1357
Sun, Z., Ma, R. & Wang, Y., 2009. Using Landsat data to determine land use changes in Datong basin, China, Environmental Geology, 57, 1825-1837.
Turner, B.L., 1994. Local faces, global flows: The role of land use and land cover in global environmental change, Land Degradation and Development, 5, 71-78.
Voogt, J. A. a. o., T, R.,, 2003, Thermal remote sensing of urban areas: Remote Sensing of Environment, v. 86, no. 370-384. Weng, Q., Lu, D, and Schrubring, J.,, 2004, Estimation of land
surface temperature-vegetation abundance relationship for urban heat island studies.: Remote Sensing of Environment, v. 89, p. 467-483.
Wukelic, G, E., Gibbons, D, E., Martucci, L.M, Foote, H, P., 1989. Radiometric calibration of landsat thematic mappper thermal band. Remote Sensing of Environment 28, 339-347 Xiaolu Zhou, Y.-C. W., 2011, Dunamics of Land Surface