Variability in soil heat flux from a mesquite dune site
William P. Kustas
a,∗, John H. Prueger
b, Jerry L. Hatfield
b,
Kalia Ramalingam
c, Lawrence E. Hipps
caUSDA Agricultural Research Service, Hydrology Lab, Beltsville, MD, USA bUSDA Agricultural Research Service, Soil Tilth Lab, Ames, IA, USA cDepartment of Soils, Plants and Biometeorology, Utah State University, Logan, UT, USA
Received 15 July 1999; received in revised form 31 January 2000; accepted 27 February 2000
Abstract
For many natural and agricultural landscapes, vegetation partially covers the ground surface, resulting in significant varia-tions in soil heat flux between interspace areas and underneath vegetation. This is particularly apparent in arid and semiarid regions where vegetation cover is low and clustered or ‘clumped’ with large areas of exposed soil. Surface heterogeneity presents significant challenges to the use of standard micro-meteorological measurement techniques for estimating surface energy balance components. The objective of this study was to use an array of 20 soil heat flux plates and soil temperature sensors to characterize the spatial and temporal variability in soil heat flux as affected by vegetation and micro-topographic effects of mesquite dunes in the Jornada Experimental Range in southern New Mexico. Maximum differences in soil heat flux among sensors were nearly 300 W m−2. Maximum differences among individual sensors under similar cover
condi-tions (i.e. no cover or interdune, partial or open canopy cover and full canopy cover) were significant, reaching values of 200–250 W m−2. The ‘area-average’ soil heat flux from the array was compared with an estimate using three sensors from
a nearby micro-meteorological station. These sensors were positioned to obtain soil heat flux estimates representative of the three main cover conditions: namely, no cover or interdune, partial or open canopy cover, and full canopy cover. Comparisons between the array-average soil heat flux and the three-sensor system indicate that maximum differences on the order of 50 to nearly 100 W m−2are obtained in the early morning and mid-afternoon periods, respectively. These discrepancies are
caused by shading from the vegetation and micro-topography. The array-derived soil heat flux also produced a significantly higher temporal varying soil heat flux/net radiation ratio than what has been observed in other studies under more uniform cover conditions. Results from this study suggest that, to determine the number and location of sensors needed for estimating area-average soil heat flux in this type of landscape, one needs to account not only for the clustering of the vegetation cover but also micro-topography. Published by Elsevier Science B.V.
Keywords:Soil heat flux; Variability; Mesquite dune site
1. Introduction
Soil heat flux (G) is a necessary component of the surface energy balance to account for the storage and
∗Corresponding author. Tel.:+1-301-504-8498;
fax:+1-301-504-8931.
E-mail address:[email protected] (W.P. Kustas)
transfer of heat into the soil and the exchange between the soil and the atmosphere. Typically,Gis estimated by placing several soil heat flux plates at 5–10 cm depths and using soil temperature probes above the plates for estimating soil heat storage. On uniform surfaces with high vegetation cover, G is usually 5–10% of RN during midday and can be estimated fairly reliably with three to five sensors. However,
250 W.P. Kustas et al. / Agricultural and Forest Meteorology 103 (2000) 249–264
when the vegetation cover is partial or sparse and clustered or ‘clumped’, the variation inGcan be sig-nificant (Kustas and Daughtry, 1990; Stannard et al., 1994). Furthermore, under partial canopy cover, the area-averageGis a much more significant fraction of
RN with values ranging from 20 to 40% ofRNwhich is primarily controlled by the fraction of vegetative cover (Choudhury et al., 1987).
Techniques to infer G from remote sensing have been given attention recently since modeling of the surface energy balance at large scales requires meth-ods for estimating the spatial variability of G (e.g. Daughtry et al., 1990; Kustas et al., 1994; Gao et al., 1998; Jacobsen and Hansen, 1999). For energy bal-ance closure assessment using eddy covaribal-ance meth-ods, an accurate estimate ofGcan be critical for sparse canopy-covered surfaces (Stannard et al., 1994).
With standard micro-meteorological techniques such as Bowen ratio or eddy covariance, soil heat flux measurements typically consist of two to three heat flow plates buried at 5–10 cm and soil temperature probes at multiple depths above the plates for calculat-ing heat storage above the heat flow plates (Kanemasu et al., 1992; Kustas et al., 1996). In three recent ex-periments over sparse heterogeneous cover conditions in semi-arid regions, anywhere from two to nine heat flow plates/soil temperature systems were used to es-timate the area-average soil heat flux (Stannard et al., 1994; Dugas et al., 1996; Lloyd et al., 1997). Stannard et al. (1994) evaluated differences in soil heat flux estimates among three micro-meteorological stations located at a sparse vegetative canopy cover site in a semiarid rangeland environment. They found standard errors in area-average soil heat fluxes to be on the order of 30–40 W m−2and using three plate/soil tem-perature sensor systems (clusters) gave significantly more reliable area-averageGthan using two clusters. There is clearly an uncertainty as to the number of soil heat flux sensors required to obtain a representa-tive soil heat flux for most heterogeneous surfaces. Ob-viously, there are practical limitations to the number of sensors one can use to obtain a representative value within several meters of a flux tower. This limitation is more pronounced when trying to obtain representa-tiveGvalues commensurate with the source-area foot-print of flux sensors, which for typical measurement heights result in footprint sizes having length scales on the order of 10–102m. This source-area footprint can
vary greatly in dimension as a function of wind speed, stability and surface roughness (Schmid, 1994).
For desert ecosystems in particular,G is a signif-icant component of the daytime surface energy bal-ance. Dugas et al. (1996) evaluated energy balance components for five desert plant communities using three soil heat flux observations at each site (one be-ing in a mesquite dune site similar to the one used in this study). Midday values ofGtypically ranged from 20 to nearly 40% of the net radiation with the low-est net radiation and soil heat flux low-estimated for the mesquite site. Clearly, a significant bias in the mea-sured soil heat flux for any of these different desert plant communities could greatly alter water use esti-mation, especially when using the Bowen ratio/energy balance approach since it requires an estimate of avail-able energy (i.e. net radiation less soil heat flux) for computing evapotranspiration (Dugas et al., 1996).
This study evaluates the spatial and temporal vari-ability in soil heat flux in sparse vegetative canopies in the Jornada Experimental Range in southern New Mexico. The site contains ‘islands’ of clumped shrub (mesquite) vegetation and relatively large interspace areas devoid of vegetative cover. These mesquite islands or dunes are several meters in height and 10’s of meters in width, resulting in significant micro-topography over an otherwise relatively flat landscape. An array of 20 sensors was laid out over a typical mesquite dune to characterize the spatial and temporal variability in soil heat flux as affected by vegetation and micro-topographic effects. An area-average soil heat flux from the array is compared with a set of three measurements from a standard micro-meteorological station judiciously positioned to obtain representative soil heat flux estimates from interdune or no cover condition, partial canopy cover, and full canopy cover conditions. Results are also presented using a more practical five-sensor array for estimating area-average soil heat flux.
2. Measurements
2.1. Measurement method
using heat flow transducers (Tanner, 1960; Fuchs and Tanner, 1968). Thus, the change in heat storage of the soil layer above the plate is added to the plate measurements, namely
G=GP+1TSCSD
t (1)
where GP is the plate heat flow measurement, 1TS the change in mean soil temperature (K) during the measurement period,CS the volumetric heat capacity of the soil (MJ m−3K−1),Dthe depth of the plate (m), and t the length of the measurement period (s). An equation from De Vries (1963) was used to estimate the volumetric heat capacity,CS:
CS =1.94θM+2.5θC+4.18θW (2) whereθM,θCandθWare the volume fractions of the mineral soil, organic matter and water, respectively.
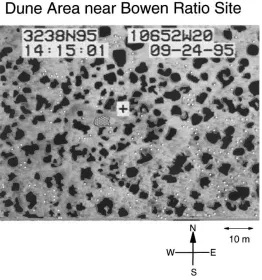
Fig. 1. Aerial view from aircraft video of the mesquite dune area surrounding the soil heat flux measurement site in the Jornada Experimental Range. Latitude, longitude, time and date of the observation are ‘stamped’ on the image. Dunes (black figures) and interdune (white dots) vegetation are highlighted in the image. The box with+sign is the approximate location of the Bowen ratio station and the dune with cross-hatching contained the 20-sensor array (see text).
Differences between heat flow plate thermal conduc-tivity and that of the soil were estimated using the the-ory developed by Philip (1961); average differences were found to be less than 5 W m−2, and therefore, considered negligible. This approach assumes that hor-izontal heat conduction is small compared to the ver-tical.
2.2. Measurement site
252 W.P. Kustas et al. / Agricultural and Forest Meteorology 103 (2000) 249–264
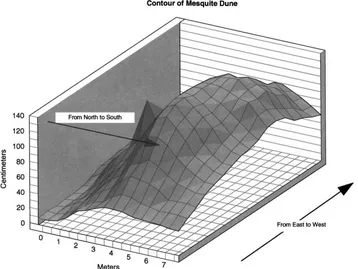
Fig. 2. Micro-topographic representation of the mesquite dune where the array of 20 soil temperature and heat flow transducers were located in the Jornada Experimental Range.
imagery analyzed by Ramalingam (1999) indicates approximately 25% mesquite dune and 75% inter-dune/bare soil. Dunes that cover the area range in di-ameter from 1 to 10 m, and in height from 0.5 to 1.5 m. Laser altimeter data collected over this site indicate dunes averaging 10 m in width with average distances between dune peaks being on the order of 30 m (De Vries et al., 1997, 2000; Pachevsky et al., 1997). The mesquite vegetation on the dunes is relatively sparse. Measurements of plant/leaf area index summarized in Gibbens et al. (1996) and Havstad et al. (2000) indicate a global value (includes interdune areas essentially devoid of vegetation) typically between 0.3 and 0.4. With a fractional cover∼=0.25, this yields a local value (for vegetated areas on the dunes only) of plant/leaf area index of 1.2 (=0.3/0.25)–1.6 (=0.4/0.25).
The dune that was used in this study was in close proximity to a Bowen ratio/energy balance station (see Fig. 1). Micro-topographic features of the dune were surveyed yielding overall dimensions as shown
in Fig. 2. The dune was approximately 7 m in length in the north–south direction, and 10 m in the east–west direction, with a maximum height of ∼1.4 m. The mesquite vegetation on the dune had an average height of∼0.80 m.
2.3. Measurement design
The soil texture data for the site indicated a sandy soil with low organic matter content, yielding
are thin plates ∼0.04 m in diameter and ∼0.004 m thick. For the array, the plates were buried at 0.08 m and soil thermocouple probes were buried at 0.02 and 0.06 m below the soil surface for estimating a 1TS for the upper 0.08 m of soil. For the REBS EBBR sta-tion, the sensors were buried at 0.05 m with a 0.08 m REBS STP platinum resistance temperature detector inserted at a 45◦angle above each plate measuring an average1TSfor the 0–0.05 m layer. Half-hourly aver-age values ofGP andTSat−0.02 and−0.06 m were stored on a Campbell Scientific Inc. (CSI 21X data logger/AM416 multiplexer) for each sensor package for the array, while 1/4-hourly averages ofGP andTS were stored by the REBS EBBR system running on a CSI CR10 data logger. The EBBRGP andTS values were converted to half-hourly averages to compare with array values.
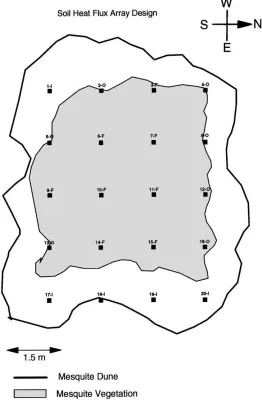
The array of 20 soil heat flow/soil temperature sen-sors (clusters) were positioned in a grid-like pattern in and around the mesquite dune to obtain both full and partial canopy cover as well as interdune val-ues (Fig. 3). This array was placed within 25 m of the REBS EBBR station where the three-sensor array was located. The heat flux plates were spaced approx-imately 1.5 m over the elliptically shaped dune with its major axis essentially oriented east–west (Fig. 3). Both a number defining its location in the dune and a letter designating its surface/cover condition (see be-low) were used for each heat flow/soil temperature sensor cluster. Surface/cover condition for each sen-sor was assessed from nadir photographs taken after installation of the array.
Although several of the sensors that are in the open/interdune are within 1.5 m of the vegetated area, the time when maximum differences were observed (see below) occurred at solar altitude anglesαS from ∼30 to 40◦. With this range in α
S, the horizontal extent of shading by vegetation 0.8 m in height at the dune edges was∼1.5–1 m, respectively. At the high-est point of the dune plus vegetation, the height was ∼2 m. This means that, with anαSof 30–40◦, shading from the center of the dune reached out to 3.5–2.5 m, respectively. Thus, shading by the vegetation did not have a significant effect on sensors located in the interdune areas. Moreover, due to a relatively open canopy, a significant fraction of incoming solar radi-ation actually reached the soil surface, even within the vegetated area of the dune. This was estimated
by taking the local plant/leaf area index of 1.2–1.6 and using Beer’s law (exponential extinction) for estimating radiation extinction in the canopy (Choud-hury et al., 1987). A constant extinction coefficient of 0.5 for a random canopy with spherical leaf angle distribution was used for αS>30◦ (Monteith, 1973). Approximately 45–55% of the incoming radiation was estimated to reach the soil surface.
The three soil heat flow/soil temperature sensor clusters from the REBS EBBR station were posi-tioned under the following conditions: (1) under a dense clump of mesquite vegetation on top of a dune; (2) in a dune having partial cover and southwest exposure; and (3) placed in an interdune area sev-eral meters away from any mesquite dune and with southerly exposure.
2.4. Analysis procedures
Soil heat fluxes from the array were available start-ing on 2 September 1996, day of year (DOY) 246, and they continued through the afternoon of DOY 290. The EBBR system also ran on a continuous basis over this same period. Two 7-day periods were used in this analysis, which were under mostly clear sky condi-tions, with one following several rainfall events (DOY 259–265) and the other under an extended dry period (DOY 281–287). Solar altitude angle,αS, at solar noon was approximately 57◦
for the first 7-day period and 52◦for the second 7-day period. For illustrative and analysis purposes, the half-hourly data for each 7-day period were averaged providing a single daily time trace. Since the results were very similar between the two measurement periods, only the daily time trace for the first 7-day period will be shown.
254 W.P. Kustas et al. / Agricultural and Forest Meteorology 103 (2000) 249–264
Fig. 3. Schematic illustrating the approximate locations (with corresponding site number and letter defining surface/cover condition) of the soil heat flux and soil temperature sensors across the mesquite dune in the Jornada Experimental Range during the 1996 study period. The letter I indicates that the sensor was in a no cover or interdune area. The letter O indicates the sensor was in an open canopy condition, only partially underneath vegetation. The letter F indicates that the sensor was under full vegetation cover or vegetation was surrounding the sensor, but that due to sparseness of the cover, most of these sensors would be shaded for only part of the daytime period (see text). Outline of mesquite dune and vegetated area are also illustrated.
underneath/inside the mesquite shrub canopy (i.e. sen-sor clusters were surrounded by mesquite vegetation) with surface soil heat flux values labeledGF.
To conduct time and spatial analyses, we used ETS procedure from SAS (SAS, 1996). The data were detrended to remove the change in the average
Spatial analyses were conducted on individual time averages within a measurement type. We used the GS+ program for these analyses in order to obtain the dis-tribution of the spatial variation of soil heat flux and soil temperature across the dune (Robertson, 1998).
3. Results and discussion
3.1. Variations of soil heat flux across the dune
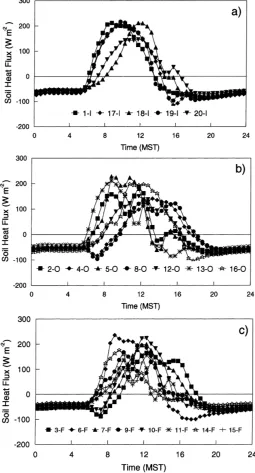
Soil heat flux,G, values for the two periods (DOY 259–265 and 281–287) and the three cover condi-tions show a wide variation throughout the day and are illustrated for the first 7-day period in Fig. 4. The most obvious feature of these plots is the variation inG values over the course of the day even among sensor clusters under similar cover conditions. Differ-ences in the time of maximum soil heat flux values for the sensors would suggest that these patterns are induced by micro-topographic and vegetative shad-ing effects which are influenced by the variation in solar azimuth and altitude. For example, the effects of micro-topography are seen between two sensors adjacent to one another in the interdune area (sites 18-I and 19-I). For 19-I, the maximum Goccurs in the mid-morning, while for 18-I, maximumGis near midday. A similar affect from vegetation shading is observed with the sensors under full canopy cover conditions where adjacent sensors (sites 6-F and 10-F) near the top of the dune have maximum Gin the morning and midday, respectively.
The effects of micro-topography result in signifi-cant differences inGI values, reaching ∼200 W m−2 several hours before solar noon (∼0900 MST) with a second maximum of ∼150 W m−2 by approximately 1600 MST (Fig. 4). For the other two cover conditions, maximum differences among individual GO and GF
values reach∼250 W m−2, again occurring at∼0900 MST with a second maximum of ∼200 W m−2 by 1600 MST. For the whole array, the maximum vari-ation reaches∼300 W m−2at around 0900 MST and
∼250 W m−2at∼1600 MST for the first 7-day period. For the second 7-day period, the values are∼250 and ∼200 W m−2, respectively.
To investigate further as to which factors primarily affect the relationship among sensors, a time series and spatial analysis among sensors were conducted.
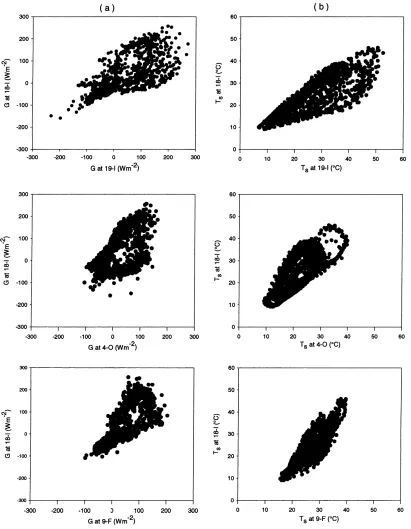
For all sensors, the most dominant time lag was at 30 min and the remainder of the lags were not signif-icant. More interesting were the relationships among soil heat flux and soil temperature observations as il-lustrated in Fig. 5. In this analysis,GandTS observa-tions from site 18-I (Fig. 3) were compared with three other locations representing each of the different sur-face/cover conditions. Site 18-I was selected because it represented an open area on the most level portion of the dune (Fig. 3) and its temporal behavior most closely matched the REBS sensor cluster positioned in the interdune region. These patterns displayed some unique features, including large differences in the shape of the patterns. TheGvalues at site 4-O and 9-F compared to site 18-I showed large diurnal variation and hysteresis (i.e. the differences both in magnitude and sign vary temporally). Comparison of sites 19-I and 18-I yielded significant scatter, but the differences did not show as strong a diurnal pattern. Since the large diurnal differences with site 18-I came not only from sensors positioned in other azimuth exposures and surface/cover condition (i.e. site 4-O) but also from sensors in close proximity and similar surface/cover condition (i.e. site 19-I), micro-topography appears to be one of the primary factors along with canopy cover that contributed to the discrepancies among the sensors positioned across this dune. Comparisons of the soil temperatures from site 18-I at 0.02 m depth relative to the other locations showed similar varia-tions throughout the day (Fig. 5). These variavaria-tions are again induced by micro-topography as well as vege-tation cover. Patterns using the 0.06 m soil tempera-tures were similar to those observed from the 0.02 cm depth.
256 W.P. Kustas et al. / Agricultural and Forest Meteorology 103 (2000) 249–264
258 W.P. Kustas et al. / Agricultural and Forest Meteorology 103 (2000) 249–264
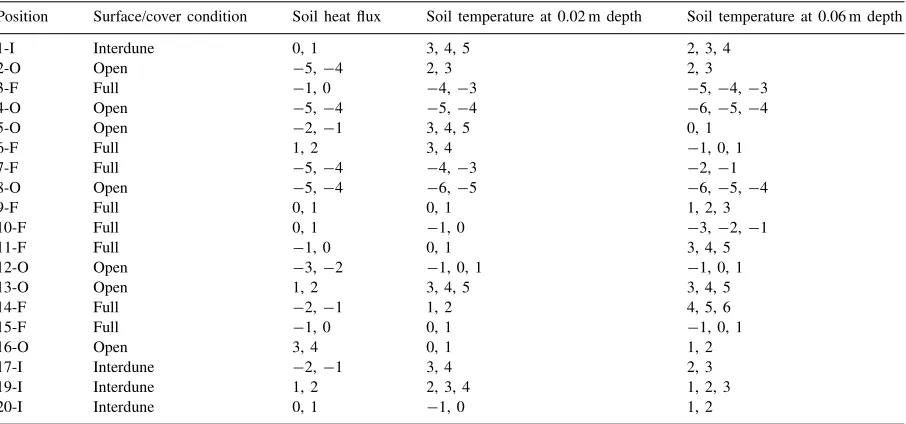
Table 1
Significant lags for soil heat flux and soil temperature at 0.02 and 0.06 m depths for positions across the mesquite dune, relative to position 18-I (Fig. 3), for the period from DOY 251 through 290a
Position Surface/cover condition Soil heat flux Soil temperature at 0.02 m depth Soil temperature at 0.06 m depth
1-I Interdune 0, 1 3, 4, 5 2, 3, 4
aThe three surface/cover conditions are defined by the letter I (interdune), O (open), and F (full canopy). See text for details.
presence of the canopy shifted the temperature or soil heat flux patterns to be earlier or later than the nearly level position. The shifts among interdune sites was mainly induced by micro-topography.
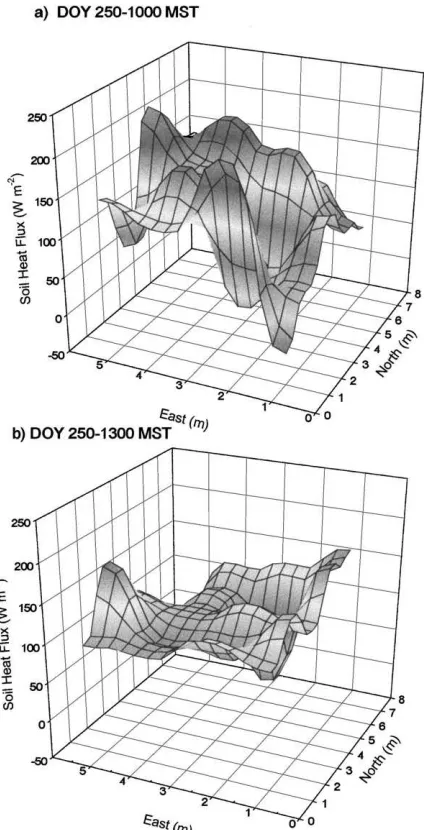
Interactions of micro-topography, sun angle, and the presence of the mesquite bush induced large changes in the spatial patterns of soil heat and tem-perature across the dune (Fig. 6). These data are shown for illustrative purposes and are typical of the patterns found in these periods throughout the study. These patterns changed throughout the day because of the changing solar zenith and azimuth angles; however, the most important factors in determining the patterns after the solar position are canopy cover and micro-topography. In fact, given that the ‘peaks’ and ‘valleys’ in the magnitude of G mainly reside along the edges of the 3-D plots (Fig. 6), it suggests that the dune micro-topography enhanced differences among soil heat flux measurement locations caused by canopy cover/shading effects. Variation in these spatial patterns indicates that it is highly unlikely that placement of only a few sensors across this complex surface will provide reliable area-average soil heat fluxes.
3.2. Relationships of soil heat flux from array compared to single measurements
Installation of an intensive network of 20 sensors would not be practical in many cases; however, it is critical to have confidence in the values obtained from smaller sample numbers. AverageG for each cover condition from the array was compared with the single
Fig. 6. Spatial variation of soil heat flux across the mesquite dune for DOY 250 at (a) 1000 MST and (b) 1300 MST.
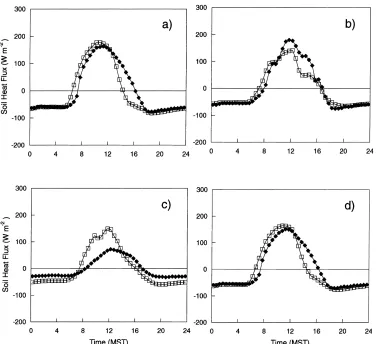
difference occurred in the afternoon at around 1500 MST where the maximum difference reached ∼100 and∼50 W m−2 for the first and second 7-day peri-ods, respectively, and was again caused by the array having GI<0, while the REBS sensor measurement remained positive. ForGO values, the maximum dif-ference occurred at around 1430 MST and was∼70 and∼50 W m−2 for the first and second 7-day
peri-ods, respectively. This pattern was due to GO from the single REBS sensor having a southwesterly expo-sure and not accounting for the wide range in solar altitude and azimuth angles affecting areas that were shaded and sunlit. Somewhat surprising were the large differences between the array and the REBS sensor network in theGFestimates. In this position, the max-imum differences were∼70 and∼100 W m−2for the first and second 7-day periods, respectively, and were evident the period from 0930 MST to 1230 MST. Fur-thermore, there are significant night-time differences on the order of 30 W m−2. This result shows how dif-ficult it is for a single sensor, even when positioned in a judicious manner, to provide representative values for a particular surface/cover condition.
In energy balance models, it is important to examine the average soil heat flux value for the landscape. We computed the averageGfor the mesquite site,GAVG, given by the array and the REBS network for the two 7-day periods by simply weightingGI, GO, and GF values by the fractional cover estimates:
260 W.P. Kustas et al. / Agricultural and Forest Meteorology 103 (2000) 249–264
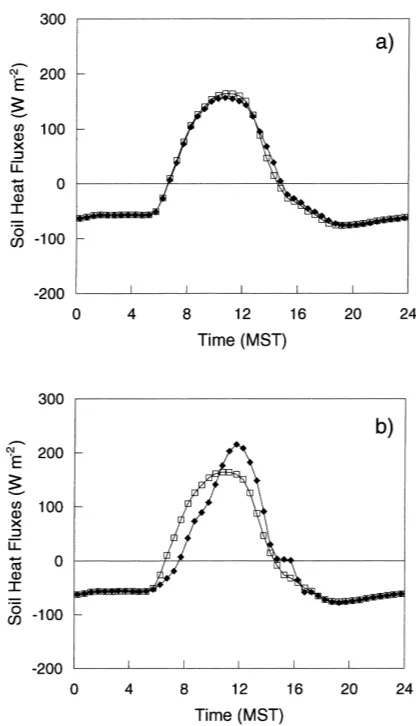
Fig. 7. Comparison of average soil heat flux values representing the three canopy cover conditions: (a) no cover or interdune (GI); (b) open canopy cover (GO); (c) full canopy cover (GF); and (d) weighted by fractional canopy cover estimates using Eq. (3),GAVG, for the 20-sensor array (open squares) and the REBS three-sensor installation (solid diamonds) for the first 7-day period (DOY 259–265).
magnitude and temporal behavior ofGAVGfollowing
GIfairly closely.
Values of root mean square difference (RMSD) (Willmott, 1982) between array and REBS network estimates of GI, GO, GF and GAVG are listed in Table 2 for the daytime period (solar radiation >0), 24 h period and for the two 7-day periods. The magni-tude of RMSD forGAVGwas surprisingly the second lowest. One of the few studies comparing different
GAVGestimates from different measurement networks over similar fractional vegetative shrub-dominated cover conditions, but without dunes (Stannard et al., 1994), yielded similar RMSD values on the order of
30–40 W m−2. Using the data throughout the study period, a least squares regression between theGAVG from the array and the REBS yielded the follow-ing expression: GAVG,REBS=0.73+0.88GAVG,array (R2=0.97). There is a significant bias as shown in this relationship with GAVG values from the REBS generally being lower than theGAVG from the array. This would suggest that using only several sensors for estimating soil heat flux in sparse heterogeneous canopy cover could result in significant bias.
Table 2
RMSD values betweenGI(interdune),GO(open canopy),GF(full canopy), andGAVG(area-average) estimated by Eq. (3) for the 20-sensor array vs. the REBS three-sensor network
Surface/cover condition 7-day period (day of year) RMSD daily (W m−2) RMSD daytime (W m−2)
GI 259–265 35 49
GO 259–265 27 38
GF 259–265 40 51
GAVG 259–265 30 43
GI 281–287 25 35
GO 281–287 20 28
GF 281–287 49 64
GAVG 281–287 22 32
reliable area-average soil heat flux estimates. How-ever, using a 20-sensor array in field studies is gen-erally not practical. Therefore, we evaluated two designs which are a compromise between having an extensive array of soil heat flow/temperature sensors and the number commonly used in past field studies (i.e. three-sensor clusters). One array design consisted of using sensor clusters at the four corners covering solar azimuth/altitude effects (i.e. sites 1-I, 4-O, 17-I and 20-I) and one near the dune center (site 10-F), called the ‘×’ design. Another five-sensor array de-sign used a cross-type pattern with sites 2-O, 6-F, 18-I, 5-O and 8-O, called the ‘+’ design. Using Eq. (3), GAVG was computed using these two five-array sensor designs and compared with the 20-sensor array.
Given the potential variability in individual sensors (Fig. 4), the five-sensor × design yielded a tempo-ral trace in GAVG in excellent agreement with the 20-sensor array (Fig. 8a). The RMSD values between the five-sensor×design and the 20-sensor array for the daytime observations was only∼10 and 5 W m−2 for the two 7-day periods, respectively. On the other hand, the +design did not reproduce the temporal trace as well (Fig. 8b). The RMSD values between the five-sensor +design and the 20-sensor array for the daytime observations were similar to the three-sensor REBS network, namely ∼40 and 30 W m−2 for the two 7-day periods, respectively. This result indicates that recommendation of a minimum number of sen-sors is difficult, but for this surface, a five-sensor array will be the minimum number necessary to account for both the effects of micro-topography and vegetation shading caused by solar altitude and azimuth.
262 W.P. Kustas et al. / Agricultural and Forest Meteorology 103 (2000) 249–264
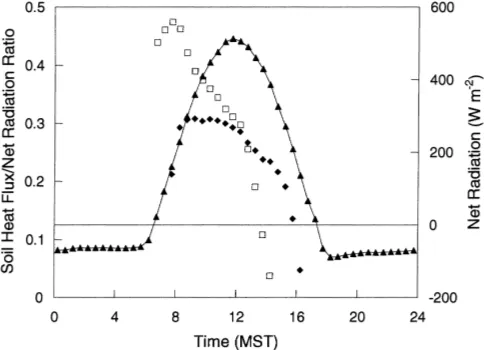
Fig. 9. Variations in the fraction of soil heat flux to net radiation (GAVG/RN) using the 20-sensor array (open squares) and the REBS three-sensor network (solid diamonds) for the first 7-day period (DOY 259–265). Average net radiation for this period is displayed (solid triangles).
3.3. Soil heat flux as a fraction of net radiation
For energy balance modeling, particularly at large scales using remote sensing, it has been convenient to estimate soil heat flux as a fraction of net radiation,
RN (Kustas and Norman, 1996). The temporal and spatial patterns for this dune site would suggest that the behavior of G/RN is a highly variable quantity. For the two 7-day periods, the ratio GAVG/RN var-ied throughout the day and is illustrated for the first 7-day period in Fig. 9. In the early morning period, before 1000 MST, the ratio exceeded 0.4 when using the array data and then declined throughout the day, reaching a minimum between 1430 and 1500 MST (Fig. 9). These patterns were consistent across the two periods and the diurnal patterns were the same across the study. The fact that theGAVG/RN estimated by the REBS three-sensor network is not as variable is probably due to the fact that sensors were mainly positioned to receive the maximum radiation (i.e. generally southwesterly exposures).
These results suggest that attempts to estimateGAVG
from measurements ofRN would have to account for the significant temporal variation inGAVG/RN, which also differs in the morning and afternoon periods; this is caused by the fact thatGAVG andRN are typically out of phase (Brutsaert, 1982). However, the temporal variability in GAVG/RN for this site is more extreme
than what has previously been observed by a number of other researchers for more dense and/or less hetero-geneous canopy cover situations (e.g. Clothier et al., 1986; Kustas and Daughtry, 1990). This may indicate that surfaces that not only contain clumped vegetation but have the added complication of micro-topographic effects may have to be treated differently.
4. Conclusions
Using an array of 20 GP and TS sensors (clus-ters) for estimatingGfor this heterogeneous mesquite dune site, significant variations were found over time with differences between individual sensors reaching ∼300 W m−2. By judiciously placing as little as three
GP and TS sensors in strategic locations, the aver-age for the dune/interdune area, GAVG, could yield an RMSD value on the order of 40 W m−2relative to the array average. There were, however, time periods whereGAVG from the three-sensor network deviated by∼100 W m−2.
On account of the large variation in individual G
required for sparse clumped vegetation with at least one out in the open or interspace area, one underneath the vegetation and one in a partial cover condition (Stannard et al., 1994). For the type of surface studied here, it was found that a five-sensor array using an× design with southerly, northerly, easterly and westerly exposures to account for micro-topographic/shading effects with changing solar altitude and azimuth an-gles could reproduce a GAVG in excellent agreement with the 20-sensor array (Fig. 8a). However, using a different five-sensor array (i.e. the+design), differ-ences were similar to the REBS three-sensor array, in-dicating that site selection of a relatively small number of sensors is indeed critical.
Finally, estimatingGAVGby assuming that the ratio
GAVG/RN is constant for this surface type will result in significant discrepancies. The temporal behavior inGAVG/RN for this site appears to be more extreme than what has been observed for other partial canopy covered surfaces. Thus, simple remote sensing meth-ods using a constant GAVG/RN ratio for estimating spatially-distributedGAVGvalues will have significant uncertainty in this environment unless one considers the temporal variability in theGAVG/RNratio.
Acknowledgements
The authors express appreciation towards the staff of the USDA-ARS Jornada Experimental Range, Las Cruces, NM, especially Dr. Kris Havstad for logis-tical support and Mr. Jim Lenz for maintaining soil heat flux array network. We also appreciate the logis-tical and financial support provided by the JORNEX project coordinated by Dr. Al Rango, Dr. Jerry Ritchie and Dr. Tom Schmugge of the USDA-ARS Hydrology Laboratory, Beltsville, MD.
References
Amer, S.A., Keefer, T.O., Weltz, M.A., Goodrich, D.C., Bach, L.B., 1994. Soil-moisture sensors for continuous monitoring. Water Resour. Bull. 30, 69–83.
Brutsaert, W., 1982. Evaporation into the Atmosphere. D. Reidel, Dordrecht, The Netherlands, 299 pp.
Choudhury, B.J., Idso, S.B., Reginato, R.J., 1987. Analysis of an empirical model for soil heat flux under a growing wheat crop for estimating evaporation by an infrared-temperature based energy balance equation. Agric. For. Meteorol. 39, 283–297.
Clothier, B.E., Clawson, K.L., Pinter Jr., P.J., Moran, M.S., Reginato, R.J., Jackson, R.D., 1986. Estimation of soil heat flux from net radiation during growth of alfalfa. Agric. For. Meteorol. 27, 319–329.
Daughtry, C.S.T., Kustas, W.P., Moran, M.S., Pinter Jr., P.J., Jackson, R.D., Brown, P.W., Nichols, W.D., Gay, L.W., 1990. Spectral estimates of net radiation and soil heat flux. Remote Sens. Environ. 32, 111–124.
De Vries, D.A., 1963. Thermal properties of soil. In: van Wijk, W.R. (Ed.), Physics of the Plant Environment. North-Holland, Amsterdam, pp. 210–235.
De Vries, A., Ritchie, J.C., Menenti, M., Kustas, W.P., 1997. Aerodynamic roughness estimated from surface features for a coppice dune area using laser altimeter. In: AMS Proceedings of the 12th Symposium on Bound.-Layers Turb., pp. 289–290. De Vries, A.C., Ritchie, J.C., Klaasen, W., Menenti, M., Kustas, W.P., Rango, A., Preuger, J.H., 2000. Effective aerodynamic roughness estimated from airborne laser altimeter measurements of surface features. Int. J. Remote Sens., submitted for publication.
Dugas, W.A., Hicks, R.A., Gibbens, R.P., 1996. Structure and function of C3and C4 Chihuahuan Desert plant communities. Energy balance components. J. Arid Environ. 34, 63–79. Fuchs, M., Tanner, C.B., 1968. Calibration and field test of soil
heat flux plates. Soil Sci. Soc. Am. Proc. 32, 326–328. Gibbens, R.P., Hicks, R.A., Dugas, W.A., 1996. Structure and
function of C3and C4 Chihuahuan Desert plant communities. Standing crop and leaf area index. J. Arid Environ. 34, 47–62. Gao, W., Coulter, R.L., Lesht, B.M., Qiu, J., Wesely, M.L., 1998. Estimating clear-sky regional surface fluxes in the southern great plains atmospheric radiation measurement site with ground measurements and satellite observations. J. Appl. Meteorol. 37, 5–22.
Havstad, K.M., Kustas, W.P., Rango, A., Ritchie, J.C., Schmugge, T.J., 2000. Jornada Experimental Range: a unique arid land location for experiments to validate satellite systems. Remote Sens. Environ., in press.
Jacobsen, A., Hansen, B.U., 1999. Estimation of soil heat flux/net radiation ratio based on spectral vegetation indexes in high-latitude Arctic areas. Int. J. Remote Sens. 20, 445–461. Kanemasu, E.T., Verma, S.B., Smith, S.A., Fritschen, L.J., Wesely,
M., Field, R.T., Kustas, W.P., Weaver, H., Stewart, J.B., Gurney, R.J., Panon, G., Moncrieff, J.B., 1992. Surface flux measurements in FIFE: an overview. J. Geophys. Res. 97 (D17), 18547–18555.
Kustas, W.P., Daughtry, C.S.T., 1990. Estimation of the soil heat flux/net radiation ratio from spectral data. Agric. For. Meteorol. 49, 205–223.
Kustas, W.P., Norman, J.M., 1996. Use of remote sensing for evapotranspiration monitoring over land surfaces. Hydro. Sci. J. 41, 495–516.
Kustas, W.P., Perry, E.M., Doraiswamy, P.C., Moran, M.S., 1994. Using satellite remote sensing to extrapolate evapotranspiration estimates in time and space over a semiarid rangeland basin. Remote Sens. Environ. 49, 275–286.
264 W.P. Kustas et al. / Agricultural and Forest Meteorology 103 (2000) 249–264
effects on Penman–Monteith and Priestley–Taylor parameters. Agric. For. Meteorol. 82, 171–193.
Lloyd, C.R., Bessemoulin, P., Cropley, F.D., Culf, A.D., Doleman, A.J., Elbers, J., Heusinkveld, B., Moncrieff, J.B., Monteney, B., Verhoef, A., 1997. A comparison of surface fluxes at the HAPEX-Sahel fallow bush sites. J. Hydrol. 188/189, 400– 425.
Monteith, J.L., 1973. Principles of Environmental Physics. American Elsevier Publishing Company, New York, 241 pp. Pachevsky, Y.A., Ritchie, J.C., Gimenez, D., 1997. Fractal
modeling of airborne laser altimetry data. Remote Sens. Environ. 61, 150–161.
Philip, J.R., 1961. The theory of heat flux meters. J. Geophys. Res. 66, 571–579.
Ramalingam, K., 1999. Determination of surface fluxes of heat and water vapor in an arid ecosystem. M.S. Thesis, Department of
Plants, Soils & Biometeorology, Utah State University, Logan, UT, 119 pp.
Robertson, G.P., 1998. GS+: Geostatistics for the Environmental
Sciences. Gamma Design Software, Plainwell, MI, 152 pp. SAS/ETS User’s Guide, 1996. Release 6.03 Edition, SAS Institute,
Cary, NC.
Schmid, H.P., 1994. Source areas for scalars and scalar fluxes. Bound.-Layer Meteorol. 67, 293–318.
Stannard, D.I., Blanford, J.H., Kustas, W.P., Nichols, W.D., Amer, S.A., Schmugge, T.J., Weltz, M.A., 1994. Interpretation of surface flux measurements in heterogeneous terrain during the Monsoon ’90 experiment. Water Resour. Res. 30, 1227–1239. Tanner, C.B., 1960. Energy balance approach to evapotranspiration
from crops. Soil Sci. Soc. Am. Proc. 24, 1–9.