Influence of fertilizer management and water regime on methane
emission from rice fields
Arun Kumar Rath
a, B. Swain
a, B. Ramakrishnan
a,∗, D. Panda
a, T.K. Adhya
a, V.R. Rao
a,
N. Sethunathan
baCentral Rice Research Institute, Cuttack 753 006, India bIndian Agricultural Research Institute, New Delhi 110 012, India
Received 10 September 1998; received in revised form 6 May 1999; accepted 31 May 1999
Abstract
Experiments were conducted to determine methane emission from a rainfed lowland rice field (water depth about 3–30 cm) and an irrigated shallow rice field (4–6 cm), both planted to the same cultivar, cv. ‘Gayatri,’ as influenced by fertilizer management practices. Methane emission peaked from 100 to 125 days after transplanting followed by a decline in rainfed lowland field plots. Application of prilled urea did not enhance methane emission significantly over that of the untreated control. Subsurface application of urea supergranules was, however, effective in reducing the methane flux over that of the control. Methane emission was lowest in plots treated with the mixture of prilled urea and Nimin (a nitrification inhibitor). Under irrigated shallow conditions, the application of prilled urea and green manure (Sesbania rostrata), singly and in combination, significantly increased methane emission over that of the control. Cumulative methane efflux from control and prilled urea treated lowland rice field was about 4–10 times higher than that in irrigated shallow fields. These results suggest that by virtue of their readily mineralizable carbon and ninhydrin reactive nitrogen, these substrates can serve as positive indicators of methane emission potential of rice fields. ©1999 Elsevier Science B.V. All rights reserved.
Keywords: Methane emission; Oryza sativa; Water regime; Fertilizers; Green manure; Mitigation; India
1. Introduction
Flooded rice fields serve as an important source of atmospheric methane, a greenhouse gas implicated in global warming. There is considerable research world-wide on developing farmer-friendly, eco-friendly and
∗Corresponding author. Present address: Max-Planck-Institut für Terrestrische Mikrobiologie, Karl-von-Frisch-Str., D-35043 Mar-burg, Germany. Tel.: +49-6421-178-832; fax: +49-6421-178-809 E-mail address: [email protected]
(B. Ramakrishnan)
cost-effective technologies to mitigate methane emis-sion from rice fields. Water management is often considered a good strategy to mitigate methane emis-sion from rice fields (Mishra et al., 1997). A single mid-season drainage retarded seasonal methane emis-sion from irrigated rice fields by about 50% (Kimura, 1992). However, in certain situations as in rainfed lowland rice fields of eastern and northeastern India, drainage of water from rice fields is virtually impos-sible because of high water tables. Under these situa-tions, mitigation strategies need to be specific to the location. Promising options in such situations can
include selection and breeding of high yielding rice cultivars with low methane emission potential. In this regard, cultivars with low methane emission from rice fields have been identified especially for irrigated shallow conditions (Adhya et al., 1994; Lindau et al., 1995; Satpathy et al., 1998).
Another option is to regulate the status of soil fer-tility through fertilizer management. Application of sulphate-containing fertilizers reduces emission from flooded rice soils (Adhya et al., 1998). In contrast, incorporation of organic sources, for instance green manure and rice straw in rice soils stimulates methane emission (Denier van der Gon and Neue, 1995). Like-wise, urea, a commonly used nitrogenous fertilizer in Asian countries can increase methane emission from rice fields. Studies have shown that urea ap-plied to puddled lowland rice fields is prone to high gaseous losses, particularly by ammonia volatiliza-tion (Mikkelsen et al., 1978) and denitrificavolatiliza-tion to the volatile forms, N2O and N2. There is evidence that ni-trification inhibitors can increase the N-use efficiency in lowland rice (Prasad and Power, 1995). Besides, nitrification inhibitors can repress N2O emissions es-pecially from upland soils (Cribbs and Mills, 1979; Bhadrachalam et al., 1992) and methane emission from flooded soils (Bronson and Mosier, 1991). The present investigation deals with the influence of dif-ferent fertilizers on methane emission from two sites (planted to a common cultivar).
2. Materials and methods
2.1. Field procedures
The effect of fertilizer management on methane emission from rice fields was examined at two sites in the experimental farm of Central Rice Research Institute, Cuttack (20◦25′N, 85◦55′E) during the wet season (June–November) of 1996. One site repre-sented a typical rainfed lowland rice field with water depth up to 30 cm and the other site represented an irrigated shallow rice field with a water depth of 4–6 cm. Rice has been grown in these plots under the respective water regimes for the past 50 years. The field site preparation and the experimental details were basically the same as reported by Adhya et al.
Table 1
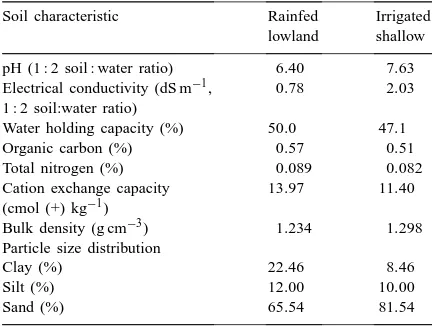
Characteristics of soil samples from the experimental sites
Soil characteristic Rainfed Irrigated lowland shallow
pH (1 : 2 soil : water ratio) 6.40 7.63 Electrical conductivity (dS m−1, 0.78 2.03
1 : 2 soil:water ratio)
Water holding capacity (%) 50.0 47.1 Organic carbon (%) 0.57 0.51
Total nitrogen (%) 0.089 0.082
Cation exchange capacity 13.97 11.40 (cmol (+) kg−1)
(1994). Table 1 presents the physico-chemical prop-erties of the soil at both sites. The field was flooded, ploughed, puddled thoroughly to 15 cm depth and levelled. Rice plants (25-day old seedlings of cv. ‘Gayatri’) were transplanted in early July, 1996 at a spacing of 20 cm×10 cm in field plots (8 m×6 m), well separated by levees. Incessant rains from the second week of June to the last week of August are typical of the monsoon season at Cuttack. Rainfall during June–November was 685 mm and the tempera-ture varied between 34.2◦C and 25.3◦C. In the rainfed lowland field plots, there was no provision for natu-ral surface drainage. Water percolation rate was also negligible because of a high water table especially in the wet season and except during April–May the soil at this site continued to be moist.
In the second experiment under irrigated shallow rice field conditions, the floodwater depth was main-tained at 4–6 cm by irrigation throughout the growing season. Prilled urea, green manure (Sesbania rostrata) and prilled urea in combination with green manure were applied to provide 60 kg N ha−1. Prilled urea was broadcast just before transplanting as done in the earlier experiment. Green manure, Sesbania rostrata plants were grown in the field plots during the second week of May to the first week of July, 1996. A week before transplanting rice, Sesbania plants were up-rooted and cut into 5–10 cm pieces and incorporated into the soil. In the treatment receiving green manure alone, manure was applied to provide 60 kg N ha−1 (dry weight basis). In treatments receiving prilled urea + green manure, the required quantity of green manure to provide 30 kg N ha−1was first incorporated in the soil seven days before transplanting and prilled urea at 30 kg N ha−1 was then applied on the day of transplanting to provide a total of 60 kg N ha−1. In both experiments, all fertilizers were applied as basal. Both the experiments were conducted in a randomized block design with five replicates for each treatment in plots of 8 m×6 m.
2.2. Methane flux measurements
Methane emission from flooded rice fields was mon-itored using the static chamber technique as described by Adhya et al. (1994) and Parashar et al. (1996). The assembly consisted of permanently installed alu-minium bases (30 cm×50 cm) with a U-shaped chan-nels to hold perspex boxes (30 cm×50 cm×76 cm) and water to provide air-tight conditions. At each sam-pling, perspex boxes were placed in the channel over the rice canopy and sealed air-tight to determine the linear rate of methane increase. A battery-operated air circulation pump (AeroVironment, Monrovia, CA, USA) with a flow rate of 1.5 l min−1, connected with polyethylene tubes via a three-way stopcock, mixed the air inside the chamber. The headspace gas of the chamber was collected in gas sampling bags (Tedlar® DuPont, AeroVironment) at intervals of 0, 15, and 30 min for each treatment. Immediately after sam-pling, the concentration of methane was analysed in a Varian 3600 gas chromatograph as described earlier (Ramakrishnan et al., 1995). The minimum detectable
limit was approximately 0.5mg in a 1 ml gas sam-ple. Gas chromatograph was calibrated periodically using 1ml CH4l−1 in N2, obtained from M/s Math-esons, USA as primary standard and 1.94, 2.60, 4.40 and 10.9ml CH4l−1 in N2 as secondary standards, prepared from 0.05% methane in argon by static di-lution technique. Samplings were done twice a day (9.00–9.30 a.m. and 3.00–3.30 p.m.) at specific plant growth stages. Floodwater depth, soil and water tem-perature, plant height and volume, chamber tempera-ture and headspace height were recorded at each gas collection time. Methane flux was calculated from the temporal increase of the methane concentration inside the box using the equation of Parashar et al. (1996) and the average of morning and evening fluxes was consid-ered as the flux value for the day. Cumulative methane emission for the entire growth period was computed by plotting the methane efflux values against the days of sampling and the area covered under the plot of such relationship was expressed as g m−2.
2.3. Methane production measurements
In another experiment, air-dried soil samples (5 g) from the irrigated shallow rice experimental field plots were placed in 18 ml glass tubes which were closed with a rubber septum to allow gas sampling from the head space. Flooding of the soil samples was done with different amounts of sterile water to provide varying water levels (i.e. 5, 8, 10.5, 14, 17 and 20 mm above the soil surface). The tubes were incubated at 37◦C and periodic gas sampling was done from the head space after releasing the trapped methane from soils by shaking the contents of tubes thoroughly for 1 min. Replicate soil tubes (5) of each treatment were sacri-ficed at each sampling. Methane determinations were made by flame ionization detection gas chromatogra-phy (Ramakrishnan et al., 1995) and the concentra-tions were represented as ng CH4g−1of dry soil.
2.4. Chemical analyses
Table 2
Methane efflux from rainfed lowland rice fields plots planted to cv. Gayatri, as influenced by fertilizer management
Treatment Methane efflux∗(mg m−2h−1)
Days after transplanting (DAT)
30 50 70 85 100 110 125 130 140
Control 8.3a 21.0a 39.9a 90.7a 62.8a 75.1a 102.9a 58.7a 8.2a Prilled urea 5.7a 13.1a 26.8a 67.2ab 71.6a 85.2a 94.3a 28.5b 7.8a Prilled urea + Nimin 5.2a 17.7a 27.1a 48.0c 51.0b 64.8b 77.2b 21.7b 7.4a Urea supergranule 6.1a 13.2a 30.7a 58.4c 57.6b 74.3a 90.2a 56.2a 12.3a
∗Mean of four replicate observations. In a column, means followed by a common letter are not significantly different at the 5% level by DMRT.
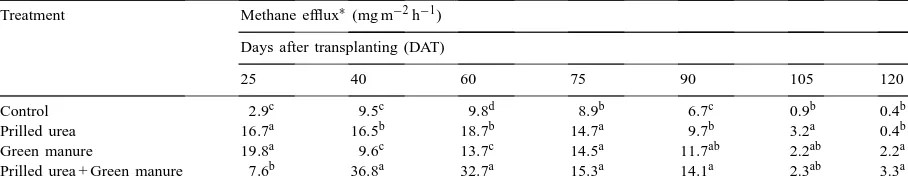
Table 3
Effect of fertilizer management practices on methane efflux from irrigated shallow rice field plots planted to cv. Gayatri
Treatment Methane efflux∗(mg m−2h−1)
Days after transplanting (DAT)
25 40 60 75 90 105 120
Control 2.9c 9.5c 9.8d 8.9b 6.7c 0.9b 0.4b
Prilled urea 16.7a 16.5b 18.7b 14.7a 9.7b 3.2a 0.4b
Green manure 19.8a 9.6c 13.7c 14.5a 11.7ab 2.2ab 2.2a
Prilled urea + Green manure 7.6b 36.8a 32.7a 15.3a 14.1a 2.3ab 3.3a
∗Mean of four replicate observations. In a column, means followed by a common letter are not significantly different at the 5% level by DMRT.
content was determined in 10 g portions by gravimet-ric analysis.
Ninhydrin reactive nitrogen (NRN) and readily min-eralizable carbon (RMC) content in further 10 g sub-samples were extracted with 0.5 M K2SO4. NRN con-tent in soil samples was estimated colorimetrically af-ter mixing the soil extract (1 ml) with ninhydrin solu-tion (5 ml) and incubating the mixture in a hot water bath for 7.5 min (Budalucco et al., 1992). The RMC content in soil samples was estimated by digesting the soil extracts with dichromate and then, titrating against 0.25 N FeSO4 using diphenylamine indicator (Vance et al., 1987). The soil redox potentials in the experimental sites were monitored at 5 cm depth with a portable oxidation-reduction potential meter (Bar-nant Company, IL, USA) periodically. Using wet soil samples, the soil pH was determined in a digital pH meter.
2.5. Measurement of plant biomass
Aerial biomass (fresh and dry weight) of plants was measured by harvesting the above ground portions on
each day of sampling for methane efflux. Grains and straw from the individual plots were harvested sepa-rately and dried to determine the biomass.
2.6. Statistical analysis
Data were analysed by the standard statistical meth-ods using IRRISTAT (version 3/93, International Rice Research Institute, Los Banos, 1993). The significance of the differences between treatments was assessed by ANOVA and subsequently by Duncan’s multiple range test (DMRT).
3. Results and discussion
3.1. Methane emission from rainfed lowland rice
Table 4
Plant biomass production and the cumulative methane efflux from shallow irrigated and rainfed lowland rice fields planted to cv. Gayatri
Treatment Plant biomass production (t ha−1) Cumulative methane emission (g m−2)
Straw yield Grain yield
Rainfed lowland field plots
Control 8.38 5.04 347.5
Prilled urea 8.48 5.52 307.5
Prilled urea + Nimin 10.07 5.48 255.0
Urea supergranule 10.97 6.22 295.0
Irrigated shallow field plots
Control 5.87 4.10 38.8
Prilled urea 7.37 4.90 73.8
Green manure 8.51 5.60 70.0
Prilled urea + Green manure 8.19 5.80 116.3
2). The subsurface application of urea supergranules was marginally effective in reducing the methane flux over that in control, especially during 85–100 days after transplanting. Interestingly, emission of methane was the lowest in plots treated with the mixture of prilled urea and Nimin, a nitrification inhibitor which inhibits the autotrophic oxidation of NH4+to NO2− (Sahrawat and Parmar, 1975). Nitrification inhibitors are also known to inhibit methane oxidation (Bronson and Mosier, 1994). Lindau et al. (1993) reported that some nitrification inhibitors can mitigate methane emissions from rice fields. In a microplot study with dry-seeded flooded rice, application of nitrification inhibitors, nitrapyrin and wax-coated calcium car-bide in particular, retarded methane emission signif-icantly (Keerthisinghe et al., 1993). The decrease in methane emission in plots treated with wax-coated calcium carbide was attributed to a direct result of the slow release of acetylene, a known inhibitor of methanogenesis (Bronson and Mosier, 1991). The mechanism of inhibitory action of Nimin on methane emission as seen in the present study is not known. These results suggest that the influence of urea on methane emission is dependent on the form and more importantly on its application, with or without nitri-fication inhibitors. A number of studies have demon-strated the strong effects of nitrogenous fertilizers on methane efflux from rice paddies (Wang et al., 1992; Lindau et al., 1993; Minami, 1995) although the interrelationship between the fertilizer nitrogen and methane emission from rice fields needs further research.
3.2. Methane emission from irrigated shallow rice
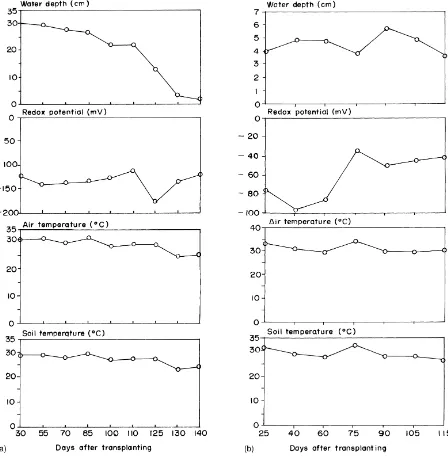
Fig. 1. Variation in floodwater depth (cm), redox potential (mV) of flooded soil, ambient temperature and soil surface temperature of (a) rainfed lowland and (b) irrigated shallow rice experimental sites.
The experiments here were planted to the same cul-tivar. Among the physico-chemical properties of the soil samples from both sites, appreciable differences existed with regard to pH and electrical conductiv-ity, and the contents of clay, sand and silt (Table 1).
Increased methane emission from rainfed lowland rice fields could be attributed to continuous deep submer-gence for a prolonged period (70 days) in comparison with shallow irrigation (Fig. 1a, b). However, methane efflux in rainfed lowland rice fields, from 130 to 140 days after transplanting, decreased with decreasing water depth (Table 2). The data presented in Fig. 1(a, b) also show a more rapid drop in redox potential un-der rainfed lowland conditions than in irrigated shal-low rice fields. Rapid drop in soil redox potential would be congenial for methanogenic activities (Wang et al., 1993). Moreover, rainfed lowland field plots pro-duced more plant biomass than that in irrigated shal-low fields (Table 4). The growth and biomass produc-tivity of rice cultivars are known to differ in ecosys-tems with varying water regimes (Muralidharan et al., 1996). In the present study, methane emission from the two sites appeared to be positively related to the plant biomass of the cultivar. A positive relationship between plant biomass and methane emission appears logical because about 80–90% of methane emitted to the atmosphere from flooded rice fields is transported through rice plants (Cicerone and Shetter, 1981). In rainfed lowland plots, maturity duration of cv. Gayatri was about 20 days more than with shallow irrigation and the prolonged vegetative period could lead to a significant increase in cumulative methane emission.
3.3. Methane production in alluvial soil as influenced by water levels
In order to understand the influence of floodwa-ter level on methanogenesis, methane production was measured in terms of the increase in the concentration of methane in the head space of the tubes containing soil samples, experimentally flooded with sterile wa-ter to provide different wawa-ter levels above the soil sur-face (Table 5). During the initial 20 days of incuba-tion, there was no appreciable increase in the concen-trations of methane among treatments. However, after 20 days, methane production from soil samples was distinctly enhanced with the increase in water level. Flooding of soil results in a low rate of oxygen diffu-sion and anaerobiosis occurs, in a thermodynamic se-quence (Ponnamperuma, 1972). Soil samples in tubes with a head space that contained oxygen and flooded with water, as in the present experiment, established anaerobiosis depending on the diffusion and
consump-tion of oxygen. Distinct stimulaconsump-tion of methane pro-duction in soil samples with increased water level sug-gests that the development of anaerobic conditions was rapid and favourable to methanogenesis.
3.4. Availability of C and N substrates
Under rainfed lowland conditions, the ninhydrin re-active nitrogen (NRN) content was the lowest in plots treated with the mixture of prilled urea and Nimin (Ta-ble 6). Subsurface application of urea supergranules also reduced the level of NRN. These changes of NRN content in field plots could be related to the rates of methane emission. The higher the content of NRN in soil, the higher was the methane emission rate.
Similarly, a positive relationship between the NRN content and the rate of methane emission from the shallow irrigated field plots was observed. The con-tents of NRN were more in organic and inorganic N fertilizer treated plots (Table 7 ). Likewise, the carbon content of soil samples, measured as readily miner-alizable carbon, also showed a variable trend. In the rainfed lowland rice field plots, the readily mineraliz-able carbon (RMC) content peaked during 110 days after transplanting (Table 6); the amount of methane emitted could be related to the RMC content of soil samples. In irrigated shallow rice fields, RMC content was highest in plots treated with prilled urea in com-bination with green manure and lowest in untreated control the (Table 7). Yagi and Minami (1990) also re-ported that the available carbon content, measured in terms of RMC, influences methane efflux from flooded soils.
4. Conclusions
Table 5
Methane production in soil samples, experimentally flooded to provide different water levels
Water level (mm) ng of methane produced g−1 soil∗
Days of incubation
5 10 15 20 25 30 35 40
5.0 4.5a 31.7a 77.3a 235.1a 2381.3e 11 076.7f 15 033.7f 21 345.2f 8.0 4.9a 40.7a 113.0a 365.4a 4110.5d 19 809.1e 21 973.4e 25 179.7e 10.5 5.8a 32.9a 170.4a 496.2a 5849.3c 23 978.5d 26 464.6d 29 488.1d 14.0 10.8a 23.8a 221.3a 546.7a 6544.5bc 26 517.6c 29 681.1c 36 814.2c 17.0 4.0a 46.0a 283.9a 611.1a 7277.1ab 30 733.2b 33 708.7b 40 242.3b 20.0 4.0a 44.1a 311.0a 1108.3a 8034.2a 32 352.4a 37 489.3a 43 537.5a
∗Mean of five replicate observations. In a column, means followed by a common letter are not significantly different at the 5% level by DMRT.
Table 6
Changes in ninhydrin reactive nitrogen (NRN) (mg g−1 soil) and readily mineralizable carbon (RMC) (mg g−1 soil) content of rainfed lowland rice field plots planted to cv. Gayatri∗
Treatment Days after transplanting (DAT)
50 100 140
NRN RMC NRN RMC NRN RMC
Control 9.1a 144.4a 11.5a 113.6b 7.6ab 115.1a
Prilled urea 10.8a 176.1a 11.0a 153.7a 9.5ab 91.1bc
Prilled urea + Nimin 8.1a 144.3ab 9.3a 156.2a 11.2a 101.4ab
Urea supergranule 10.6a 148.7ab 11.3a 172.0a 5.8b 75.6c
∗Mean of three replicates. In a column, means followed by a common letter are not significantly different at the 5% level by DMRT. Table 7
Effect of fertilizer management practices on ninhydrin reactive nitrogen (NRN) (mg g−1 soil) and readily mineralizable carbon (RMC) (mg g−1 soil) content of irrigated shallow rice field plots planted to cv. Gayatri∗
Treatment Days after transplanting (DAT)
40 90 120
NRN RMC NRN RMC NRN RMC
Control 19.0c 124.7b 6.2a 118.5b 12.8b 45.6c
Prilled urea 22.5bc 213.4a 13.4a 148.3ab 19.9a 88.5b
Green manure 29.6ab 130.9b 9.8ab 166.4a 7.2c 107.5b
Prilled urea + Green manure 32.7a 172.3a 8.9ab 174.2a 14.7ab 157.2a
∗Mean of three replicates. In a column, means followed by a common letter are not significantly different at the 5% level by DMRT.
opens up the possibilities of developing suitable man-agement schedules for regulating methane emission from flooded rice paddies.
Acknowledgements
The authors thank Dr. K.C. Mathur (Director) for permission to publish this work, the Indian Council of Agricultural Research, New Delhi for funding this
project and the Council of Scientific and Industrial Research, New Delhi for a research fellowship grant to Mr. Arun Kumar Rath.
References
Adhya, T.K., Patnaik, P., Satpathy, S.N., Kumaraswamy, S., Sethunathan, N., 1998. Influence of phosphorus application on methane emission and production in flooded paddy soils. Soil Biol. Biochem. 30, 177–181.
Bhadrachalam, A., Chakravorti, S.P., Banerjee, N.K., Mohanty, S.K., Mosier, A.R., 1992. Denitrification in intermittently flooded rice fields and N-gas transport through rice plants. Ecol. Bull. 42, 183–187.
Bronson, K.F., Mosier, A.R., 1991. Effect of encapsulated calcium carbide on dinitrogen, nitrous oxide, methane and carbon dioxide emissions from flooded rice. Biol. Fertil. Soils 11, 116– 120.
Bronson, K.F., Mosier, A.R., 1994. Suppression of methane oxidation in aerobic soil by nitrogen fertilizers, nitrification inhibitors and urease inhibitors. Biol. Fertil. Soils 17, 263–268. Budalucco, L., Gelsomino, A., Orco, S.D., Grego, S., Nannipieri, P., 1992. Biochemical characterization of soil organic compounds extracted by 0.5 M K2SO4 before and after
chloroform fumigation. Soil Biol. Biochem. 24, 569–578. Cicerone, R.J., Shetter, J.D., 1981. Sources of atmospheric methane
: Measurements in rice paddies and a discussion. J. Geophys. Res. 86, 7203–7209.
Cribbs, W.H., Mills, H.A., 1979. Influence of nitrapyrin on the evolution of N2O from organic medium with and without plants.
Commun. Soil Sci. Plant Anal. 10, 785–794.
Denier van der Gon, H.A.C., Neue, H.U., 1995. Influence of organic matter incorporation on the methane emission from a wetland rice field. Global Biogeochem. Cycles 9, 11–22. Keerthisinghe, D.G., Freney, J.R., Mosier, A.R., 1993. Effect of
wax-coated calcium carbide and nitrapyrin on nitrogen loss and methane emission from dry-seeded flooded rice. Biol. Fertil. Soils 16, 71–75.
Kimura, M., 1992. Methane emission from paddy soils in Japan and Thailand. In: Batjes, N.H., Bridges, E.M. (Eds.), World inventory of soil emission potentials. WISE report 2, International Soil Reference and Information Centre, Wageningen, pp. 43–79.
Lindau, C.W., Bollich, P.K., DeLaune, R.D., 1995. Effect of rice variety on methane emission from Louisiana rice. Agric. Ecosyst. Environ. 54, 109–114.
Lindau, C.W., Bollich, P.K., DeLaune, R.D., Mosier, A.R., Bronson, K.F., 1993. Methane mitigation in flooded Louisiana rice fields. Biol. Fertil. Soils 15, 174–178.
Mikkelsen, D.S., De Datta, S.K., Obamea, W.N., 1978. Ammonia volatilization losses from flooded rice soils. Soil Sci. Soc. Am. J. 42, 725–730.
Minami, K., 1995. The effect of nitrogen fertilizer use and other practices on methane emission from flooded rice. Fert. Res. 40, 71–84.
Mishra, S., Rath, A.K., Adhya, T.K., Rao, V.R., Sethunathan, N., 1997. Effect of continuous and alternate water regimes on
methane efflux from rice under greenhouse conditions. Biol. Fertil. Soils 24, 399–405.
Muralidharan, K., Prasad, G.S.V., Rao, C.S., 1996. Breeding for rice improvement: Where do we stand. Curr. Sci. 71, 438–448. Neue, H.U., Roger, P.A., 1993. Rice agriculture: Factors controlling emissions. In: Khalil, M.A.K. (Ed.), The Global Cycle of Methane: Source, Sinks, Distribution and Role In Global Change. NATO Advanced Science Series, Springer, Berlin, pp. 254–298.
Parashar, D.C., Mitra, A.P., Gupta, P.K., Rai, J., Sharma, R.C., Singh, N., Koul, S., Ray, H.S., Das, S.N., Parida, K.M., Rao, S.B., Kanungo, S.P., Ramasami, T., Nair, B.U., Swamy, M., Singh, G., Gupta, S.K., Singh, A.R., Saikia, B.K., Barua, A.K.S., Pathak, M.G., Iyer, C.S.P., Gopalakrishnan, M., Sane, P.V., Singh, S.N., Banerjee, R., Sethunathan, N., Adhya, T.K., Rao, V.R., Palit, P., Saha, A.K., Purkait, N.N., Chaturvedi, G.S., Sen, S.P., Sen, M., Sarkar, B., Banik, A., Subbaraya, B.H., Lal, S., Venkatramani, S., Lal, G., Chaudhary, A., Sinha, S.K., 1996. Methane budget from paddy fields in India. Chemosphere 33, 737–757.
Ponnamperuma, F.N., 1972. The chemistry of submerged soils. Adv. Agron. 24, 29–96.
Prasad, R., Power, J.F., 1995. Nitrification inhibitors for agriculture, health and environment. Adv. Agron. 54, 233–281.
Ramakrishnan, B., Satpathy, S.N., Patnaik, P., Adhya, T.K., Rao, V.R., Sethunathan, N., 1995. Methane production in two Indian rice soils. Geomicrobiol. J. 13, 193–199.
Sahrawat, K.L., Parmar, B.S., 1975. Alcohol extract of neem (Azadirachta indica L.) seed as nitrification inhibitor. J. Indian Soc. Soil Sci. 23, 131–134.
Sass, R.L., Fisher, F.M., Harcombe, P.A., Turner, F.T., 1990. Methane production and emission in a Texas rice field. Global Biogeochem. Cycles 4, 47–68.
Satpathy, S.N., Mishra, S., Adhya, T.K., Ramakrishnan, B., Rao, V.R., Sethunathan, N., 1998. Cultivar variation in methane efflux from tropical rice. Plant Soil 202, 223–229.
Sinha, S.K., 1995. Global methane emission from rice paddies: Excellent methodology but poor extrapolation. Curr. Sci. 68, 643–646.
Vance, E.D., Brookes, P.C., Jenkinson, D.S., 1987. An extraction method for measuring microbial biomass C. Soil Biol. Biochem. 19, 703–707.
Wang, Z.P., DeLaune, R.D., Lindau, C.W., Patrick Jr., W.H., 1992. Methane production from anaerobic soil amended with rice straw and nitrogen fertilizers. Fert. Res. 33, 115–121. Wang, Z.P., DeLaune, R.D., Masscheleyn, P.H., Patrick Jr., W.H.,
1993. Soil redox and pH effects on methane production in a flooded rice soil. Soil Sci. Soc. Am. J. 57, 382–385. Yagi, K., Minami, K., 1990. Effect of organic matter application