251 (2000) 239–263
www.elsevier.nl / locate / jembe
A new method to estimate respiration rate of biological
material based on the reduction of tetrazolium violet
* ˚
Ulf Bamstedt
Department of Fisheries and Marine Biology, University of Bergen, P.O. Box 780, N-5020 Bergen,
Norway
Received 7 December 1999; received in revised form 20 February 2000; accepted 3 May 2000
Abstract
The traditional method for measuring the activity of the electron-transport system (ETS) gives an estimate of the potential respiration rate, since it measures the rate under saturated substrate conditions (Vmax). Accumulated literature data indicate that this does not relate closely to the actual respiration rate. The new method described here is based on reduction of tetrazolium violet in a homogenate with a natural level of substrates. The analytical protocol ensures that the spectro-photometric reading after 1 h incubation at 408C reflects the ambient amount of substrates available. This method is superior to the traditional ETS assay in giving a closer correlation with ambient respiration rate. A number of methodological tests have been performed and recom-mendations are given to optimize the measurements. Macrozooplankton species from the coastal waters of Sweden, representing different taxonomic and trophic groups, showed a range in respiration / ETS ratio from 1.1 to 2.9, and both inter- and intra-specific variability in this ratio were reduced by 50–70% compared with the traditional ETS assay. Results from other environments and for particulate organic matter indicate a similar general improvement. The new analytical assay is simple, cheap and well suited for fieldwork. 2000 Elsevier Science B.V. All rights reserved.
Keywords: Respiration; Tetrazolium violet; Enzymatic reduction
1. Introduction
Biologists have long been using the in vitro enzymatic reduction of INT (tetrazolium violet, 2-( p-iodophenyl)-3-( p-nitrophenyl)-5-phenyl tetrazolium chloride) to estimate
*Tel.: 147-55-58-4400; fax:147-55-58-4450.
˚ E-mail address: [email protected] (U. Bamstedt).
respiration rates of aquatic organisms in diverse environments (e.g., Packard, 1971; ˚
Kenner and Ahmed, 1975; King and Packard, 1975; Bamstedt, 1979, 1980; Martinez, 1991, 1992, 1997; Martinez and Estrada, 1992; Hernandez-Leon and Gomez, 1996; Ikeda, 1996; Madon et al., 1998). The modified method (Owens and King, 1975) gives an estimate of the potential respiration rate, because the analytical protocol includes saturation conditions in substrate level (NADH, NADPH) which makes the reactions
work at the maximum rate (Vmax). This means that the amount of available enzymes will
be the rate-limiting step in the electron transport and the result will then be a reflection of the enzyme level in the sample. However, it is unlikely that this is the major regulating factor in response to short-term changes in energy expenditure. A general conversion factor from ETS activity to respiration rate of 0.5 was suggested by Packard et al. (1974) based on empirical results. The rather weak theoretical basis for this constant is that organisms would respire at around 50% of their capacity in normal situations (Packard, 1985). However, in vivo ETS activity is more likely controlled through typical enzyme kinetics, according to a Michaelis–Menten function, where the rate is regulated by the present substrate level. This, in turn, implies that the ratio between respiration rate and ETS activity (R / ETS) will vary with the physiological activity of the organism. The rather wide R / ETS ratios reported in the literature support
˚
this explanation (see, e.g., Bamstedt, 1979; Hernandez-Leon and Gomez, 1996, for zooplankton), although other sources of variability are certainly possible. By excluding the addition of substrates used in the original method, the measured reduction of INT will be a result of the naturally occurring amounts of enzymes and substrates in the homogenate. Without the intact cell system that can regenerate the substrate there will be an exponential decrease of the substrate level, causing a gradual decrease in the rate of reduction of INT as described by a Michaelis–Menten function. Theoretically, the initial rate of reduction should give the actual ETS activity but, in practice, this is very difficult to measure, since substrate is being used up immediately when homogenisation starts, and a considerable time is needed before a spectrophotometric reading can be taken. The alternative is to continue the reaction until total consumption of the substrates has taken place. The spectrophotometric reading would then give a result that should be directly related to the total amount of substrates available during the incubation. Since the total amount of substrates available will be the controlling factor for the initial activity of the ETS (as defined by the Michaelis–Menten equation), the result should be a good index of the respiration rate. In the present paper, I report on methodological tests of such a method and compare results for different marine invertebrates with this method, the original ETS activity method (as modified by Owens and King, 1975) and direct measurements of the respiration rate in incubation experiments.
2. Material and methods
2.1. Chemical reagents
1. ETS reagent. A buffer of 0.05 M Tris (Tris (hydroxymethyl) aminomethan) and 0.01
21
21 21
l Triton X-100 and 2 mg ml INT ( p-iodonitrotetrazolium violet) was adjusted to
pH 8.5 with HCl and stored frozen.
2. Dilution medium. The same as under point 1 but without INT.
3. Quench. A mixture of concentrated formaldehyde and 1 M phosphoric acid, 1:1 by volume.
4. Extraction medium. Chloroform / methanol, 2:1 by volume. 5. Methanol.
21
6. Reducing agent. Ascorbic acid, 70 mg ml dissolved in distilled water. Kept in a
refrigerator for up to 1 month and stored frozen for a longer period.
2.2. Analytical procedure
A number of modifications of the original analytical method (Owens and King, 1975) were adopted:
• No substrate added to the homogenate sample.
• Only one reagent is used, and the material is homogenised in this reagent.
• Incubation time and temperature are set to levels that ensure that the enzymatic
reduction of INT is close to complete.
• After stopping the reaction, the samples are mixed with chloroform / methanol (2:1 by
volume) in order to dissolve lipids from the material. This is important for lipid-storing organisms, since the reduced INT is dissolved and concentrated in any lipid droplets that are present. It also dissolves particle-bound dye and thereby represents a general improvement of the method.
• The extraction procedure can be used both to concentrate and dilute the samples,
thereby increasing the range of sample size (biomass analysed) considerably.
• A procedure for preparing a standard curve is defined, making it possible to test the
quality of each specific batch of ETS reagent prepared.
• Omitting the addition of substrates also saves the main costs of the analytical
procedure, since NADH and NADPH are very expensive components.
With a final reagent volume of 3 ml the amount of living biological material used should be between 3 and 30 mg, corresponding to 0.6–6 mg dry weight or 0.3–3 mg protein. By adjusting the final volume up or down this range can be expanded.
The material is homogenised in an appropriate volume of ETS reagent (usually 1–3
ml), transferred to a graduated centrifuge tube and incubated for 1 h at 408C. A blank of
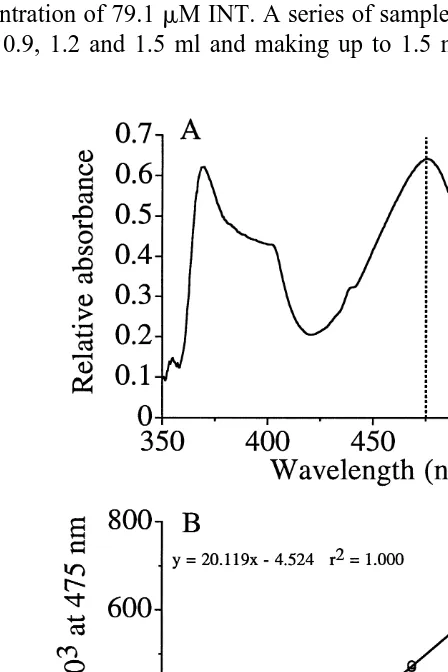
used here has a well defined peak at ca. 475 nm (Fig. 1A) and natural pigments from, for example, crustaceans do not seem to interfere.
2.2.1. Standardisation of the ETS reagent
It is recommended to perform a calibration procedure, described below, for each new batch of ETS reagent. As a control for the ETS reagent at each time of analysis it is recommended to use a duplicate standard sample with known concentration, treated as described below. If there is a significant change in absorbance, the ETS reagent should be discarded and a new one prepared.
One millilitre of ETS reagent is diluted to 50.0 ml with dilution medium. This then
has a concentration of 79.1mM INT. A series of samples is made up from this by taking
0, 0.3, 0.6, 0.9, 1.2 and 1.5 ml and making up to 1.5 ml with dilution medium. A few
drops of reducing agent are added and mixed and the samples are incubated at 408C for 10 min. The samples are added 0.3 ml quench and 1 ml chloroform / methanol and centrifuged for a few minutes at ca. 3000 rpm. The upper phase is discarded and the remaining made up to 3 ml with methanol. The samples will now contain the red formazan (reduced INT) with a concentration of 0, 7.91, 15.82, 23.73, 31.64 and 39.55
mM. The samples are read at 475 nm in a spectrophotometer and formazan concentration
is plotted against absorbance at 475 nm. A linear regression equation is calculated and used for the calculations of the subsequent biological samples. INT from Sigma (grade I, I 8377) gave a very close linear relationship (Fig. 1B) with a coefficient of de-termination of 0.9999. The equation used to convert from absorbance to formazan is
mM formazan549.704A47520.225
Since 1 mol of formazan corresponds to 1 mol of oxygen or 0.5 mol O (2 516 g O ) the2
formula for calculating the corresponding oxygen utilization from absorbance measure-ments is
ETS activity (mg O used)2 5163(49.704A47520.225)3V/ 100031 /L
5(0.795A47520.0036)3V/L
where A475is the absorbance of the sample, corrected for the blank absorbance, V is the
final reagent volume in ml, and L is the cell width of the cuvette used for the samples. This calculated value has no meaning without converting it to the actual respiration rate by using a ratio factor between respiration rate and ETS activity (R / ETS), i.e.
Respiration rate5ETS?(R / ETS)
The present paper gives some examples of R / ETS for different zooplankton organisms.
2.3. Test of the analytical procedures
2.3.1. Time schedule of biological reduction of INT
Freshly collected Praunus flexuosus (Mysidacea) and eggs of the lumpsucker
Cyclopterus lumpus (Teleostei) were used in this test. One homogenate with high and
one with low concentration was used for the mysid, whereas a single homogenate was prepared with the fish eggs. The homogenates were prepared as described above and
incubated at 408C. The reduction of INT was stopped by adding quench at different time
intervals between 0.1 and 270 min after the start. The following analytical steps were the same as described above and the samples were read in a spectrophotometer at 475 nm against a blank prepared without biological material.
2.3.2. Homogenate preparation
were then produced by a combination of 1INT /2INT during homogenisation and
21
supernatant / crude homogenate during incubation. ETS was expressed as mg O mg2
wet weight.
2.3.3. Incubation temperature
Homogenates were prepared according to the standard procedure (see above) using
temperatures between 10 and 508C in intervals of 108 both for preparation and
incubation. Three different biological materials were used: fresh mysids (Praunus
flexuosus); fresh soft tissue of the blue mussel (Mytilus edulis); formalin preserved P.
flexuosus. In addition, a blank without biological material was included.
2.3.4. Linearity and concentration and dilution of the analytical sample
Fresh mysids (Praunus flexuosus) were used in these experiments. The linearity when using various volumes of homogenate was tested by preparing a stock homogenate and withdrawing between 0.25 and 2.0 ml homogenate for further processing. Dilution medium (see above) was added to samples smaller than 2 ml, making the final volume 2.0 ml, and the standard procedure was followed (see above).
In order to test the possibility of diluting / concentrating the formazan produced in the analytical samples, a 25 ml homogenate of Praunus flexuosus was prepared and incubated according to the standard procedure (see above) and the reaction was stopped by adding 5 ml quench. From this was taken 2, 4, 6 and 8 ml samples to which was added 2.0 ml extraction medium. An additional 4 ml sample was added to 1.0 ml extraction medium. After mixing, centrifugation and discarding the upper phase, the volume was made up to 4.0 ml by methanol (2.0 ml for the additional 4 ml sample). In this way a concentration of up to four times the lowest concentration was obtained.
2.3.5. Storage of processed samples
ETS activity should be analysed on freshly collected material in order to obtain realistic measurements. Therefore, it might be a problem to perform all the analytical steps and the final spectrophotometric reading in field applications onboard a small boat. The effect of storing the analytical samples (incubated and quenched) at different temperatures (all in darkness) was therefore investigated using homogenate of freshly collected mysids (Praunus flexuosus). A batch homogenate was prepared, incubated and stopped, and thereafter divided into 30 subsamples. These were divided randomly into three series, which were stored frozen, refrigerated and at room temperature,
corre-sponding to 222,15 and1228C, respectively. One sample from each series was taken
out at different times, up to 103 days, and the samples prepared in the general way and read at 475 nm on a spectrophotometer.
2.3.6. Storage of live zooplankton
A mixture of zooplankton collected in September and dominated by copepods was
kept refrigerated at168C and subsamples were taken out regularly over a 3 day period
by dipping a small jar in the well mixed container. Each time, three subsamples were
taken and filtered through a 20mm plankton gauze and prepared as described for ETS
on three occasions, incubated for 4–21 h and analysed for oxygen content by Winkler titration.
2.3.7. Effects of changes in environmental variables
The mysid Praunus flexuosus was used in some manipulation experiments. Freshly
collected individuals were held at in situ temperature in June (148C), August (178C) and
September (138C) for 3 days before being analysed. In September, one group was also
held at 58C and another one at 168C for 3 days. All animals were first used for
respiration measurements, thereafter for ETS activity. Respiration measurements were made in small glass bottles with seawater with known oxygen content. Together with appropriate blanks these were sealed and incubated in the dark at predefined tempera-tures. Subsamples of water were taken by siphoning to a smaller bottle, letting water overflow with at least the volume of the bottle. The oxygen content was then determined by the Winkler technique or using a Clarke-type polarographic electrode. In a second series of experiments a range of combinations of feeding / starving, light / dark and different temperatures and acclimation periods were used (Table 1). The experimental mysids were given natural zooplankton and small pieces of mussel meat as food. After the treatment the animals were blotted on a paper towel, weighed and then analysed for ETS activity according to the standard procedure (see above).
2.3.8. Respiration and ETS activity of organisms from natural environments
Newly collected animals from different habitats were used. All were sampled with as little stress as possible using non-filtering cod-ends of nets and trawls and direct catching with a bucket from surface water. Results are presented for the mysid prawn Praunus
flexuosus and the decapod shrimp Palaemon adspersus living in the sublittoral. These
¨ ¨
were collected from the pier at Tjarno laboratory
Ten species of macrozooplankton from Kosterfjorden, western Sweden, were sorted
from gently sampled material taken in winter by a conical net, 200 mm mesh size,
equipped with a non-filtering cod-end. After sorting, animals were incubated for respiration measurements as described above. The incubation temperature was close to
the in situ temperature of 5–68C and incubation was performed in darkness. After
Table 1
Treatments of Praunus flexuosus used to study the effects of changes in environmental variables on ETS activity
respiration measurement the average individual wet weight was measured by blotting the collected material with a paper towel and weighing on a micro-balance. The ETS activity was then measured using both the new and the traditional method of Owens and
King (1975) using an incubation temperature of 218C for the latter method. A
conversion was made to the in situ temperature using the Arrhenius equation and a value
21
˚
for the energy of activation of 15 kcal mol (see Bamstedt, 1980).
ETS activity, using the new method, was also measured on macrozooplankton from the Barents Sea, collected during summer. Gentle collection with a conical net with a non-filtering cod-end was used. Single individuals of separate species were each placed
into a plastic capsule with 0.3 ml ETS reagent and frozen at 2228C. The material was
thawed in the laboratory after 3.5 months and the animals picked up with forceps. The animals were blotted on a paper towel and weighed (see procedure above) before being homogenised for ETS analysis. The weight of the animals might be negatively biased due to loss of water during freezing. This might apply particularly to the hydromedusa, which has the highest water content.
Finally, ETS activity was also measured on POM (particulate organic material) at different depths in Kosterfjorden, western Sweden. Duplicate water samples of 2 l volume were filtered through Whatman GF / C filters, one was used for POM, the other
one for ETS activity. POM was estimated as the weight loss from a dried (608C for 24 h)
to an ashed sample (5008C for 24 h). ETS activity was analysed according to the
standard procedure (see above).
3. Results
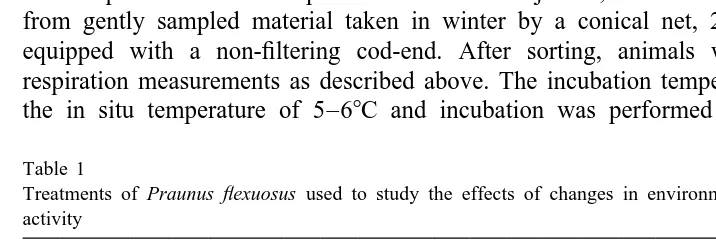
3.1. Incubation time (Fig. 2A)
The typical development of formazan in samples with biological material was well described by a hyperbolic function, indicating that the substrate was gradually used up. An example is given in Fig. 2A, where two different sizes of Praunus flexuosus and eggs of Cyclopterus lumpus were used. There was a slow but continuous increase also after 1 h incubation for large Praunus, whereas the small sample and the fish eggs showed only marginal changes with prolonged incubation. The standardised incubation time was set at 60 min.
3.2. Sample preparation (Fig. 2B)
The four different preparations of analytical samples showed rather high within-group
variability and an ANOVA did not reveal any significant treatment effects (P.0.05).
3.3. Incubation temperature (Fig. 2C)
The formazan production over 1 h incubation increased with temperature, as shown both for samples of Praunus flexuosus and samples of Mytilus edulis. The mussel
samples increased by a factor of 3.9 from 10 to 408C, whereas the mysid samples
increased by a factor of 2.5 with the same temperature increase. Since the amount of biological material was not standardised, this does not mean anything. A sample prepared from formalin-preserved Praunus did not show any increase with temperature,
and therefore did not differ from the blank without biological material (Fig. 2C). An
incubation temperature of 408C was chosen as the standard.
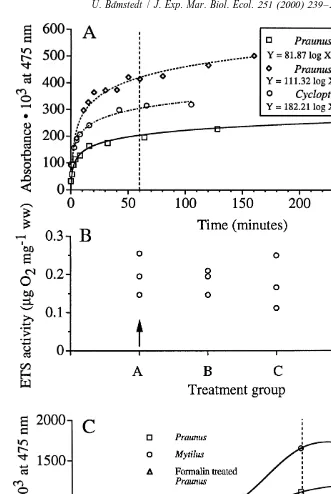
3.4. Importance of the amount of biological material in the sample (Fig. 3A)
In the test with different amounts of homogenised Praunus flexuosus there was no sign of non-linearity (Fig. 3A) and the high coefficient of determination indicated that formazan production was solely determined by the amount of biological material. The linearity in the relationship also makes it possible to adjust the concentration of
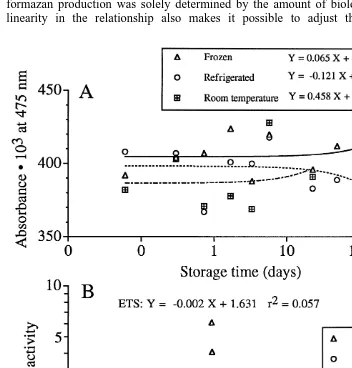
Fig. 4. (A) Effects of delayed photometric reading of the analytical samples stored at three different temperatures, approximately222 (frozen), 15 (refrigerated) and 1208C (room temperature). (B) Effects of storing live zooplankton before preparing the analytical samples. The ETS activity is expressed asmg O2
21 21 21
formazan to a suitable level in the spectrophotometric reading by adjusting the final volume after extraction. The results on concentrating the formazan up to four times were close to the theoretical value (Fig. 3B) and showed the suitability of the procedure. It is thus possible to increase the sensitivity of the method by concentrating the formazan in a small final volume and using micro cells in the spectrophotometer.
3.5. Storage of samples (Fig. 4A)
The three sets of processed samples of Praunus flexuosus (crude homogenate
incubated and quenched) did not show any significant trend with time (t-test, P.0.05 in
˚
Bamstedt
/
J.
Exp
.
Mar
.
Biol
.
Ecol
.
251
(2000
)
239
–
263
251
all cases). Frozen, refrigerated and 208C samples showed average absorbance values of
0.40460.009 (695% confidence interval), 0.39760.014, and 0.38960.019, respectively,
and the overlapping confidence intervals thus indicate no significant differences. Thus, once the samples have been quenched with the stop solution they can be stored for a long time even at room temperature in airtight tubes which prevent evaporation.
3.6. Effects of delayed sampling of material (Fig. 4B)
Samples over a 3-day period from the mixed zooplankton showed random variability in ETS over time, and the slight negative slope was not significant (t-test on the
correlation coefficient, P.0.05). The respiration rate measured on a few occasions
showed no clear trend with time and the variability was even higher than for ETS.
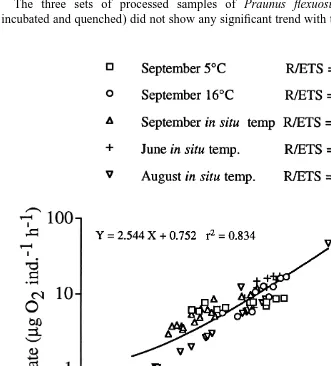
3.7. Effects of changes in environmental variables (Figs. 5 and 6)
The linear relationship between respiration rate and ETS activity of Praunus flexuosus was fairly close, explaining 83% of the variability in the total material (Fig. 5). Animals kept at a natural temperature showed significant differences between months, with lowest R / ETS ratios in August (2.31) and highest in September (4.53). A lowered or increased temperature in September gave a lower R / ETS ratio than at the in situ temperature, 3.39 and 2.53, respectively.
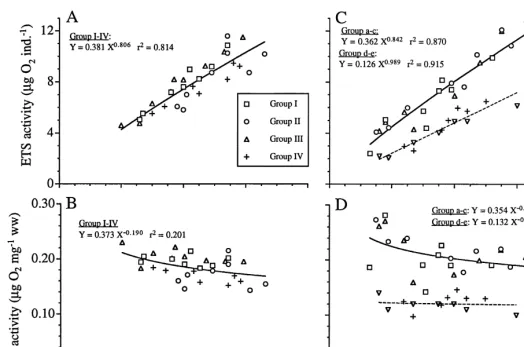
In the first set of experiments where temperature, food and light were manipulated (I–IV), the results for the groups did not diverge much (Fig. 6A,B) and 81% of the total variation in ETS was explained by its relation to body weight. The low temperature treatment showed the highest slope and lowest intercept and starving animals gave the lowest slope and highest intercept (Table 2). The second experimental series showed
considerably more variability (Fig. 6C,D), with the general regression equation Y5
0.842
0.296X explaining 60% of the total variability in the data. However, by dividing the
material into two subgroups (groups a–c and groups d and e, respectively) the two separate regression equations explained 87 and 92% of the total variation, respectively.
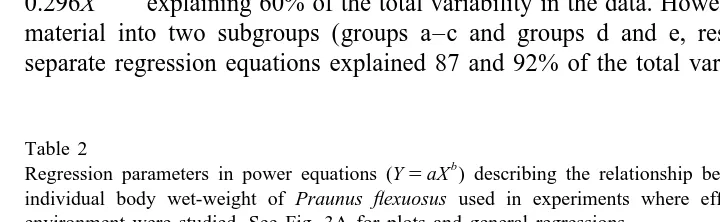
Table 2
b
Regression parameters in power equations (Y5aX ) describing the relationship between ETS activity and
individual body wet-weight of Praunus flexuosus used in experiments where effects of changes in the environment were studied. See Fig. 3A for plots and general regressions
2
Treatment group n a b r
These subgroups represented two different acclimation periods (Table 1). There were no consistent patterns of temperature effect within the two subgroups (Fig. 6, Table 2).
3.8. Respiration and ETS activity in natural populations (Figs. 7 –10)
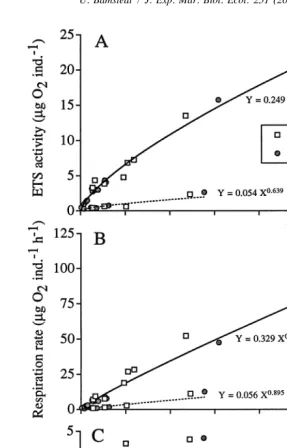
The two crustaceans Palaemon adspersus and Praunus flexuosus, showed variable results both in respiration rate and ETS activity (Fig. 7), but there was a clear separation
˚
Average respiration rate (mg O mg2 wet weight h ), ETS activity and R / ETS ratio of 10 macrozooplankton species. ETS and ETS are the new and old1 2
21 21 21
methods, respectively, with activity expressed asmg O mg2 wet weight andmg O mg2 wet weight h , respectively. CV, coefficient of variation5S.D. / mean3100%. In situ t indicates the calculated R / ETS with ETS converted to in situ activity using the Arrhenius equation2 2
Species n Wet weight (mg) Respiration rate ETS1 ETS2 R / ETS1 R / ETS2
Average CV Average CV Average CV Average CV Average CV Average In situ t CV
Boreomysis arctica 2 96.8 39.1 0.37 73.0 0.19 (n51) 0.66 37.9 2.93 (n51) 0.69 0.158 98.6
Meganyctiphanes
norvegica 8 160.6 59.2 0.27 30.0 0.25 28.4 1.06 34.7 1.09 28.9 0.26 0.052 35.4
Calanus finmarchicus 3 0.79 5.1 0.28 14.3 0.18 2.5 2.17 62.7 1.71 7.8 0.20 0.045 90.7
Chiridius armatus 1 2.7 0.40 0.21 1.69 1.91 0.24 0.055
Euchaeta norvegica 1 7.1 0.30 0.15 1.51 1.97 0.20 0.045
Metridia longa 3 1.4 10.8 0.37 6.8 0.18 16.7 2.62 7.6 2.12 11.3 0.14 0.032 13.3
Clione limacina 3 286.7 56.5 0.029 55.2 0.027 32.9 0.36 46.4 1.06 31.4 0.10 0.023 63.5
Pleurobrachia pileus 3 690.2 60.1 0.004 13.0 0.003 10.7 0.014 29.0 1.87 22.1 0.36 0.165 38.9
Sagitta elegans 2 23.5 4.2 0.057 29.8 0.047 20.2 0.64 34.4 1.29 47.6 0.10 0.023 60.0
Tomopteris helgolandica 1 83 0.049 0.035 1.02 1.39 0.05 0.011
Crustaceans (six species) 0.8–304 0.33 16.6 0.22 29.1 1.62 44.2 1.96 27.9 0.29 0.066 69.5 Semi-gelatinous
(three species) 23–456 0.045 32.0 0.035 34.0 0.67 49.1 1.25 13.5 0.08 0.018 35.6
Gelatinous (one species) 322–1140 0.005 0.003 0.014 1.87 0.36 0.082
into two groups, not defined by species. Thus, four individuals of Palaemon and six individuals of Praunus showed very low levels of respiration and ETS, but within-group relationships similar to the group with higher rates (cf. regression parameters in the two group equations, Fig. 7). Since the respiration rate and ETS activity varied synchronous-ly, the R / ETS ratio was rather stable, although there was also a diversification here (Fig. 7C). One group could be defined by a body weight smaller than 100 mg, and this
showed an average R / ETS ratio of 2.1360.05 (95% confidence interval, n529). The
other group consisted of larger animals with an average R / ETS ratio of 4.1360.36
(n510).
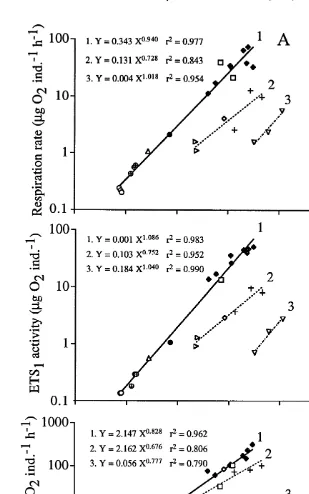
Ten species of macrozooplankton showed consistent patterns in respiration rate and ETS activity and when plotted against individual wet weight three subgroups, related to their water content, could be separated (Fig. 8). The crustacean group (with lowest water content) showed the highest activity level, the ctenophore group (with highest water content) the lowest activity level, and between 79 and 98% of the variation was explained by the regression equations. There were no strong differences in variability between the two ETS methods tested, although the new method gave consistently higher coefficients of determination (Fig. 8B,C). Furthermore, differences between individuals
were usually more similar between respiration rate and ETS than between respiration1
rate and ETS2 and the visual impression of the whole material indicated a closer
relationship between (A) and (B) than between (A) and (C) in Fig. 8. However, the ratios between respiration rate and ETS activity (R / ETS) were variable for both ETS methods and did not vary in synchrony, thus causing an increased variability in the
ETS / ETS ratio (Fig. 9). The species-specific activities and ratios are summarised in1 2
Table 3. Intraspecific variability was not very different for respiration rate and the two ETS methods. The new ETS method gave a range in CV of 3–52% with an average of 23%, whereas CV for respiration rate ranged between 7 and 73% with an average of 32% and CV for the old ETS method ranged between 8 and 63%, average 36%. However, the intraspecific variation in the ratio between respiration rate and ETS activity differed between the two methods, with CV using the new method showing a range of 8–48% with an average of 25% and corresponding values with the old method of 13–99%, average 57%. The multi-species groupings gave a similar impression of higher variability within groups for the old ETS method, 2.5 times higher for
Table 4
21
Average species-specific ETS activity (mg O mg2 wet weight) of Arctic macrozooplankton (see Fig. 10) and corresponding weight-specific respiration rate, calculated by applying appropriate R / ETS conversion factors1 from Table 3
Parameter Calanus C. glacialis C. glacialis C. glacialis Parathemisto Sagitta Bouganvillea
hyperboreus CV CIV CV ad. females libellula elegans sp.
N 4 5 7 5 1 6 2
Average ETS 0.109 0.218 0.211 0.167 0.126 0.092 0.057
S.D.ETS 0.027 0.023 0.112 0.028 0.064 0.001
Average
respiration 0.186 0.372 0.361 0.286 0.247 0.119 0.107
Fig. 11. Vertical profile of particulate organic matter (POM), ETS activity and specific ETS activity (mg O2
21
mg POM) in Kosterfjorden, Sweden.
crustaceans, 2.6 times higher for semi-gelatinous species and 2.5 times higher for the total material (10 species).
The Arctic zooplankton showed a curvilinear relationship of ETS activity with body weight (Fig. 10) with an exponent for the weight dependency of 0.61. By applying the
R / ETS ratios for Calanus finmarchicus, crustaceans, Sagitta elegans and Pleurobrach-1
ia pileus in Table 3 to Calanus spp., Parathemisto libellula, Sagitta elegans and Bouganvillea sp., respectively, the ETS activity can be converted into respiration rate
(Table 4). The calculated respiration rate showed a range for the crustacean species of
21 21
0.19–0.37mg O mg2 wet weight h , Sagitta elegans being lower, and the
weight-specific rate for the medusa being lowest (0.11mg O ).2
The vertical profiles of ETS and POM from Kosterfjorden showed a subsurface peak in both ETS and POM at 10 m (Fig. 11). Below 25 m, POM increased and ETS decreased slightly. The resulting ETS activity per mg POM showed a gradual decrease with depth over the full scale (Fig. 11).
4. Discussion
4.1. The theoretical basis for the new method
total production of formazan over a fixed incubation time, where the substrate is gradually used up. This is well explained by a hyperbolic function, asymptotically reaching the level where all substrate has been used. The shape of the curves describing
this (Fig. 2A) indicates that incubation for 1 h at 408C will produce formazan close to
this upper level. The initial slope of the curves will theoretically give the true ETS activity but, in practice, this is difficult to use, because of the rapid decelerating rate of formazan production. Even if such an approach was used, it is doubtful if it would give a closer relationship to in vivo ETS activity and respiration rate, since the analytical homogenate does not contain a system for renewal of enzymes and substrates like an intact animal. In the original ETS method, substrates are added in saturating con-centration and the amount of enzymes involved in ETS will then define the rate of formazan production. My results indicate that the present method is superior to that approach by giving a closer relationship with respiration rate. Since ETS activity is supposed to reflect the respiration rate, plots of respiration rate versus ETS activity should show a linear relationship, i.e. a given change in respiration rate should show up as a proportionally identical change in ETS. This does not seem to be the case in diverse systems and a power function is commonly used to describe the relationship. Aristegui and Montero (1995a) reported such relationships for 11 sets of data of particulate
material smaller than 225mm from a wide variety of ocean localities, showing a slope in
the regression of 0.24–1.16, average 0.81. Aristegui and Montero (1995b) gave a slope for Antarctic material of 0.73 and Giorgio (1992) gave a slope in the power function for plankton from a diverse selection of freshwater lakes of 0.48. Thus, ETS activity decreases in relative terms with increased respiration rate and behaves more as a body-mass component. The allometric relationship between body mass and metabolic
b
activity is commonly described by the power function Y5aX , where b is supposed to
be around 0.7 (Zeuten, 1953; Hemmingsen, 1960), and the ETS activity therefore seems to reflect biomass more than bioactivity. The strong correlation between respiration rate and ETS activity does not obliterate this, since every body-mass related parameter would correlate closely.
Most literature data referred to here represent measurements on particulate matter that was concentrated on a filter and either inactivated by freezing in liquid nitrogen or analysed immediately. Previous studies have shown that the ETS activity responds much
˚
slower to changes in the environment than the respiration rate (cf. Bamstedt, 1980; Skjoldal et al., 1984; Mayzaud, 1986). This is logical when the ETS activity is measured
under saturated substrate conditions (Vmax), since the changes in ETS activity must be
4.2. Stability of the R /ETS ratio
As mentioned in the Introduction there are strong reasons to believe that the original method (sensu Packard, 1971) gives a variable R / ETS ratio related to the physiological state of the organisms. This method suggests incubation of the homogenate at in situ temperature or that the Arrhenius equation is applied to convert to ETS activity at in situ temperature. Since physiological rates are strongly influenced by temperature in a way similar to that proposed by the Arrhenius equation, respiration rate and ETS activity will
˚
vary in parallel in response to changes in temperature (cf. Bamstedt, 1980). In the present method the same argumentation does not hold, since the analysed parameter corresponds to the ambient substrate level of the organism. My results for Praunus
flexuosus kept at different temperatures for several days (Table 1, Fig. 6) indicate only
small effects of temperature. This, in turn, indicates that the response of the respiration rate to temperature changes is governed by the corresponding change in the turnover rate of substrates, and to a lesser extent by the ambient substrate level. Similar conclusions can be drawn from the results in Fig. 5, where decreased temperature in September gave an increased variance in the R / ETS ratio, mainly due to a reduced range in the respiration rate. The practical consequence of this is that R / ETS should be determined for each season and the appropriate conversion used. Keeping this in mind, the rather homogenous R / ETS values found among macrozooplankton species (see Table 3) indicate that the conversion will give a very good estimate of the respiration rate. The results from Fig. 7 on two crustacean species also showed that the two subgroups, identified by difference in metabolic rate, were identical in terms of respiration rate and ETS activity. This strengthens the impression of the two parameters measuring the same physiological process. However, within both groups there were a dominance of small individuals with an average R / ETS of 2.13 and large ones with an average R / ETS of 4.13. No logical explanation for this can be given at present. Results from the manipulative experiments with Praunus flexuosus (Fig. 6) are also difficult to explain logically. The main difference in ETS activity was between experimental groups held for a long period with food in the laboratory versus those held for a few days. The former group showed considerably higher activity and the most logical explanation is that the ETS activity, as measured by the present method, needs considerable time to adjust to a new and stable feeding condition. Obviously, further studies are needed to understand the underlying mechanism.
4.3. Practical use and recommended procedures
The present method is very simple to use and especially suitable for fieldwork. In one approach, zooplankton from the Barents Sea were actually frozen down in ETS reagent and the analytical procedures performed 3.5 months later. However, the consequences of this were not checked, although the calculated respiration rates for the copepods
21
included (0.19–0.37mg O mg2 wet weight) were similar to respiration rates actually
measured for copepods in Kosterfjorden (0.27–0.40, see Table 3). Values also agreed ˚
(1985). However, the chaetognath Sagitta elegans showed higher rates from the Barents Sea (cf. Tables 3 and 4). This, and the high respiration rate calculated for the hydromedusa in Table 4, might be explained by loss of water from the body after freezing, giving a negative bias in the weighing. Omitting the weighing procedure would solve this problem, although body mass is usually needed in the quantification. An approach including a simple protein assay of the ETS homogenate would be one possibility, although potential interference of the ETS reagent on the protein assay must be checked. With this approach, animals can be sorted in the field, placed in a capsule with a small volume of ETS reagent and frozen. On returning to the laboratory the samples are homogenised, a protein sample is taken, and a defined volume is incubated and run through the analytical steps for ETS activity.
The standard procedure for the method is homogenisation and incubation in direct association with the collection of material. This procedure has been well tested and gives reliable and reproducible results. The quenched samples are stable even at room temperature and the only equipment needed for the analytical work in the field is a homogeniser and a temperature block for maintaining a constant incubation temperature. The delay in sorting material from a sample does not seem to be critical (cf. Fig. 4B). Thus, collected material can be transported to the laboratory before being sorted and analysed.
One main task in converting from ETS to respiration rate is to use an appropriate R / ETS constant. Due to methodological reasons it is not possible to use a temperature correction on measured ETS by simply applying an Arrhenius equation (see above) as commonly done when using the traditional ETS method. However, the use of such a temperature correction when predicting long-term (seasonal) and large-scale (polar– temperate–tropical) differences might be risky, since the adaptation ability of the
˚
organism is not considered in the formula. Thus, Bamstedt and Tande (1985) noted that
the weight-specific respiration rate of large-sized copepods at between 21 and 21.88C
was not different from other copepods of similar size at environmental temperatures up
to 88C. They also noted that the excretion rate was not even related to temperature when
increasing the range to 158C. It is therefore recommended that the ETS activity be
calibrated against appropriate respiration-rate data to give an unbiased R / ETS ratio for use in the conversion procedure.
The general variability in R / ETS due to long-term and large-scale differences has not been evaluated in the present paper. Similarly, the generality of the method, as defined by a stable and robust R / ETS ratio over diverse taxa, has not been fully evaluated. The presented results for macrozooplankton, representing different phyla and lower taxa, different trophic levels and species with different water content, do indicate that the method is generally applicable. Further investigations that widen the data base for such a proposal are therefore required.
Acknowledgements
formed part of a research project supported by the Swedish Natural Science Research
Council. [SS]
References
Aristegui, J., Montero, M.F., 1995a. The relationship between community respiration rate and ETS activity in the ocean. J. Plankton Res. 17, 1563–1571.
Aristegui, J., Montero, M.F., 1995b. Plankton community respiration in Bransfield Strait (Antarctic Ocean) during Austral spring. J. Plankton Res. 17, 1647–1659.
˚
Bamstedt, U., 1979. Seasonal variation in the respiratory rate and ETS activity of deep-water zooplankton from the Swedish west coast. In: Naylor, E.D., Hartnoll, R.G. (Eds.), Cyclic Phenomena in Marine Plants and Animals. Pergamon Press, pp. 267–274.
˚
Bamstedt, U., 1980. ETS activity as an estimator of respiratory rate of zooplankton populations. The significance of variations in environmental factors. J. Exp. Mar. Biol. Ecol. 42, 267–283.
˚
Bamstedt, U., Tande, K.S., 1985. Respiration and excretion rates of Calanus glacialis in arctic waters of the Barents Sea. Mar. Biol. 87, 259–266.
Giorgio, P.A., 1992. The relationship between ETS (electron transport system) activity and oxygen consumption in lake plankton: a cross-system calibration. J. Plankton Res. 14, 1723–1741.
Hemmingsen, A.M., 1960. Energy metabolism as related to body size and respiratory surface, and its evolution. Rep. Steno Mem. Hosp. 9, 1–110.
Hernandez-Leon, S., Gomez, M., 1996. Factors affecting the respiration / ETS ratio in marine zooplankton. J. Plankton Res. 18, 239–255.
Ikeda, T., 1996. Metabolism, body composition, and energy budget of the mesopelagic fish Mauriculus
muelleri in the Sea of Japan. Fish. Bull. 94, 49–58.
Kenner, R.A., Ahmed, S.I., 1975. Measurements of electron transport activity in marine phytoplankton. Mar. Biol. 33, 119–127.
King, F.D., Packard, T.T., 1975. Respiration and the activity of the respiratory electron transport system in marine zooplankton. Limnol. Oceanogr. 20, 849–854.
Madon, S.P., Schneider, D.W., Stoeckel, J.A., 1998. In situ estimation of zebra mussel metabolic rates using the electron transport system (ETS) assay. J. Shellfish Res. 17, 195–203.
Martinez, R., 1991. Biomass and respiration ETS activity of microzooplankton in the Barents Sea. Polar Res. 10, 193–200.
Martinez, R., 1992. Respiration and respiratory electron-transport activity in marine phytoplankton — growth-rate dependence and light enhancement. J. Plankton Res. 14, 789–797.
Martinez, R., 1997. Enhancement of microplankton respiratory activity in the Almeria-Oran front (Western Mediterranean Sea). J. Plankton Res. 19, 2051–2065.
Martinez, R., Estrada, M., 1992. Respiratory electron-transport activity of microplankton in the Weddel Sea during early spring — influence of the ice cover and the ice edge. Polar Biol. 12, 275–282.
Mayzaud, P., 1986. Enzymatic measurements of metabolic processes concerned with respiration and ammonium excretion. In: Corner, E.D.S., O’Hara, S.C.M. (Eds.), The Biological Chemistry of Marine Copepods. Oxford University Press, Oxford, pp. 226–259, Chapter 5.
Owens, T.G., King, F.D., 1975. The measurement of respiratory electron transport activity in marine zooplankton. Mar. Biol. 30, 27–36.
Packard, T.T., 1971. The measurement of respiratory electron transport activity in marine phytoplankton. J. Mar. Res. 29, 235–244.
Packard, T.T., 1985. Measurement of electron transport activity in microplankton. Adv. Aquat. Microbiol. 3, 207–261.
Packard, T.T., Harmon, D., Boucher, J., 1974. Respiratory electron transport activity in plankton from upwelled waters. Tethys 6, 213–222.
˚