SPECIAL ISSUE
THE HUMAN ACTOR IN ECOLOGICAL-ECONOMIC MODELS
On modeling human behavior and institutions in simple
ecological economic systems
John M. Anderies
CSIRO Wildlife and Ecology,GPO Box284,Canberra,ACT2615,Australia
Abstract
The use of stylized dynamical systems models and bifurcation analysis in modeling individual and collective behavior in two traditional societies, the Tsembaga of New Guinea and the Polynesians of Easter Island, is explored. The analysis is used to isolate key aspects of individual behavior that open up the possibility of resource overexploitation and key aspects of institutions capable of preventing overexploitation. An extension of the Brander and Taylor [Am. Econ. Rev. 88 (1998) 119 – 138] Easter Island model with a more realistic model for individual behavior is presented. This induces significant changes in the model dynamics which share many similarities with the Tsembaga model of Anderies [J. Theor. Biol. 192 (1998) 515 – 530]. Namely, in both models, the ability of agents to intensify the exploitation of the resource base to attempt to meet demands is a fundamentally destabilizing force. The model implications for present day policy issues are explored. © 2000 Elsevier Science B.V. All rights reserved.
Keywords:Dynamic models; Subsistence economies; Resource governance
www.elsevier.com/locate/ecolecon
1. Introduction
Some years ago, Garrett Hardin (1968) argued that users of a common property resource are locked in an irreducible tension between individ-ual and collective action. Because individindivid-uals ig-nore the costs their decisions impose on others, the resource is overexploited. If achieved, collec-tive action would allow more efficient use of the resource. The difficulty is, of course, in achieving
collective action among the group of users of the resource. The most commonly proposed solutions for this problem are either central control im-posed on the users of the resource or privatization of the resource in some way. Ostrom (1990) has made the point that these extremes are not the only options available and that solutions will vary greatly from situation to situation. The existence of many varied successful solutions among both past and present traditional societies has led to the recognition of the value of indigenous re-source management knowledge and practices, and the fact that there is much to learn from the
E-mail address:[email protected] (J.M. Anderies).
experiences, both positive and negative, of past societies (e.g. Berkes and Folke, 1998; Ostrom et al., 1999).
What one can learn from studying traditional societies is under what conditions they can solve common property resource dilemma’s effectively. History is full of examples of societies that did not (Tainter, 1988), and offers some examples of those that have or may have (Berkes and Folke, 1998; Rappaport, 1968; Ostrom, 1990) (on some time scale). Important objectives in studying tra-ditional societies are discovering fundamental as-pects of human behavior that predispose human populations to overuse their resource base and fundamental building blocks for institutional ar-rangements common to societies that successfully manage common property resources over some relevant time scale.
To some extent, these questions have already been addressed. Ostrom (1995) has provided a set of seven design principles that characterize most institutions that manage common pool resources successfully. She also comments on the impor-tance of the underlying assumptions about human behavior, i.e. humans as selfish, norm-free, short-run utility maximizers, versus beings capable of establishing and adhering to social norms, cooper-ating, etc. (Ostrom, 1999). However, even with these guidelines, it is very difficult to design rules that prevent common property resource degrada-tion. In many cases, these rules may have evolved over long time periods. They can be exceedingly complex and may not be the products of self-con-scious design. In her study of the historical record, Ostrom (1990) notes that some individuals have been able to avoid destroying their own resource base while others have not, and raises the question of what differences might exist between these groups. In this case, modeling can be of some help in elucidating key drivers that (par-tially) account for these differences and thus help guide the design of effective rules.
The aim of this paper is to present a specific approach to improving our understanding of how rules that govern individual and collective behav-ior might mediate the interaction of human popu-lations with their environment. The idea is to develop stylized models of human-ecosystem
in-teractions and study their behavior under differ-ent management/behavioral regimes using bifurcation analysis. Key ingredients (that may not be at all obvious) that lead to the success or failure of a particular institutional structure can thus be isolated.
The approach is illustrated in two parts. First, two recent models that use this approach are discussed and compared. The first model due to Anderies (1998a) focuses on a careful analysis of the destabilizing effect of particular human re-sponses to environmental change in a stylized model of the Tsembaga of New Guinea, and how their ritual cycle can re-stabilize the system. The second model due to Brander and Taylor (1998) focused on developing a simple model using tools from neoclassical economic theory to explain the rise and fall of the Polynesian culture on Easter Island. Next, the method is applied to an ex-tended version of the Brander and Taylor model to explore how different assumptions about indi-vidual behavior can lead to different interpreta-tions of why instituinterpreta-tions may not have developed to prevent the overshoot and collapse supposed to have occurred there.
The paper is organized as follows. Section 2 gives a very brief summary of the motivation for the models. Section 3 outlines the modeling ap-proach. Section 4 illustrates the approach for the Tsembaga and Easter Island. Section 5 develops and analyzes the extended version of the Easter Island model. Section 6 discusses possible princi-ples for present day policy that emerge from the model analysis. Finally, Section 7 concludes.
2. Background
action and the associated institutions. The need for collective action emerges from increases in population numbers, ability to harvest the re-source, or both.
That collective action is an emergent property of an evolving system suggests that successful institutions would be very tightly woven into the lives of the participating agents. Work concerning culture, social structure, and ecology from this perspective has roots in anthropology. In contrast to the view that social structure was largely a product of unpredictable historical processes, in the 1950s Julian Steward suggested that social structure and modes of subsistence were causally linked (Moran, 1990). Subsequently, researchers, e.g. Geertz (1963), Vayda and Rappaport (1968) and Vayda (1969), took the ecosystem rather than culture as the primary unit of analysis in attempts to explain culture as an evolved adaptation to the environment. Pigs for the Ancestors, in which Rappaport (1968) proposed that cultural pro-cesses, such as the ritual cycle of the Tsembaga play critical regulatory functions in their ecosys-tem, is probably the best known work in applying the ecosystem concept in anthropology.
Rappaport was subsequently criticized for his focus on a ‘functionalist’ explanation of Tsem-baga culture. The argument was that the possible adaptive value of cultural processes cannot ex-plain how a particular set of institutions evolved. This is true, of course, for any evolutionary argu-ment: they can never be used to explain how a particular structure evolved. The best we can do is better understand how particular structures might be adaptive. This is valuable in itself — it can help us understand what characteristics different sets of institutions capable of preventing popula-tions from destroying their resource base (and
thus going extinct) might share. This is the spirit of the analysis of the Tsembaga model presented here.
In another recent work on traditional societies, Brander and Taylor (1998) focused on Easter Island. The authors combined a simple produc-tion structure with open access exploitaproduc-tion of a renewable resource to shed light on why the cul-ture of Easter Island vanished while other islands occupied by Polynesians did not experience the same fate. The main point made by Brander and Taylor (1998) is whether or not a population would experience a boom and bust cycle depends on an ecological parameter: the intrinsic growth rate of the palm species on which the Polynesians depend for food. The authors question why insti-tutional changes did not emerge to prevent the collapse. In this case, perhaps, social capital did not evolve sufficiently fast for the population to adjust to its new environment. Indeed, some so-cial change did occur: the great statues were top-pled, but this was probably not helpful in coping with their degraded resource base. On the other hand, the Tsembaga may have been more lucky.
3. Model structure and analytical methods
The models of Easter Island and the Tsembaga of New Guinea developed in Brander and Taylor (1998) and Anderies (1998a), respectively, have the same general form. They are simple dynamic models of renewable resource use where resource consumption affects human fertility. The most basic form of such a model must incorporate at least two state variables: the stock of renewable resources upon which the population depends de-noted as S(t), and the human population (or
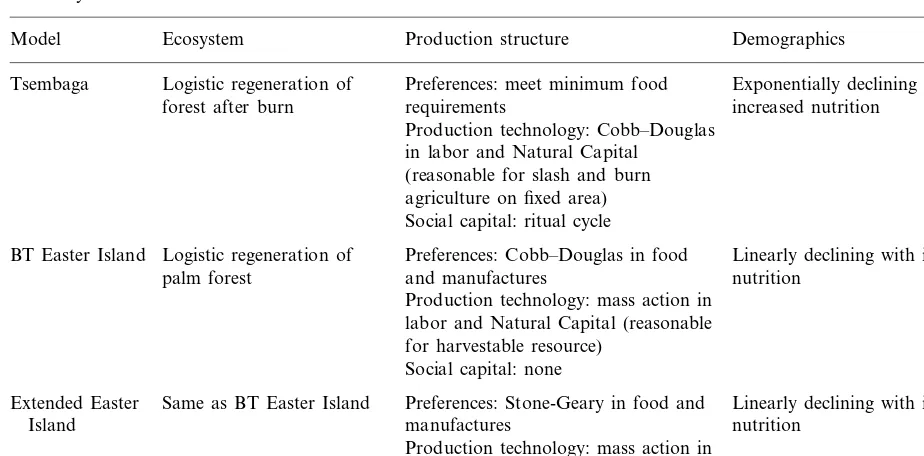
Table 1
Summary of model attributes
Production structure
Model Ecosystem Demographics
Tsembaga Logistic regeneration of Preferences: meet minimum food Exponentially declining with forest after burn requirements increased nutrition
Production technology: Cobb–Douglas in labor and Natural Capital
(reasonable for slash and burn agriculture on fixed area) Social capital: ritual cycle
Preferences: Cobb–Douglas in food Logistic regeneration of
BT Easter Island Linearly declining with increased
and manufactures nutrition palm forest
Production technology: mass action in labor and Natural Capital (reasonable for harvestable resource)
Social capital: none
Same as BT Easter Island Preferences: Stone-Geary in food and
Extended Easter Linearly declining with increased
manufactures nutrition
Island
Production technology: mass action in labor and Natural Capital (reasonable for harvestable resource)
Social capital: none
available labor pool as is the custom in econom-ics) denoted byL(t). The basic model structure is depicted in Fig. 1.
The figure depicts three interacting compo-nents; the two state variables and the socio-eco-nomic system that governs their interaction. The nature of the socio-economic system depicted in the center is characterized by individual prefer-ences, production technology, and social capital. The interaction of these components governs the
dynamics of the model. The model can be stated in a general as
dS
dt=R(S)−H(S,L) (1a)
dL
dt=G(H,L)L (1b)
where R(S) is the renewal rate of the renewable resource, H(S,L) is the harvest rate of the
source, andG(H,L) is the per capita growth rate of the human population. The roles these func-tions play in the model are caricatured in Fig. 1. In the context here, R(S) and G(H,L) are taken as biophysically determined. The form ofH(S,L), on the other hand, is based on the nature of the socio-economic system and will be our focus. Table 1 summarizes the specific assumptions for each of the models discussed here.
This model given by Eqs. (1a) and (1b) is a simple dynamical system in two dimensions, and its range of behaviors is well known. Trajectories will either approach an equilibrium monotoni-cally, after a series of damped oscillations, or not at all. If trajectories do not approach an equi-librium, they will approach a limit cycle and undergo persistent oscillations. Fig. 2 illustrates these possibilities.
In graph (a), any reasonable initial condition with high biophysical capital and low population will evolve to a stable steady state (perhaps through a series of damped oscillations). This corresponds to the case where either individual behavior, collective behavior, or both are such that the resource is not degraded to the point where it can no longer sustain the population. In graph (b), on the other hand, no reasonable initial condition with high biophysical capital and low population will evolve to a steady state, and will instead converge to a limit cycle. The fact that a model evolves to a limit cycle as opposed to a steady state does not necessarily mean that it is less preferable. Whether such behavior is less preferable depends on nature of the limit cycle, namely, the amplitude and characteristic time scales involved.
Consider graph (b) in Fig. 2 and the points labeled A, B, and C. Important to whether a limit cycle is less preferable is its amplitude and period, i.e. the distance in time and state space between the above points. For example, the case in which the time between points A and B is 300 years, the time between points B and C is 10 years, the time between points C and A is 100 years, and the population difference between points B and C is large, is undesirable. This corresponds to the growth and development of a society (or civiliza-tion depending on the scale) causing the slow
degradation of the resource base (AB), which
was followed by a rapid decline in the society (BC). The collapse of the society is followed by
a slow recovery of the resource base (CA), after which the cycle may (and probably has many times in the past) repeat itself. The key point is that the large fluctuation from B to C occurs on a human time scale — 10 years, and could be devastating. The slow degradation and recovery phases occur over much longer time scales, i.e. the resource base will recover, but over what period of time?
On the other hand, a small amplitude, low period limit cycle may be a desirable outcome. It turns out that the ritual cycle of the Tsembaga serves to move the system away from the large amplitude fluctuations in behavior (b) to a limit cycle with very small amplitude fluctuations driven by the periodicity of the ritual cycle. Nonetheless, the ritual cycle prevents the in-evitable degradation of the resource base associ-ated with model behavior (b). The point, graphs (a) and (b) only serve as illustrations of the ex-tremes — there are many possibilities in between, as we shall see. A successful institution need not return the system to behavior (a), it need only move it away from behavior (b).
Even with simple models, the analysis is not easy. The two model behaviors (a) and (b) are separated by what is called a Hopf bifurcation which occur when, as a parameter is varied, the steady state changes from being locally stable to unstable, and a periodic orbit develops around the steady state. For simple systems, standard ana-lytic methods of dynamical systems theory can be applied reasonably easily (Kuznetsov, 1995). For systems with more complex expressions, such analysis becomes increasingly difficult and may be impractical. The main tool I employ here is a numerical technique known as pseudo arclength continuation available in the software package Auto (Doedel, 1981). By combining known ana-lytical results with powerful computational al-gorithms, models that are analytically tractable, but for which the analysis is impractical or cum-bersome, can be more efficiently, thoroughly, and accurately analyzed.
The analysis amounts to starting at a known fixed point of the system and tracking its stability as a parameter is varied in very small steps. By locating points where the stability of the fixed point changes, we can detect local bifurcations and use these to divide the parameter space as mentioned above. This powerful tool for analyz-ing dynamical systems is freely available. Inter-ested readers should visit http://www.iam.ubc. ca/guides/xppaut/for more details and download information. For more details on the application of the method for ecological models see (van Coller, 1997).
4. The models
Presented here is a summary of the detailed models of Anderies (1998a) and Brander and Tay-lor (1998) to illustrate the modeling approach and to serve as a basis for comparison for my exten-sion of the Easter Island model presented in Sec-tion 5.
4.1. The Tsembaga
The Tsembaga occupy a rugged mountainous region in the Simbai and Jimi River Valleys of
New Guinea, along with several other Maring speaking groups with whom they engage in some material and personnel exchanges through mar-riages and ritual activity. These groups each oc-cupy semi-fixed territories that intersperse in times of plenty and become more rigidly separated in times of hardship. Outside these interactions, the Tsembaga act as a unit in ritual performance, material relations with the environment, and in warfare.
The Tsembaga rely on a simple swidden (slash-and-burn) agricultural system as a means of sub-sistence. At the time of Rappaport’s (1968) field work they occupied about 830 ha, 364 of which were cultivable. The Tsembaga also practice ani-mal husbandry (the most prominent domesticated animal being pigs), but derive little energetic value from this activity. Pork probably serves as a concentrated source of protein for particular seg-ments of the population as they are rarely eaten other than on ceremonial occasions, and several taboos surround its consumption that seem to direct it to women and children who need it most. The key point to keep in mind as the model is developed is that pigs are not an important food source for the Tsembaga in meeting their basic nutritional requirements. As such, the effect of pig consumption on the population growth rate is negligible compared to staple foods of plant origin.
Much of the activity of the Tsembaga is related to the observance of rituals tied up with spirits of the low ground and the red spirits. The spirits of the low ground are associated with fertility and growth while the red spirits, which occupy the high forest, forbid the felling of trees. The ritual activity that is the focus here is the Kaiko, a year-long pig festival. The Kaiko serves to end a 5 – 25 year-long ritual cycle that is coupled with pig husbandry and warfare. It is this ritual cycle that Rappaport hypothesized acted as self-regula-tory mechanism for the Tsembaga population, preventing the degradation of their ecosystem.
perpetual hostilities with some groups and are allied with other groups without whose support they will not go to war. There are two important aspects of pig husbandry: raising pigs requires more energy than is derived from their consump-tion, and pigs are the main source of conflict between neighboring groups because they invade gardens. From this perspective the keeping of pigs is completely nonsensical. However, the effort required to raise pigs is a strong information source about pressure on the ecosystem. The greater the pig population, the greater the chance an accidental invasion of others gardens will oc-cur. Each time a garden is invaded, there is a chance that the person whose garden was invaded will kill the owner of the invading pig. Records are kept of such deaths which must be avenged during the next ritually sanctioned bout of war-fare. From this perspective, pigs provide a meter of ecological and human population pressure and help measure the right amount of human popula-tion reducpopula-tion to maintain ecosystem integrity. The Kaiko, when all but a few of the host group’s pig herd are slaughtered, helps facilitate material transfers with other groups, allows the host group to assess the support of its allies, and resets the pig population.
The ritual cycle as the homeostatic mechanism proposed by Rappaport operates as follows: hu-man and pig populations grow until the work required to raise pigs is too great. A Kaiko is called and most of the pig herd is slaughtered. The Tsembaga are released from taboos prohibit-ing conflict with neighbors. Warfare begins with a series of minor ‘nothing fights’ where casualties are unlikely, then escalates to the ‘true fight’ where axes are the weapons of choice and casu-alties are much more likely. Periods of active hostilities seldom end in decisive victories but rather when both sides have agreed on ‘enough killing’ related to blood revenge from past injus-tices. The ritual cycle then begins anew with both the pig and human populations reduced to (hope-fully) levels that will not cause ecological degradation.
Of course, Rappaport’s hypothesis that the rit-ual cycle could stabilize the system was chal-lenged. Rappaport’s detailed ethnographic and
ecological information invited several efforts at formal modeling aimed at testing his hypothesis. Several very detailed simulation models were de-veloped that suggested that the ritual cycle could produce a stable equilibrium for the Tsembaga ecosystem, but this result was very sensitive to parameter choices (Shantzis and Behrens, 1973). Later work using more realistic parameter choices concluded that the ritual cycle could not stabilize the Tsembaga model ecosystem (Foin and Davis, 1984).
The stylized model I developed focused on this question. The form of the functions R(S), H(S,L),G(H,L) in Eqs. (1a) and (1b) are based on Rappaport’s detailed ethnographic and ecolog-ical information, and some basic ecologecolog-ical con-siderations in tropical forests. Based on the qualitative aspects of the regeneration of tropical forests after fire (see Anderies, 1998a for a de-tailed discussion), the resource dynamics are char-acterized by logistic regeneration, i.e.
R(S)=rS(1−S) (2)
where r is the intrinsic regeneration rate of the resource. This is the simplest way to capture the forest regeneration process that is qualitatively similar to more complex models. Based on the nature of Tsembaga agriculture, I assumed H(S,L) (food production function) took a Cobb – Douglas form in labor and the resource stock:
H(S,L)=k(cL)gS1−g (3)
Fig. 3. Limit cycles that develop as the system becomes unstable. The inner cycle is for the case where the work level is constant at 0.14. The outer cycle represents the case where the work level is set by demand.
assumptions about fertility and nutrition, I as-sumed that
G(H,L)=g0−g1exp
g2H
L
(4)whereg0\0 is the nutrition independent
compo-nent of the population growth rate, g1\0 is the
maximum negative growth caused by malnutri-tion, and g2B0 measures the sensitivity of the
growth rate to nutrition. Eq. (4) says that the effects of malnutrition that suppress growth rates fall off exponentially as per capita intake of biore-sources increases. Again I refer interested readers to Anderies (1998a) for more detail.
The parameter of interest here is cwhich mea-sures how hard the population works. Here, a representative agent framework in which individu-als are identical is tacitly assumed. By performing a bifurcation analysis, it can be shown how in-creasingccould move the model system from case (a) to case (b) in Fig. 2 (Anderies, 1998a). Thus, if the population did not work too hard, the system would be stable and there would be no need for collective action in the form of the ritual cycle. It turns out that for the value of c estimated by
Rappaport at the time of his ethnographic study, c=0.09, and for a wide range of physically mean-ingful values for the other parameters, the model exhibits a stable equilibrium population density of 0.6 persons per hectare (a total of around 200 individuals in agreement with Rappaport’s data). This would suggest that the ritual cycle does not play an important role in mediating the impact of the Tsembaga on their ecosystem. The problem is that the Tsembaga adjustcto meet the nutritional demands of themselves and their pigs. To illus-trate, I added a very simple equation to describe the dynamic change of cover time:
dc
dt=l(d−H/L) (5)
system and adjust labor up or down according to their nutritional status. They react at a speed ofl
which is assumed to be much faster than ecologi-cal dynamics. These assumptions about behavior may seem a bit simplistic. However, when we compare this to the more complex economic model used by Brander and Taylor for Easter Island, we will see that there is very little differ-ence in the end.
The Tsembaga do not collectively determine c at the population level; it is determined at the level of the family unit or individuals within the family unit. As such, Eq. (5) must be interpreted as representing individual decisions. If per capita intake is below the fixed minimum demand, the work level increases, and vice versa. By assuming a population of identical representative agents, d is constant across the population, per capita in-take is H/L, and all agents make identical deci-sions. This unrealistic structure is a major limitation of this approach and completely ig-nores important heterogeneity across agents that would be captured in a multi-agent model. This is the price one has to pay to maintain the transpar-ency that is an important aspect of the utility of dynamical systems models.
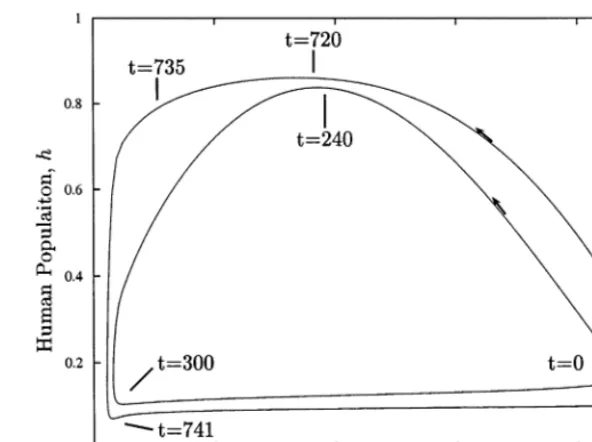
Fig. 3 summarizes the effect of behavior on the model for two cases, a constant c=0.14 (inner limit cycle), and c set dynamically by Eq. (5) (outer limit cycle). The inner limit cycle shows the nature of the overshoot and collapse when the population works too hard, but does not adjust its work level. Starting from the lower right-hand corner of the limit cycle, the population grows to a maximum over about 240 years as natural capi-tal (maximum=1 corresponding to unexploited state) degrades from 0.9 (90% of unexploited state) to about 0.4 (40% of unexploited state). The population then collapses over 60 years as natural capital further declines to less than 10% of the unexploited state. The resource base then recovers over several hundred years with a very low human population density.
The outer cycle shows the same sequence when cis dynamically set. In this case, it takes 720 years for the population to reach its peak, but notice that the limit cycle is much flatter on the top. This
corresponds to the population slowly increasing its work level to maintain the population as the resource base becomes ever more degraded. By rapidly increasing work effort between t=720 and t=735, the population can almost maintain itself. This does nothing more than set the popula-tion up for a more dramatic crash when the system finally does collapse. In a mere 6 years (as compared to 60), the population collapses dra-matically. The fact that individuals attempt to meet food demand (as opposed to working at a fixed level), makes the overshoot and collapse cycle more dramatic. This is an important point that I will develop in more detail in the extended Easter Island model.
The analysis above does suggest that without the evolution of some type of institution, the Tsembaga could not achieve an equilibrium (or small amplitude, short period limit cycle) with their environment and may not have been there for Rappaport to study. The next question is under what circumstances the ritual cycle could prevent the degradation of the resource base. By adding the ritual cycle to the model, I isolated two key components: the parasitism of pigs, and the way the number of individuals to be killed during a ritual warfare bout is determined.
The bulk of the responsibility of keeping pigs falls on Tsembaga women. They do most of the work in planting, harvesting and carrying the crops used to feed the pigs. In this sense, the pigs can be viewed as parasitizing Tsembaga women. They benefit from energy derived from the ecosys-tem, but do not contribute to obtaining that energy. It turns out that this relationship, in and of itself, is enough tohelpstabilize the ecosystem. Since the pigs absorb work that might otherwise be directed at feeding a larger population, they effectively increase the per-capita work level re-quired to maintain a particular population. As the pig population grows relative to the human popu-lation, the per-capita work level increases to a point beyond which it cannot be maintained by Tsembaga women. In this way, the pigs act as an ecosystem monitoring device.
at which most of the pigs are harvested, followed by ritual warfare between rival tribes. This ritual warfare is the key population regulation mecha-nism that prevents the Tsembaga from inevitably degrading their resource base. In order to model this institution we need to keep track of the pig population, the harvest rate, and the outbreak of war. I accomplish this by adding three state vari-ables,p(t),h(t), and w(t) which represent the pig population, pig harvest rate, and warfare inten-sity, respectively. The pig harvest and warfare intensity are zero most of the time and switch on and off based on the pig-to-person ratio. This ratio is the key ecosystem monitoring device. Thus, to Eqs. (1a) and (1b) we add
dp
dt=(rp−h)p (6a)
dh
dt=f1(p/L,h) (6b) dw
dt=f2(p/L,w) (6c)
where rp is the growth rate of the pigs. The functionsf1andf2generate ‘relaxation oscillators’
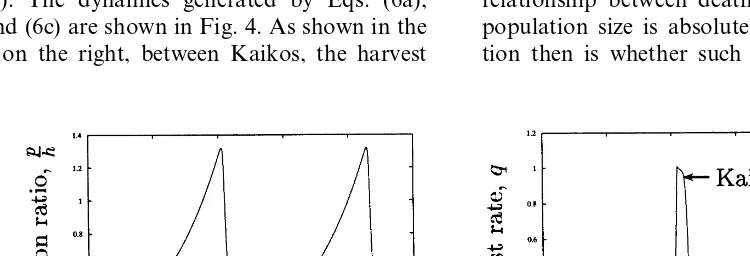
that turn the harvest and warfare on and off based on the ratiop/L. A detailed description and analysis of these functions is beyond the scope of this paper, and I again refer readers to Anderies (1998a). The dynamics generated by Eqs. (6a), (6b) and (6c) are shown in Fig. 4. As shown in the graph on the right, between Kaikos, the harvest
rate is nearly zero. During this time, the pig population grows exponentially as shown on the left. During the Kaiko, the harvest rate rises abruptly and the pig population falls correspond-ingly. The warfare intensity has the same form as that of the harvest shifted slightly to the right, i.e. just after the Kaiko, warfare begins.
The last element of the model is to incorporate the impact of warfare on human population dy-namics by modifying Eq. (1) to read
dL
dt=G(H,L)L−wD(L) (7)
where D(L) gives the mortality due to warfare as a function of population size.
It turns out that the key requirement for the ritual cycle to be effective is that D(L) must increase nonlinearly with the population size. If D(L) is a linear function of L, the ritual cycle can’t stabilize the system. For example, the as-sumption of a constant proportion of males being killed during a warfare bout in other simulation models (Shantzis and Behrens, 1973; Foin and Davis, 1984) will likely lead to the conclusion that the ritual cycle could not stabilize the Tsembaga model ecosystem regardless of the character of the rest of the model. The analysis of the more styl-ized model given by Eqs. 1a, 1b, 2, 3, 4, 5, 6 and 7, makes it immediately clear that the nonlinear relationship between deaths due to warfare and population size is absolutely essential. The ques-tion then is whether such a relaques-tionship does in
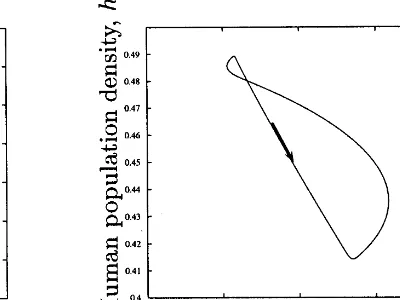
Fig. 5. Limit cycle for the full model.
fact exist in the Tsembaga system. Rappaport actually indicated that this was the case. As there are more pigs, people, and gardens, there are more ways for pigs to invade gardens and cause conflict. This increases the number of required blood revenge deaths during an active period of warfare. The number of ways a pig might invade an enemy’s garden rises much faster than linearly with increases in pig and garden numbers. Fig. 5 shows the limit cycles to which the model con-verges with D(L)=L2
.
Compare these limit cycles to those shown in Fig. 3. The human population density fluctuations are an order of magnitude smaller, falling from 0.49 to 0.41 during a bout of warfare versus from 0.8 to 0.1 during the collapse that occurs when the ritual cycle is not present. The difference in the fluctuations in biophysical capital between the two cases is even more dramatic. Without the ritual cycle, biophysical capital falls from 0.95 to 0.05 during the growth and collapse phase. The ritual cycle maintains biophysical capital in a very narrow range between 0.86 and about 0.88.
So far I have illustrated how the application of a stylized dynamic model and bifurcation analysis can be used to help understand key drivers of the system. There are two main conclusions:
the tendency of people to increase effort to attempt to meet food demands fundamentally destabilizes the model,
the two key components that enable the
Tsem-baga ritual cycle to re-stabilize the system is the ecosystem monitoring role of pigs, and the nonlinearity of D(L).
It is interesting to point out the relationship between the above results and, as Ostrom (1990) puts it, the three puzzles of common property resource governance: supply, commitment, and monitoring. These are the basic problems faced by any group of agents who use common property resources: how do the necessary institutions (pub-lic goods) get supplied, how is the commitment from participants maintained, and how is cheating prevented.
4.2. Easter Island
It is believed that Easter Island was settled by a small group of Polynesians around 400 AD at which time there was great palm forest on the island. The population grew rapidly with this abundant resource of palms which allowed them to eventually devote considerable time to carving and moving statues between about 1100 and 1500 AD. Pollen records indicate that the palm forest was almost entirely gone by 1400. By the time of the first European contact in the 18th century, the inhabitants of the island seemed incapable of carving and moving statues and indicated they had no knowledge of how to do so. The current explanation for this mystery is that the islanders degraded their environment to the point that it could no longer support them and the civilization that created the stone monuments died out, leav-ing only a small remnant to meet Dutch ships in 1722.
Brander and Taylor (1998) note, however, that Polynesians almost always dramatically altered the environments of the islands they discovered, but did not collapse. In an attempt to explain why Easter Island culture collapsed while other Poly-nesian settlements did not, Brander and Taylor developed what they call a Ricardo – Malthus model of renewable resource use for the simple economics of Easter Island. The model is very similar in spirit to the Tsembaga model, but mod-els human behavior using the neo-classical eco-nomics approach of constrained optimization. The main finding in this work is that for a low intrinsic growth rate of the resource base, the model exhibits overshoot and collapse, while for larger values of the intrinsic growth rate parame-ter, the model exhibits monotonic approach to a steady state. This is consistent with the fact that the palm species on Easter Island is more slow growing than those on other islands that did not experience overshoot and collapse. This very sim-ple model helped isolate the main influence that might separate Easter Island from other Polyne-sian settlements.
Aside from this stylized fact, the model might help explain other aspects of the Easter Island experience. One of these, as previously mentioned,
is the question of why some institution for collec-tive action did not evolve to prevent collapse. The contribution of the model to this question is to highlight the importance of the relative time scales in operation in these resource systems. There are two important time scales in the Easter Island model, the archeological and the human lifetime. Although the forest disappeared very quickly on the archeological time scale, the forest stock would have decreased by no more than 5% over a typical lifetime. Such a change is imperceptible, making it almost impossible for islanders to rec-ognize that depletion was occurring. Brander and Taylor propose that this may have been a factor in the lack of institutional change. The slow time scale of ecological processes makes problems difficult to see and address when viewed on the fast timescale of a human lifetime.
This interpretation, however, is not consistent with other archeological data from Easter Island that Brander and Taylor discuss. The appearance of a new tool in the archeological record around 1500 that is almost certainly a weapon, the move-ment of islanders into caves and fortified dwellings, and strong evidence of cannibalism suggest a more dramatic occurrence than the rela-tively slow and smooth decline predicted by the Brander and Taylor model. Further, the model predicts that a significant amount of manufactur-ing would continue throughout the evolution of the system which may be inconsistent with the abrupt cessation of statue building. These issues are related to the way in which human behavior is modeled. In this section we explore in detail how a relatively complex model of behavior (more complex than in the Tsembaga model) does not produce a very rich characterization of behavior in a dynamic context, and the implications this has for how the archeological data might be interpreted.
In the Brander and Taylor version of the gen-eral model given by Eqs. (1a) and (1b), they assume
R(S)=rS(1−S/K) (8)
linear relationship between fertility and resource intake, specifically,
G(H,L)=b−d+fH
L (9)
wherebanddare constant background birth and death rates, and f(H/L) represents the variable growth component that depends linearly on per capita resource consumption.
Representative agents maximize utility by con-suming two goods — bioresource goods (agricul-tural output and fish),H, and manufactured goods (tools, housing, and artistic output), M. Brander and Taylor assume a Cobb – Douglas utility func-tion, thus agents maximize
u(h,m)=hb
m1−b (10)
subject to
phh+pmm5w (11)
wherehandmare per capita consumption rates of the bioresource and manufactured goods, ph and
pmare their prices,wis the wage rate, andbdefines
the preferences for these goods. Agents make consumption decisions at the individual level, but the assumption that they are identical allows them to be aggregated. When I refer to individual be-havior, I am referring to the level at which deci-sions are made, not that each individual has different behavior.
The resulting indirect per-capita demand func-tions are:
h=bw
ph
and m=w(1−b) (12)
wherewis the wage rate. Again, unlike the Tsem-baga model, the production structure is assumed to be linear:
H=aSLH (13a)
M=LM (13b)
The bioresource harvest, H, is proportional to the product of the size of the resource stock and the quantity of labor devoted to obtaining it,L H, whereais analogous to the catchability coefficient often used in fishery models (Clark, 1990). Manu-facturing output,M, depends on labor alone, and
by choice of units, one unit of labor produces one unit ofM. The linearity of the fertility and produc-tion funcproduc-tions greatly simplify the analysis of the model, but also limit the range of its possible behavior.
Assuming that the only costs of production are due to labor, the per-unit supply prices are given by
ph=
wLH
H (14a)
pm=
wLM
M (14b)
M is treated as a numeraire good whose price is normalized to 1. This with Eq. (13b) implies that the wage rate is also 1. Then Eqs. (13a) and (14a) imply
ph=
1
aS (15)
which merely says that as the resource stock decreases, its supply price increases. Substituting the supply prices and wage rate into Eq. (12) yields the actual per-capita amounts of H and M pro-duced:
h=abS (16a)
m=1−b (16b)
Combining this result with Eqs. (9) and (8) yields the full model studied by Brander and Taylor:
dS
dt=rS(1−S/K)−abSL (17a)
dL
dt=(b−d+fabS)L (17b)
A glance at Eq. (17a) reveals that they are equiva-lent to a Lotka – Volterra predator-prey system with a density-dependent prey growth rate.
The model specified by Eq. (17a) has one non-trivial equilibrium point (S*,L*) that satisfies S*\0,L*\0 and
dS(S*,L*)
dt =0 (18a)
dL(S*,L*)
This equilibrium point is globally asymptoti-cally stable, the proof of which relies on a simple application of a theorem due to Kolmogorov relating to planar systems of this type (see May, 1973; Edelstein-Keshet, 1988). Beginning from any interior initial condition, the system will con-verge to the steady state. Depending on parameter values, the steady state will either be a node or a spiral which will force the system to converge to the equilibrium either monotonically or through a series of damped oscillations. Of interest to Brander and Taylor is that for certain parameter values representative of the situation on Easter Island, the system will exhibit transitory oscilla-tory behavior which manifests itself in overshoot and collapse. Fig. 6 shows the human population and resource stock trajectories for an initial con-dition of 40 humans landing on Easter Island with the resource stock at carrying capacity. The units for the resource are a matter of scaling. Brander and Taylor (1998) choose a carrying capacity of 12 000 units for convenience. The remaining parameters were b=0.4, f=4, r=0.04, a=
0.00001, and (b−d)= −0.1.
As previously noted, the archaeological record indicates the first presence of humans at around 400 AD. The population increases which is
ac-companied by a decrease in resource stock. The population (and available labor) peaks at around 1250 AD corresponding to the period of intense carving in the archaeological record. The popula-tion subsequently declines due to resource deple-tion. The model predicts a population of about 3800 in 1722, close to the estimated value of 3000. The model thus gives a reasonable qualitative picture of what may have happened to the culture on Easter Island. The culture became very pro-ductive and able to undertake the construction of major monuments, i.e. the labor force increased thus making LM large enough to complete such a
large scale project. The population subsequently declined due to resource degradation which left the small population who knew nothing of the origin of the great monuments to meet the Dutch ships in the 18th century.
5. A closer look at Easter Island population decline
In this section we examine more closely the nature of the population collapse and how this depends on the way behavior is modeled. It takes 600 years for population to drop from 10 000 to 3800. Compare this to populations doubling every
40 years at present. The authors argue that this slow rate of change may be one of the reasons that institutional change did not occur on Easter Island. Alternatively, this slow decline, if recog-nized, might have given the islanders time to respond. Thus, two possibilities could arise: there was a slow decline and institutional adaptation was possibly prevented by, for example, insuffi-cient ecological understanding or conflicts be-tween competing groups as Brander and Taylor suggest; or the decline occurred faster than the model suggests so that there was no time for institutional adaptation.
The nature of the decline depends on the way behavior is modeled. First, consider the labor allocations in the economy. By equating total supply and demand and solving for LH andLM:
LabS=LHaS[LH=bL (19a)
L(1−b)=LM (19b)
we see that a constant proportion,b, of the labor force is directed towards producing bioresource goods, while the remaining portion of the labor force, 1−b, directs its labor towards the produc-tion of manufactured goods. This implies that as the bioresource stock is depleted and becomes more expensive to produce, individuals continue to consume the same amount of manufactured goods and consume less and less bioresources. The population could be starving, yet the utility maximizing strategy is to keep the proportion of labor directed to each activity constant. Eq. (19b) implies that, for the Brander and Taylor parame-ter set, when the bioresource reaches its most degraded state between 1400 and 1500, manufac-turing output will still be more than 60% of its maximum. This does not seem consistent with the archeological record. Also note that the behav-ioral model is identical to the simple constant proportion approach used in the Tsembaga model where this assumption tended to stabilize the system.
The issue here is that Cobb – Douglas utility functions allow for unlimited substitution between goods without affecting utility. Based on this model, the optimal strategy in the face of a re-source good shortage is to increase consumption
of cheaper manufactured goods. Such a model may be reasonable in a static, context but presents problems in a dynamic context. To be realistic one must consider limits to substitution in con-sumption. It turns out, as shown below, that this makes a considerable difference in the model dynamics.
One way to introduce the possibility for struc-tural change in the economy is to modify the utility function. I do so by utilizing a Stone – Geary type utility function which assumes that there is a minimum amount of bioresource goods (subsistence level) at which utility is zero, i.e.:
U(h,m)=(h−hmin)bm
1−b (20)
where h\hmin. The essential difference between
20 and 10 is that in the latter there are limited substitution possibilities between bioresource goods and manufactures. Such limits to substitu-tion in both producsubstitu-tion and consumpsubstitu-tion have received attention in the literature, and we will see their importance again here.
As before, we can determine the optimal con-sumption of resources, but now there is a corner solution as a result of the subsistence requirement. Maximizing U(h,m) subject to the income con-straint (interior solution) results in the following indirect demand functions:
Now we have that the optimal consumption level of h consists of a price dependent and a price independent portion. This is more realistic as it says to spend excess income on certain propor-tions of h and m only after meeting minimum nutritional requirements. Eqs. (21) only make physical sense when
ph5
w hmin
(22)
but this condition will always be satisfied if h\
hmin. Substituting Eq. (15) forphinto Eq. (22) and
assuming as before that w=1 and pm=1, we see
hmin5aS (23)
which simply says that if the demandhmin can be
met at the present work level, use the optimality conditions given by Eqs (21) to divide excess capacity to the tasks of producing mand h.
If Eq. (22) is not met, the optimality conditions do not apply. Common sense suggests that if people are trying to meet minimum nutritional requirements, they would produce all the biore-source goods possible (corner solution), i.e.
h=aS (24)
Combining 21 with this corner solution defines the optimal consumption program. Finally, the optimal consumption program and the produc-tion funcproduc-tions given by Eqs. (13a) and (13b), can be used to compute the amount of labor the population should devote to producing biore-source goods and manufactured goods:
LH=
Notice that in contrast to the original model, the division of labor is no longer fixed. As the price of bioresource goods increases, labor is shifted out of the production of manufactured goods into the bioresource sector — i.e. there is structural change in the economy. This is analogous to allowing c to be dynamically determined by Eq. (5) in the Tsembaga model. We focus our atten-tion on the effect that the subsistence require-ment,hmin, has on the model. If we takehmin=0,
we retrieve the original model for which we know there is a globally stable equilibrium point at N=4791.7 and S=6250 for parameters chosen by Brander and Taylor. We can use pseudo-ar-clength continuation to investigate the nature of this equilibrium point as hmin is varied. Fig. 7 is
the result of this exercise.
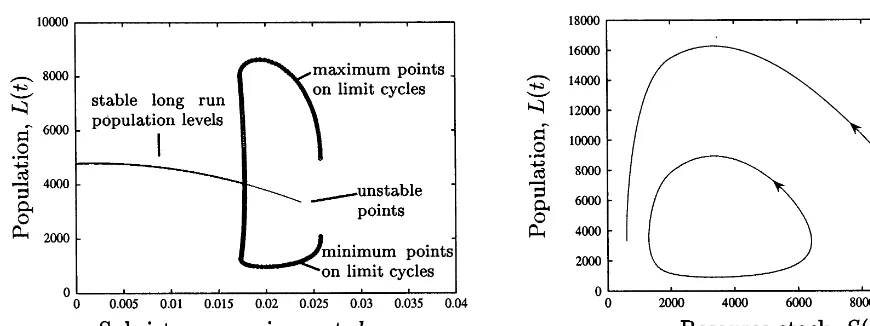
Graph (a) is a bifurcation diagram that plots the long-run equilibrium population for the model for different values of hmin. The heavier line (not
the very heavy line made up of circles) for lower values of hmin indicates that these long-run
equi-libria are stable; but trajectories approaching them may involve fluctuations. The lighter por-tion of the curve for higher values hmin indicates
that the equilibria are unstable, the system will never approach them. Rather, for value of hmin
above the Hopf bifurcation point near 0.0177, the system will approach a stable limit cycle whose amplitude is shown by the very heavy line ema-nating from the curve of fixed points. Graph (b) shows what this limit cycle looks like in phase space for hmin=0.02 as well as representative
trajectory for the Brander and Taylor parameter set and initial condition. The existence of a bifur-cation point and limit cycle causes the model to fluctuate even more dramatically than in the case investigated thus far.
To illustrate how my model suggests a different interpretation of why institutional change may not have occurred, I set hmin=0.03 and b=0.1,
with all other parameters unchanged. This choice of parameters implies individuals have a very low preference to consume more bioresources once they have met their minimum demand. Fig. 8 shows the results for this case.
Fig. 7. (a) Bifurcation diagram for Easter Island model with subsistence. (b) Phase plane showing limit cycle and representative trajectory forhmin=0.02.
Further, this abrupt cessation of manufacturing suggests, as previously mentioned, a different in-terpretation for why institutional adaptation did not occur. From around 1000 up until 1430, the population shifts labor into the bioresource sec-tor. By doing so, per capita intake of bioresources can be maintained above hmin. The population
peaks near 1450 and subsequently crashes to half this peak in 150 years. Such change might have been far too rapid for institutional responses to occur. The ability of the population to increase its work effort and maintain its material well-being hides the feedback from the resource base. When change finally does occur, the resource base is so degraded that the change is rapid and dramatic, precluding any hope of institutional response. A present day parallel is overcapitalization in fisheries. Thus, a relatively small change in model assumptions produces a quite different interpretation.
6. Discussion
The motivation for this paper was to illustrate how the analysis of stylized models of traditional societies might help us better understand key ele-ments of individual behavior and social institu-tions that determine whether degradation of a common property resource can be avoided. From
the comparison of the models, some general ideas emerge. Concerning individual behavior, there are two general conclusions:
Regardless of the model for the underlying behavior, the relaxation of the constant labor proportion assumption is fundamentally destabilizing in both models. When agents are allowed to adjust their labor allocation based on nutritional status, both models exhibit more dramatic overshoot and collapse behavior. Concerning the evolution of institutions, conclusions are much more difficult to draw. As in the case of the Tsembaga, given the social institution we could study how it may have worked but can say nothing about how it might have come about. In the Easter Island case where very little is known, we can do little more than speculate. The best we can do is suggest conditions that might promote or inhibit the evolution of effective resource governance institutions. Two important points emerge from the models:
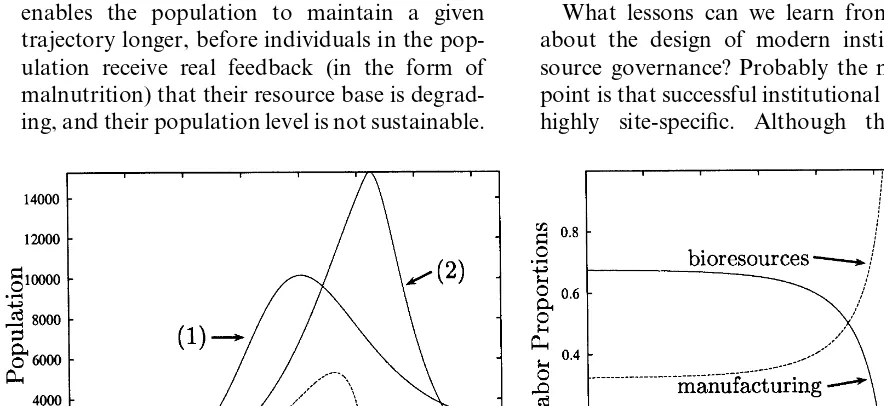
When individual agents can increase the rate of exploitation of their resource base in an effort to meet a minimum demand, the time scale upon which institutional adaptation can occur is dras-tically shortened. Increasing exploitation rates enables the population to maintain a given trajectory longer, before individuals in the pop-ulation receive real feedback (in the form of malnutrition) that their resource base is degrad-ing, and their population level is not sustainable.
Even if all the necessary ‘institutional ingredi-ents’ are in place, successful institutional adapta-tion still may not occur. This is very clear from the Tsembaga model. As discussed above, the ritual cycle has all the necessary ingredients for successful common property governance. How-ever, its success depends critically on the nature of physical system of the Tsembaga. Namely, success depends on the fact that several enemy tribes are contained in a fixed area so that the number of ways pig invasions can occur rises faster than linearly as the human population increases. Without this, the ritual cycle is ineffec-tive. Thus, there is an underlying ‘geometry’ of the human-resource system that may determine the success or failure of resource governance institutions, rather than the nature of the insti-tutions themselves.
Given the above points, it seems improbable that successful, timely institutional adaption based on a recognized need to manage a resource has occurred very often. Rather, certain institutional structures intricately woven into the fabric of society perform such resource management tasks quite by accident. What lessons can we learn from these models about the design of modern institutions for re-source governance? Probably the most important point is that successful institutional designs may be highly site-specific. Although there might be
Fig. 8. Graph (a): curve (1) is the population trajectory for the original Brander and Taylor model, (2) is the same for the modified model withb=0.1 andhmin=0.03, (3) shows manufacturing output for the modified model. Graph (b) shows the labor allocations
general design principles, a careful understanding of the ‘geometry’ of the problem may make the difference between success and failure. Secondly, policy makers must be aware of the relationship between the time scale on which resource gover-nance systems must be developed and the ten-dency or ability to intensify exploitation, or more generally, on structural change in the economic system.
7. Conclusions
In this paper I have reviewed the application of stylized dynamical systems models to two tradi-tional societies, and presented an extension of the Brander and Taylor Easter Island model. Through the comparison of the three models, a general policy design principle emerged: Start the policy design process with a strong attempt to understand the problem ‘geometry’, the key phys-ical and ecologphys-ical factors that may influence the success or failure of any policy prescription, and develop policy to cope with structural change in the economy. This is in contrast to a common approach in the policy literature of searching for optimal strategies or controls, often in a static framework.
To make such an approach useful in a modern policy context, models must include more com-plex economic structures that embody technologi-cal change. Models must attempt to capture the ways technological change actually affects natural resource use. In the simple models discussed here, allowing agents to increase resource sector labor allocation is analogous to increasing output via intensification. Many technological advances do exactly this. The analysis here suggests that this type of technological change may make timely institutional adaptation more difficult. On the other hand, technology may reduce the intensity with which particular resources are used. The challenge is sorting out the different cases and the policy implications. The approach outlined here has been extended to account for more complex economic processes such as investment, capital accumulation, and income-dependent demo-graphic change (Anderies, 1998b, 1999), but work
remains to be done on the way policy might affect the dynamics of these systems over time. The type of models and analysis presented here could be very useful in seeking out general principles con-cerning policy in dynamically evolving ecological economic systems.
Acknowledgements
I would like to thank Marco Janssen for helpful comments on early drafts of this manuscript. I also greatly appreciate the comments of three anonymous reviewers which significantly im-proved the manuscript.
References
Anderies, J., 1998a. Culture and human agro-ecosystem dy-namics: the Tsembaga of New Guinea. J. Theor. Biol. 192 (4), 515 – 530.
Anderies, J., 1998b. Culture, Economic Structure and the Dynamics of Ecological Economic Systems. Ph.D. thesis, University of British Columbia, Canada.
Anderies, J., 1999. Demographics, Renewable Resources, and Economic Structure; a Simple Model of Sustainable Devel-opment. Manuscript, CSIRO Wildlife and Ecology, Can-berra, Australia.
Berkes, F., Folke, C. (Eds.), 1998. Linking Social and Ecolog-ical Systems. University Press, Cambridge, UK.
Brander, J.A., Taylor, M.S., 1998. The simple economics of Easter Island: a Ricardo-Malthus model of renewable re-source use. Am. Econ. Rev. 88 (1), 119 – 138.
Clark, C.W., 1990. Mathematical Bioeconomics: The Optimal Management of Renewable Resources. J. Wiley, New York.
Doedel, E., 1981. A program for the automatic bifurcation analysis of autonomous systems. Congr. Numer. 30, 265 – 284.
Edelstein-Keshet, L., 1988. Mathematical Models in Biology. Random House, New York.
Foin, T.C., Davis, W.G., 1984. Ritual and self-regulation of the Tsembaga Maring ecosystem in the New Guinea high-lands. Human Ecology 12 (4), 385 – 412.
Geertz, C., 1963. Agricultural Involution. University of Cali-fornia Press, Berkeley.
Hardin, G., 1968. The tragedy of the commons. Science 162, 1243 – 1248.
Kuznetsov, I.A., 1995. Elements of Applied Bifurcation The-ory. Springer-Verlag, Berlin.
Moran, E.F., 1990. The Ecosystem Approach in Anthropol-ogy. University of Michigan Press, Ann Arbor, MI. Ostrom, E., 1990. Governing the Commons. Cambridge
Uni-versity Press, Cambridge, MA.
Ostrom, E., 1995. Desiging complexity to govern complexity. In: Hanna, S., Munasinghe, M. (Eds.). Property Rights and the Environment. Beijer International Institute of Eco-logical Economics and The World Bank.
Ostrom, E., 1999. Coping with tragedies of the commons. Annu. Rev. Polit. Sci. 2, 493 – 535.
Ostrom, E., Burger, J., Field, C., Norgaard, R., Policansky, D., 1999. Revisiting the commons: local lessons, global challenges. Science 284, 278 – 282.
Rappaport, R.A., 1968. Pigs for the Ancestors: Ritual in the Ecology of a New Guinea People. Yale University Press.
Shantzis, S.B., Behrens, W.W., 1973. Population control mechanisms in a primitive agricultural society. In: Mead-ows, D.L., MeadMead-ows, D.H. (Eds.), Towards Global Equi-librium. Wright-Allen Press.
Tainter, J.A., 1988. The Collapse of Complex Societies. Cam-bridge University Press, CamCam-bridge, MA.
van Coller L., 1997. Automated techniques for the qualitative analysis of ecological models, Conservation Ecology 1 (1), available online at http://www.conecol.org/Journal, vol-ume 1, issue 1, article 5.
Vayda, A., Rappaport, R., 1968. Ecology, cultural and non-cultural. In: Clifton, J. (Ed.), Introduction to Cultural Anthropology, Houghton and Mifflin.
Vayda, A.P., 1969. Environment and Cultural Behavior; Eco-logical Studies in Cultural Anthropology. Natural History Press.