www.elsevier.nlrlocaterjappgeo
Gated stepped-frequency ground penetrating radar
G.F. Stickley
), D.A. Noon
1, M. Cherniakov
2, I.D. Longstaff
3Department of Computer Science and Electrical Engineering, The UniÕersity of Queensland, St. Lucia, Qld 4072, Australia
( )
CooperatiÕe Research Centre for Sensor Signal and Information Processing CSSIP , Australia
Received 14 September 1998; received in revised form 26 February 1999; accepted 16 March 1999
Abstract
Ž .
This paper describes a newly developed stepped-frequency ground penetrating radar SFGPR prototype operating across the 10–620 MHz frequency band. The SFGPR system has been developed to improve the maximum penetration depth
Ž .
capability of ground penetrating radar GPR applications without degradation of resolving power. The radar has the unique capability to employ a short gate at each frequency step that can suppress unwanted strong signals relative to weak reflections from deep targets. The system performance is approximately 175 dB in ungated mode and 170 dB in gated mode, with reference to a 10 ms integration time and a 10 dB signal-to-noise ratio. The current system is suitable for operation in a vehicle and incorporates a real time display similar to conventional impulse GPR. It is capable of recording 50 depth profiles per second. Subsurface images obtained with the gated SFGPR of a perched water table on a sand island, a culvert in high-loss ground, and a 500 lb bomb buried at 1.7 m deep are presented. A frequency compensation procedure is used to improve image clarity. The weakest confirmed underground target has a signal power 100 dB down on the transmitted power. Such a signal would be near the noise floor of a commercial impulse GPR.q2000 Elsevier Science B.V. All rights
reserved.
Keywords: Ground penetrating radar; GPR; Stepped frequency radar; Gating
1. Introduction
Ž .
Commercial ground penetrating radar GPR systems dominantly use impulse transmitters
Ž .
with sampling head receivers Daniels, 1996 . Such receivers are inefficient because many
)Corresponding author. Tel.:
q61-7-3365-3693; fax: q61-7-3365-3684; e-mail: [email protected]
1
E-mail: [email protected].
2
E-mail: [email protected].
3
E-mail: [email protected].
transmitted pulses are required to sample the entire waveform. In addition, the mean power available from the impulse transmitter is limited by the extremely low duty cycle.
The stepped-frequency radar technique offers substantial benefits over current impulse radar systems. The main advantage of the stepped-frequency technique is that it is relatively easy with current technologies to efficiently sample ultra-wideband signals with low speed analog-to-digital converters. Also, due to the transmis-sion of long duration waveforms, a high average transmitted power is much easier to obtain than
0926-9851r00r$ - see front matterq2000 Elsevier Science B.V. All rights reserved.
Ž .
for short-pulse and impulse waveforms. Another advantage of stepped-frequency radar is its agility to skip over frequencies that could
inter-Ž
fere with commercial broadcast stations Poirier,
.
1993 .
Ž .
Robinson et al. 1972 first proposed the
synthesized pulse or stepped-frequency radar
method as a means of improving the penetration performance of GPR without compromising
res-Ž .
olution. Noon et al. 1994 have given a histori-cal review and technihistori-cal description of the Stepped-Frequency Ground Penetrating Radar
ŽSFGPR technique. SFGPR consists of measur-.
ing the complex reflection coefficient of the ground at a number of discrete continuous-wave frequencies, and then transforming to the time domain via a discrete Fourier transform. The main disadvantage with continuous-wave trans-mission with SFGPR is that a strong signal either from leakage between the transmitter and receiver antennas or from shallow reflectors can mask weaker signals from deep reflectors.
Ž
A gated SFGPR Hamran et al., 1995;
Stick-.
ley et al., 1996 combines the high average power and efficient sampling of stepped-frequency radar with the ability of impulse GPR
Ž .
to image deep weak targets in the presence of
Ž .
shallow strong reflectors. In such a system, the stepped-frequency transmissions are pulsed, and a receiver ‘‘gate’’ is used to pass the reflections of targets from desirable depths and ‘‘blank’’ the unwanted reflections. Unlike the sampling head used by most impulse GPR systems, the gated stepped-frequency receiver coherently samples the gated reflections from multiple transmitter pulses, thereby improving the sys-tem performance. It is possible for the stepped-frequency radar to coherently sample reflections from multiple receiver gate depths, although the system described in Section 2 does not have this implemented.
Section 2 of this paper describes the newly developed SFGPR system that operates across the 10–620 MHz frequency band. The gating concept for SFGPR is described in Section 3. Results of the gated SFGPR system arising from
field tests are presented and discussed in Sec-tion 4, with conclusions stated in SecSec-tion 5.
2. Stepped-frequency GPR system
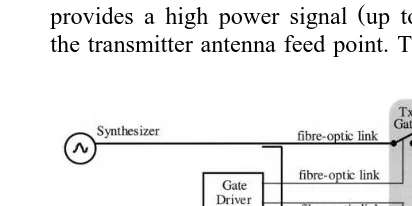
A simplified block diagram of a gated SFGPR system is shown in Fig. 1. The main body of the radar includes a synthesizer, quadrature re-ceiver, digital signal processor and real-time display. The antenna subsystem contains sepa-rate transmit and receive antennas that are con-nected to the main body of the radar via fibre optic links. The antennas used are modified bowtie designs with shielding. The bandwidth and centre frequency of the antennas is approxi-mately 1:1. Similarly to standard GPR systems, antenna subsystems with different centre fre-quencies can be interchanged to suit the applica-tion.
The synthesizer in the current prototype gen-erates a single frequency signal that can be stepped across a frequency band within 10–620 MHz. A portion of the synthesizer output is coupled to the quadrature receiver to provide a phase reference. At each single frequency, the transmitted signal can be rapidly gated on and off by the transmit gate in the antenna subsys-tem. The duty cycle of the gating function is typically 33%. A solid state transmit amplifier
Ž .
provides a high power signal up to 10 W to the transmitter antenna feed point. The received
Fig. 1. Simplified block diagram of the 10–620 MHz
Ž .
signal is amplified prior to being gated by the switch in the receiver antenna. The quadrature receiver determines the amplitude of the re-ceived signal and its phase relative to the refer-ence signal for each frequency step. The receiver system has a noise figure of 8 dB. Frequency domain data from the quadrature receiver is transformed to the time domain using a fast Fourier transform algorithm on a dedi-cated DSP. The time domain response is dis-played on a PC in real-time.
The 10–620 MHz radar has been designed and built specifically for GPR applications.
Un-Ž
like other SFGPR systems e.g., Hamran et al.,
.
1995 , this radar is not based around a commer-cial network analyser. A fast switching synthe-sizer together with a fast settling quadrature receiver is used to enable approximately 50 depth profiles to be collected per second. Inter-changeable antenna subsystems can be used to change the operational frequency.
The main radar subsystem is housed in a shock-mounted, portable 19Y rack that can be accommodated in the back of a 4-wheel drive vehicle. Electrical power can be supplied either at 12 VDC or 240 VAC. Rechargeable batteries power the antenna subsystem providing suffi-cient capacity for a typical day of operation in the field.
System performance is defined as the ratio of mean transmitted power to minimum detectable
Ž .
signal power Plumb et al., 1998 . It is typically used as a ‘‘figure-of-merit’’ for the penetration performance of GPR systems. The minimum detectable signal power should be specified in relation to some acceptable signal to noise ratio
ŽSNR. and integration time. Throughout this
paper we adopt the convention of assuming a 10 dB SNR and a 10 ms integration time unless otherwise stated.
Bench tests of the 10–620 MHz SFGPR
Ž
measured through coaxial attenuators antennas
.
bypassed have confirmed a system perfor-mance of 175 dB in ungated mode and 170 dB in gated mode. In comparison, Wright et al.
Ž1994 estimated the system performances of.
conventional impulse GPR systems to be in the range 100–130 dB without stacking.
Impulse GPR system performance can be improved significantly by using real-time digi-tisers and stacking successive waveforms, and increasing the duty cycle of impulse transmit-ters. In addition, a fast sensitivity time control
ŽSTC is required before the real-time digitiser.
to utilise the improved system performance.
Ž .
Wright et al. 1990 reported an experimental impulse GPR system operating around 10 MHz with these improvements to obtain a theoretical
Ž
system performance for 100 ms integration
.
time of 160 dB, although in practice it was about 145 dB. Coherently summing waveforms during a 10 ms integration time should give a theoretical system performance of 180 dB. However, these improvements to impulse GPR system performance become much more diffi-cult as the operating frequency increases.
3. Gating technique for SFGPR
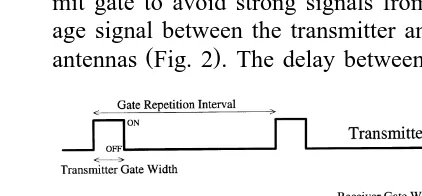
The details for the application of gating for stepped-frequency GPR were first described by
Ž .
Hamran et al. 1995 . The technique involves the pulsing of the transmitter and gating of the receiver for each frequency step. The timing of the receiver gate is delayed relative to the trans-mit gate to avoid strong signals from the leak-age signal between the transmitter and receiver
Ž .
antennas Fig. 2 . The delay between the
Fig. 3. Variation of received signal strength with delay to target for gated SFGPR. Transmitter and receiver gates both have width of 10 ns. The gate repetition interval
ŽGRI is 50 ns and receiver delay is 20 ns. Note that peak.
system performance is less than the system performance of
Ž .
an ungated system by 1rduty cycle , which in this case is 7 dB.
mit and receive gates must be adaptive so that targets at different depths can be imaged. Four important gating parameters illustrated in Fig. 2 are Gate Repetition Interval GRI, Receiver Gate Delay D , Receiver Gate Width W , and Trans-R R
mitter Gate Width W . The duty cycle of theT
transmitter gate is gTsWTrGRI and of the receiver gate isgRsWRrGRI.
Assume that there is a single target with two-way delay of t seconds. Further, consider
Ž .
only a single frequency vr2p . In ungated mode, the received signal after the receive gate can be written as:
Sungatedsasin
Ž
vŽ
tyt.
qf.
Ž .
1where a is a constant and f is a phase angle. In gated mode, the received signal after the receive gate can be written as:
tyDR tyDR
Sgateds III
ž
/
=Pž
/
GRI WR
= III
ž
tyt/
=Pž /
tytGRI WT
=Sungated
Ž .
2Ž . ` Ž .
where III t sSisy`d tyi for all integer i;
Ž .
P t s1 fory0.5-t-0.5, 0 elsewhere;='
the convolution operator.
To simplify the algebra, assume that the transmitter and receiver gates have equal widths
ŽWTsWRsW. and hence equal duty cycles ŽgTsgRsg.. Combining the comb functions result in:
tyV tyV
Sgateds III
ž
/
=Pž
/
GRI Wc
=asin
Ž
vŽ
tyt.
qf.
Ž .
3< <
where VstqDRr2 and WcsWytyDR if
<tyDR<-W; Wcs0 otherwise.
If there is overlap between the transmitter gate and the delayed receiver gate, then the received signal is a gated sinusoid. Outside of the overlap is no received signal. In the fre-quency domain a gated sinusoid is a windowed line-spectra centred on the frequency of the
gated sinusoid. A filter within the quadrature receiver rejects all frequencies except that of the ungated sinusoid. Therefore, it is helpful to find the frequency component of the received signal that has the same frequency as the ungated sinusoid. An approximate expression for this component is:
Sgated original component
Wc
f
ž /
asinŽ
vŽ
tyt.
qf.
GRI
Wc
f
ž /
SungatedŽ .
4GRI
Thus, the useful received power from a gated system reaches a maximum when the delayed transmitter gate and the receiver gate coincide in time. The reduction in received power verses
Ž .2
target delay t is proportional to, WcrGRI ,
the square of the duty cycle of Sgated. Fig. 3 shows the ‘‘window’’ relationship where trans-mitter and receiver gates are 10 ns wide, the gate repetition interval is 50 ns and the receiver gate delay is 20 ns. Targets with delays outside the gating ‘‘window’’ are suppressed relative to targets with delays inside the gating ‘‘window’’. The ‘‘window’’ can be moved out in range by changing the receiver gate delay.
Ž
The system performance described in Sec-tion 2 as the ratio of the mean transmitter power
.
and the minimum detectable signal of a gated system is less than that of an ungated system. For a gated system the mean transmitter power is decreased by the transmitter gate duty cycle
Ž
gTsWTrGRI assuming the peak transmitter
.
power remains unchanged . The resulting fre-quency domain is a series of line-spectra, of which the quadrature receiver uses only a single frequency line. Hence, the useful received power
is also reduced by the transmitter gate duty cyclegT.
In most circumstances the minimum de-tectable signal for a gated system MDSgated will be decreased relative to the minimum detectable signal for an ungated system MDSungated. An important criterion is that the dominant contri-bution to the background noise in the quadrature receiver is from a source located before the receiver gate. This noise source should remain the dominant noise source irrespective of whether the radar is gated or ungated. Typically this source is the thermal noise arising within the first receiver amplifier. The above criterion is usually met provided that the receiver
ampli-Ž .
fier gain in dB plus the receiver amplifier
Ž .
noise figure in dB is much greater than 1rgR
Žin dB , where. gRsWRrGRI is the receiver gate duty cycle. Given this criterion, the
back-ground noise power of the quadrature receiver in a gated system will decrease by 1rgR com-pared to an ungated system.
Combining the reductions associated with mean transmitter power, useful received power and minimum detectable signal of a gated sys-tem, results in a system performance degrada-tion of g2rg over an ungated system. If the
T R
duty cycles of the transmitter and receiver gates
Ž .
are the same i.e., gTsgRsg , then the sys-tem performance of a gated syssys-tem degrades by a factor of g over an ungated system. This is the reason for the peak of the gating ‘‘window’’ in Fig. 3 being 7 dB below the system perfor-mance of an ungated system.
The system performance of the 10–620 MHz SFGPR in gating mode is 170 dB. Tests have also showed that strong targets can be sup-pressed by at least 80 dB through gating.
4. SFGPR field tests
The output display of the SFGPR is quite similar to that of an impulse GPR. A bipolar pulse can be synthesized as shown in the exam-ple of Fig. 4. A colour image can be displayed with hot colours to show the negative swings of the synthesized received pulse and cool colours to show the positive swings. However, the grey
Ž .
scale images in this paper e.g., Fig. 5 uses grey shades. The use of a logarithmic palette allows the images to be displayed without the need for software sensitivity time control. The grey scale bars enable the signal power of re-ceived reflections to be read directly from the image.
The radar has been tested on several different occasions along the banks of a perched freshwa-ter lake on a sand island near Brisbane,
Aus-Ž .
tralia Stickley et al., 1997 . The sand is rela-tively uniform and has very low attenuation. The underground water table extends under the
sand from the lake, and provides a strong though sometimes broken interface reflector.
Fig. 5 shows the ungated SFGPR image of the perched water table on the sand island as the antennas were moved up an incline away from the lakeshore. Using the methodology presented
Ž .
by Noon et al. 1998 , it is possible to estimate the strength of the water table reflector. For this, the following assumptions and estimations are made; antenna gain balances the antenna
ineffi-Ž
ciencies; sand has a Qs64 i.e., virtually
loss-.
less ; reflection loss at the water table is 11 dB;
Ž
reflector depth is 2.5l for 100 MHz centre
.
frequency and 25 ns one-way . Using the rough planar interface graph for the water table
reflec-Ž .
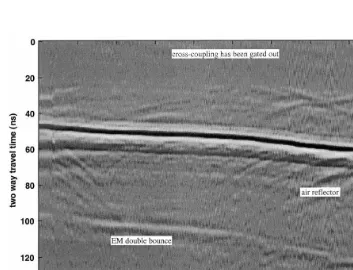
tor Noon et al., 1998 , a received signal loss of 54 dB is estimated. This estimation is in good agreement with 55 dB loss determined in Fig. 5. Fig. 6 shows the gated image obtained during a subsequent survey to that of Fig. 5. The power level is adjusted to take into account the duty cycle loses of gating mode. The gate was set so
that all returns with delays less than 30 ns were rejected. The strongest target in the image is the water table at 62 dB loss. The 7 dB discrepancy with the ungated image is due to the partial overlap of the receiver gate and reflector delays. An electromagnetic double bounce can be seen clearly in Fig. 6. It arises when the echo from the water table reaches the surface and is reflected to make a second round trip. As a result its phase is inverted relative to the origi-nal sigorigi-nal and it occurs at twice the delay time of the main water table reflection. Both these features are seen in the image. The double bounce signal overlaps the centre of receiver gate almost completely and hence reads at the correct power.
Using the similar assumptions and methodol-ogy as with Fig. 5, the estimated signal loss of 84 dB for the double bounce in Fig. 6 compares well with the actual measurement of 85 dB in the image.
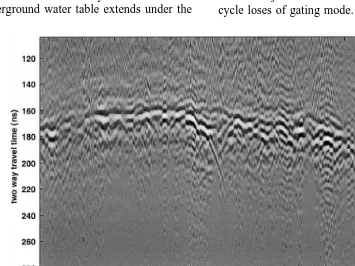
Fig. 7 shows a gated image of the water table recorded on an elevated sand hill further away from the perched lake. The reflection depths are much deeper, and the variation in travel time to the water table mirrors the surface topography. At these depths, the water table is not as contin-uous as the previous shallow images. With the use of gating, the cross-coupling signal has been reduced by more than 60 dB compared with ungated mode. Using similar methodology as earlier, the estimated signal loss for the water table reflection is 75 dB. This is in good agree-ment with Fig. 7, where the water table signal loss varies between 70 dB and 80 dB.
The SFGPR has also been trialed at the Uni-versity of Queensland campus. The image in
Ž .
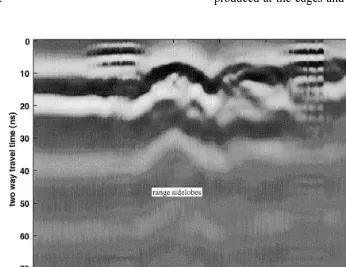
Fig. 8 was taken of a shallow f50 cm deep rectangular culvert on the banks of the Brisbane river. Although the signal losses from the
cul-Ž .
vert are very high )62 dB , reflections are produced at the edges and within the culvert.
Fig. 9. Mean power of each frequency component for the data shown in Fig. 8. The straight-line approximation is part of the frequency compensation procedure used to produce Fig. 10.
The highly attenuating soil in this area causes the higher frequencies to be significantly re-duced in strength in comparison with the low frequencies. This is evident in Fig. 9, which
Ž .
shows the mean power at each frequency step taken across many depth profiles in Fig. 8. The severe attenuation at higher frequencies causes a reduction in the resolving power, and the ap-pearance of significant range-sidelobes in the image.
Because this data has abundant signal-to-noise ratio, the frequency domain data can be weighted to form a white spectrum. Fig. 9 portrays a manually fitted straight line through the fre-quency domain that is used to whiten the spec-trum. Weightings are applied to the frequency domain data such that this line becomes hori-zontal. In order to keep power levels consistent with the uncompensated image, the weighting applied to the centre frequency is constrained to be unity. A Hamming window is also applied after the frequency correction step to reduce the range-sidelobe level.
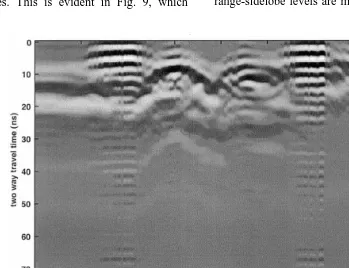
Fig. 10 is the resulting frequency compen-sated counterpart to Fig. 8. The resolution and range-sidelobe levels are much improved.
Fig. 11. Gated radar image of a 500 lb bomb buried at 1.7 m. The bomb hyperbola is clear; as is the interruption by the trench of a natural layer in the ground.
The weakest confirmed underground target imaged with the gated SFGPR is a 500 lb bomb buried 1.7 m in the ground. Fig. 11 shows a
Ž .
radar image with frequency compensation taken crossing the burial trench at right angles. The bomb was buried over ten years ago and the trench was carefully backfilled such that it is not visible from the surface. The peak signal strength taken from the bomb hyperbola of Fig. 11 is 100 dB below the transmitted power, with the signal from the bomb at least 40 dB above the noise, and with the transmitter power still 15 dB below maximum.
The dynamic ranges of commercial impulse GPR systems are limited to 55 dB in the
sam-Ž .
pling head Daniels, 1996 . This dynamic range limits the weakest signal that can be seen in the presence of a strong signal. At the bomb site of Fig. 11, the cross-coupling signal was 40 dB. Hence the bomb would not have been observed
Ž
with a commercial impulse GPR with similar
.
antennas .
5. Conclusions
This paper has presented the field results obtained with a new gated SFGPR system. High quality images have been produced of targets with up to 100 dB of signal loss. This is far short of the 170 dB potential that has been demonstrated on the laboratory bench, but is believed to be better than commercial impulse GPR systems. More suitable test sites and side-by-side comparison trials are necessary to demonstrate the full potential of the system.
of the ground at each frequency step is the next step in extending this procedure. A further en-hancement will be to vary the energy at each frequency step by progressively increasing the
Ž
integration time with frequency Cherniakov,
.
1996 .
Acknowledgements
Our thanks to Consolidated Rutile for provid-ing the North Stradbroke Island field test site and information about the hydrogeology. Thanks
Ž .
also to Geophysical Technology GTL for pro-viding access to their bomb test site. Some of the work reported in this paper was part of the Stepped-Frequency Ground Penetrating Radar Project, funded under the Generic Technology Grant Agreement No. 16040 between the Indus-try Research and Development Board, The Uni-versity of Queensland, MITEC Australia, CRA, Georadar Research Pty, and the Cooperative Research Centre for Sensor Signal and Informa-tion Processing.
References
Cherniakov, M., 1996. Optimal step frequency signals for a ground penetrating radar. Electronics Letters 32, 62– 64.
Daniels, D.J., 1996. Surface-penetrating radar. The Institu-tion of Electrical Engineers, London, UK.
Hamran, S.-E., Gjessing, D.T., Hjelmstad, J., Aarholt, E., 1995. Ground penetrating synthetic pulse radar: dy-namic range and modes of operation. Journal of Ap-plied Geophysics 33, 7–14.
Noon, D.A., Longstaff, I.D., Yelf, R.J., 1994. Advances in
the development of step frequency ground penetrating radar. Proceedings of the Fifth Int. Conf. on Ground
Ž .
Penetrating Radar GPR’94 , Kitchener, Ontario, Canada, pp. 117–132.
Noon, D.A., Stickley, G.F., Longstaff, I.D., 1998. A fre-quency independent characterisation of GPR penetra-tion and resolupenetra-tion performance. Journal of Applied
Ž .
Geophysics 40 1–3 , 127–137.
Plumb, R.G., Noon, D.A., Longstaff, I.D., Stickley, G.F., 1998. A waveform-range performance diagram for ground-penetrating radar. Journal of Applied
Geo-Ž .
physics 40 1–3 , 117–126.
Poirier, M.A., 1993. Comparison of band pulsed and stepped frequency pulse radar concepts for GPR appli-cations. Proceedings of the Second Government Work-shop on Ground Penetrating Radar — Technologies and Applications, Columbus, OH, USA, pp. 221–222. Robinson, L.A., Weir, W.B., Young, L., 1972. An RF time-domain reflectometer not in real time. IEEE Transactions on Microwave Theory and Techniques 20
Ž12 , 855–857..
Stickley, G.F., Noon, D.A., Cherniakov, M., Longstaff, I.D., 1996. Current development status of a gated stepped-frequency GPR. Proceedings of the Sixth Int.
Ž .
Conf. on Ground Penetrating Radar GPR’96 , Sendai, Japan, pp. 311–315.
Stickley, G.F., Noon, D.A., Cherniakov, M., Longstaff, I.D., 1997. Preliminary field results of an
ultra-wide-Ž .
band 10–620 MHz stepped-frequency ground pene-trating radar. 1997 IEEE International Geoscience and Remote Sensing Symposium Proceedings, Singapore, pp. 1282–1284.
Wright, D.L., Hodge, S.M., Bradley, J.A., Grover, T.P., Jacobel, R.W., 1990. A digital low-frequency, surface-profiling ice-radar system. Journal of Glaciology 36
Ž122 , 112–121..
Wright, D.L., Bradley, J.A., Grover, T.P., 1994. Data acquisition systems for ground penetrating radar with example applications from the air, the surface, and boreholes. Proceedings of the Fifth Int. Conf. on Ground
Ž .