www.elsevier.com/locate/eja
Corn yield and fertilizer N recovery in water-table-controlled
corn–rye-grass systems
Xiaomin Zhou
a
, Chandra A. Madramootoo
b
, Angus F. MacKenzie
c
,
J.W. Kaluli
b
, Donald L. Smith
a,
*
aDepartment of Plant Science, Macdonald Campus, McGill University, 21,111 Lakeshore Road, Ste Anne de Bellevue H9X 3V9, QC, Canada
bDepartment of Agricultural Biosystem Engineering, Macdonald Campus, McGill University, 21,111 Lakeshore Road, Ste Anne de Bellevue H9X 3V9, QC, Canada
cDepartment of Natural Resource Sciences, Macdonald Campus, McGill University, 21,111 Lakeshore Road, Ste Anne de Bellevue H9X 3V9, QC, Canada
Accepted 16 September 1999
Abstract
Concern about NO−3 leaching and groundwater pollution from corn monoculture has prompted an investigation of alternative production systems that reduce leaching. It is hypothesized that both intercropping and water-table control could increase N uptake and reduce the quantity of N that might be lost due to leaching. This study compared corn (Zea maysL.) with annual Italian rye-grass (Lolium multiflorumLam) intercropping and corn monocrop systems under three controlled drainage levels [free drainage (water table 1 m below soil surface), and water-table depths maintained at 0.70 or 0.80 m, below the soil surface via subirrigation]. Annual Italian rye-grass was planted 10 days after the corn was planted. Grain yield, above-ground dry-matter production, N uptake and fertilizer N recovery ( FNR) were assessed over 2 years on a fine, silty, mixed, non-acid, frigid Typic Humaquept sandy loam soil. Corn grain yields were unaffected by the annual rye-grass/weed component of the intercropping system or the various water-table depths in either year. Intercropping increased the total above-ground dry-matter production by 3.2 and 2.4 Mg ha−1and N uptake by 71 and 49 kg ha−1in 1993 and 1994, respectively. Fertilizer N recovery from corn was not different between the two cropping systems. Water table depth had no effect on grain yield and N uptake. Previous published results from the same site indicated decreased soil N-NO−
3 content in the top 1 m of the soil profile in the
fall of 1993 and less denitrification due to intercropping, demonstrating that a corn–annual rye-grass intercropping system, especially with rye-grass establishing well later in the season, may be an effective practice for increasing soil N uptake without reduction of corn grain yield when adequate N and moisture are present. © 2000 Elsevier Science B.V. All rights reserved.
Keywords:Annual Italian rye-grass; Corn (Zea maysL.); Intercropping; Plant N uptake; Water-table control
* Corresponding author. Tel.:+1-514-398-7851; fax:+1-514-398-7897.
E-mail address:[email protected] (D.L. Smith)
1. Introduction up to 31% when alfalfa (Medicago sativaL.) was interseeded at the time of corn planting.
Water-table control is recommended as a man-There is growing concern that leaching of
agement practice to reduce NO−3-N pollution from
NO−3-N from soil used for monoculture corn
pro-agricultural land and increase crop yield ( Kalita
duction constitutes a major source of NO−3-N
and Kanwar, 1993; Madramootoo et al., 1993). pollution of groundwater (Martel and MacKenzie,
Research by Evans et al. (1995) has shown that
1980; Liang et al., 1991). In Quebec,
controlled drainage reduced N and P transport in
Madramootoo et al. (1992) found 40 mg of NO−3
-drainage water by 30 and 50%, respectively,
com-N l−1in drainage water from a potato field. This
pared to conventional drainage. Meek et al. (1970) exceeds the Canadian water quality guideline
reported reductions of soil NO−3-N by up to 50%
(10 mg NO−3-N l−1) for domestic water supplies.
through water-table control, due to denitrification. The adverse health and environmental impacts of
Compared to conventional, free-outlet drainage, a
NO−3-N contaminated groundwater make it
imper-water-table depth range from 0.6–0.9 m reduced
ative to determine NO−3-N leaching losses from
the overall NO−3-N levels in the soil profile by up cropland and to investigate crop production
prac-to 50% and increased soybean yield by 20%
tices that could reduce leaching.
(Madramootoo et al., 1993). Kalita and Kanwar
Grass species are very effective in reducing
(1992) reported that water-table depths from 0.6
NO−3-N leaching (MacLean, 1977; Steenvoorden,
to 1 m increased corn yield, while water-table
1989). Annual Italian rye-grass (Lolium
depths of 0.2–0.3 m reduced corn grain yields due
multiflorum Lam), with its high dry-matter
pro-to waterlogging. However, Chaudhary et al. (1975) duction and extensive root system, increases soil
concluded that corn response to water-table depths
organic matter, improves soil structure, reduces varied with rainfall during the growing season.
soil erosion, and decreases the loss of NO−3-N They found that grain yield increased as the
water-through leaching, by uptake of soil NO−3-N table depth increased under wet conditions but
(Schery, 1961; Musser and Pekins, 1969; Kunelius decreased as the water-table depth increased under
et al., 1984; Bergstrom, 1986; Groffman et al., dry conditions.
1987). The ability of rye-grass to absorb and No previously reported work has evaluated the
recycle NO−3-N can be exploited in corn pro- combination of both intercropping and water-table
duction systems to decrease soil NO−3-N and control as a method of increasing N uptake during
reduce leaching of soil NO−3-N (Claude, 1990). the growing season without decreasing corn yield
Intercropping systems can make more efficient use at harvest. Here, the term intercropping refers to
of light, water and nutrients than crops grown the practice of seeding annual Italian rye-grass
separately. Thus, it is possible to increase N uptake between corn rows 10 days after corn planting and
by corn intercropped with annual rye-grass during plowing the corn stover and rye-grass residues into
the soil after corn harvest. Our objective in this the growing season, thereby reducing potential
work was, under conditions of sufficient N supply, NO−3-N leaching by winter rains. Corn yields were
to compare corn yield, uptake of N and N use
unaffected when corn was intercropped with
efficiency as affected by an annual Italian rye-grass legumes or grass species such as rye and rye-grass
intercrop component and controlled water-table (Scott et al., 1987; Chang and Shibles, 1985).
depths (via subirrigation). Intercropped sweet corn yields were comparable
to monocrop yield when intercropped with white
clover (Trifolium repens L.), ladino clover (T.
2. Materials and methods
repens L. forma lodigense Hort. ex Gams.) and
alfalfa seeded at corn planting time or 4 weeks 2.1. Field conditions
later ( Vrabel, 1981). However, Nordquist and
Wicks (1974) reported that corn dry matter was An experiment was conducted during the 1993
and 1994 growing seasons, in Soulanges County,
Quebec, Canada. The field had been used for corn Brillion, USA) on 6 June 1993 and 9 June 1994, respectively.
production during the 2 years prior to the
experi-Monocrop corn plots were treated with
ment. Although the top soil was well drained
4.0 l ha−1 atrazine
(2-chloro-4-ethylamino-6-Soulanges very fine sandy loam (fine, silty, mixed,
isopropylamino-1,3,5 triazine) in both years. non-acid, frigid Typic Humaquept), clay layers
Herbicide was not applied to intercropped treat-deeper in the soil profile impeded natural drainage.
ments in 1993. In 1994, however, 2.25 l ha−1 basa-The characteristics of the soil layer (0–100 cm)
gran [bentazon; 3-(1-methylethyl )-(1H
)-2,1,3-are as follows: the top soil (0–20 cm) is a sandy
benzothiadiazin-4(3H )-one 2,2-dioxide] were
loam with organic matter 50 g kg−1; total N
applied to the intercrop treatment to control
4.5 Mg ha−1and pH 5.5; the sub-soil layer (0.20–
broad-leaf weeds. Ragweed (Ambrosia
artemisii-0.50 cm) is a sandy clay-loam, and the clay soil
folia L.) was the main weed in the intercropping
layer extends from 0.50 to 100 cm. The surface
plots in 1993, while barnyard grass (Echinochloa
topography is generally flat (average slope
crusgalliL.) was the main weed in 1994.
<0.3%).
The applied treatments included two cropping
2.2. Water-table control
systems [monocrop corn (cv. Pioneer 3921) and a
corn–annual Italian rye-grass (cv. Barmultra)
Two buildings (each 5 by 5 m) were constructed intercrop], and three levels of water-table control
at the site for water-table control and to monitor (conventional free-outlet subsurface drainage, and
drainage water flow. A subsurface drainage lateral two subirrigation controlled water-table levels with
(76 mm i.d.) was centrally located in each plot average water-table depths of 0.70 and 0.80 m,
with 0.3% slope along the length of each plot in
respectively, below the soil surface). The average
the same direction as the natural drainage. The water-table depth of the free drainage treatments
average depth of these laterals was 1 m. The down-over the two growing seasons of this study was
stream end of each drainage lateral was connected 1.0 m. The controlled water-table depths had
origi-to a 5 m length of a non-perforated PVC pipe with nally been set for 0.50 and 0.75 m, but due to
a 51 mm diameter. These non-perforated PVC seepage and evapotranspiration, the water-table
pipes entered the instrument buildings. The water-depths could only be maintained at 0.70 and
table depth was maintained by water tanks located 0.80 m, respectively. The resulting six treatment
in the instrument buildings ( Tait et al., 1995;
combinations were fertilized with 270 kg N ha−1 Kaluli, 1996). Each plot was separated by a double
each spring, the N rate resulting a maximum corn thickness of 6 mil polyethylene plastic buried
verti-production for this area (Liang and MacKenzie, cally below the soil surface to a depth of 1.5 m.
1994). The design of this experiment was a ran- The purpose of this plastic sheet was to reduce
domized complete block with three blocks. intra-plot seepage. A complete description of the
Each plot had a surface area of 1125 m2(15 by entire water management research facility was
75 m) and contained a total of 20 corn rows, with reported previously ( Tait et al., 1995).
0.75 m between adjacent rows. Corn was planted
on 27 May 1993 and 31 May 1994, respectively. 2.3. Plant sampling and analyses
The population densities were 6.3 and
7.1 plants m−2in 1993 and 1994, respectively. The 2.3.1. Corn plants
lower corn density in 1993 was caused by soil Ten corn plants were randomly chosen at three
compaction due to spring planting conditions, subsampling sites within each plot and
hand-har-which forced seeding into very wet soil. Before the vested on 12 October 1993 and 13 October 1994.
corn emerged, annual Italian rye-grass was sown The remaining corn plants in each plot were
com-between the corn rows of intercrop treatment plots bine-harvested for grain. Corn stover ( leaves plus
at a rate of 28 kg ha−1 using a forage seeder stalks) was plowed (moldboard plow,
Corn plant subsamples harvested from each plot randomly, starting at the fourth or fifth row from the border of the larger plots. These unfertilized were used to determine grain yield and dry-matter
production. The harvested plants were separated areas were marked to prevent any unlabeled N
fertilizer application to the areas inside them, they into leaves, stalks and grain, then weighed,
chopped, subsampled, forced-air-dried (70°C ), were later used for 15N microplots in each year.
After the corn emerged, a 1.15 by 1 m area ( Zhou and finally weighed again. Final grain yields in
both years were expressed at 0% moisture. Dried et al., 1998) within the marked area (2.25 by 3 m)
was selected as the15N microplot. To delimit the
composite subsamples of grain, leaf and stalk
samples were ground with a Wiley mill (A.H. microplot, a solid plastic barrier was hammered
into the soil along both sides and both ends of Thomas Co., Philadelphia, PA) to pass through a
2 mm sieve for plant-tissue and grain total N each microplot to a depth of 20 cm. A solution of
15NH
415NO3at 5%15N excess was sprayed evenly determinations.
in the microplot at the same rate of N fertilizera-tion (270 kg ha−1) as the rest of the large plot on 2.3.2. Rye-grass and weeds
To allow estimation of the total above-ground 17 June 1993 and 16 June 1994, respectively.
Immediately following the placement of the micro-dry-matter production and N uptake, three areas
(0.75 by 0.5 m) of intercrop rye-grass and weeds plot, the rest of the unferilizered area was
hand-fertilized with 34–0–0 NH
4NO3at the same rate
were harvested in the intercropped plots at the
same time as the corn was harvested in both years. as the rest of the large plot. Corn in the microplots
was harvested at the same time as the larger plots The rest of rye-grass and weeds were ploughed
into soil after harvest in both years. The rye-grass were harvested, as three separate sampling groups
taken 50, 30 and 10 cm from both ends of the and weeds were separated by hand and dried to a
constant weight in a forced-air dryer (70°C ) for microplots. All harvested plant samples were
sepa-rated into leaves, stalks, and grain. Harvested estimation of dry-matter production. Subsampled
rye-grass and weeds were ground for estimation samples were dried to a constant weight at 70°C.
Total N was determined as described above. The of total N content.
Total plant N was determined by Kjeldahl titration solutions from the Kjeldahl analysis were
used for 15N analysis (Martin et al., 1991). The
analysis ( Tecator, Kjeltec 1030 auto analyzer,
Ho¨gana¨s, Sweden) using the method of Bradstreet percentage 15N atom enrichment in the plant
samples was determined by emission spectroscopy (1965). Nitrogen uptake by corn, rye-grass and
weeds was determined from the total N concen- using a JASCO –15015N analyzer (JASCO, LTD,
Tokyo, Japan). Fertilizer nitrogen recovery ( FNR) tration of plant tissues and dry weights at the end
of each season. was calculated by the following equation:
2.3.3. 15N microplot establishment
Fertilizer N recovery (%)=p(c
−b)×100
f(a−b) ,
In both years, 141 kg K ha−1 were applied
before planting in all plots. At planting,
52 kg P ha−1, as 18–46–0 (N–P
2O5–K2O), were whererye-grass, or weeds,p is the total N in corn grain, corn stover,fis the amount of N fertilizer applied into in each plot, respectively. Nitrogen
fertilizer was split into two applications: applied, and a, b, and c, are the atom% 15N
concentrations in the fertilizer, unlabeled control
47 kg N ha−1as 18–46–0 (N–P
2O5–K2O) at
plant-ing and 223 kg N ha−1 as 34–0–0 NH
4NO3 plants, and labeled plants, respectively.As 15N enrichment of plant tissue was 2 weeks after planting.
To determine the fertilizer N recovery, two unaffected by plant position within the microplot
(Zhou et al., 1998), we used the percentage 15N
15N microplots on opposite sides of each of the
larger plots were established in two blocks in this enrichment from the plants at the central position
to calculate the fertilizer nitrogen recovery ( FNR). study. Before N fertilizer application in 1993 and
values to the entire plot, the total N values of season (May to October) was 98 mm below the 20 year average.
plant tissue from outside the microplots were used to calculate FNR.
Three sampling groups of rye-grass and weeds 3.1. Grain yield and total aboveground dry-matter
production were harvested in the same manner as the corn
plants within the microplots. In order to obtain a
reliable15N recovery (Jokela and Randall, 1987), Corn grain yields were unaffected by the
pres-ence of rye-grass and weeds in either year the rye-grass and weeds were sampled at least
0.38 m from the end of the microplots. The (Table 1). The average intercropped corn yield
was similar to the 3 year mean yield of
sampled rye-grass and weeds were separated by
hand, dried, weighed and ground. Total N and monocropped corn in Quebec (Liang and
MacKenzie, 1994). Similar results have been noted
15N were determined as described above for corn
plants. previously with intercropped legumes ( Kurtz et al.,
1952; Searle et al., 1981). Scott et al. (1987) found
that corn yield was unaffected by the presence of
2.4. Data analysis
underseeded intercrop components if the latter were seeded when the corn was 0.15–0.30 m high. Data were analyzed using analysis of variance
with the SAS PROC GLM (General Linear In our experiment, the rye-grass was planted about
9 days after the corn. The rye-grass started to Models) procedure (SAS Institute, 1985) and
single-degree-of-freedom contrasts. Because there emerge when the corn plants were about 0.30 m
tall in both years. Indigenous weeds had not fully was no cropping system by water-table depth
interaction for any of the measured variables, this established by that time. Therefore, the lack of
strong competition from the rye-grass or weeds interaction has been omitted from the tables.
during the early growth stages and sufficient N
(270 kg N ha−1applied ) to minimize any
competi-tion between the corn, weeds or rye-grass for this
3. Results and discussion
soil nutrient was probably responsible for the lack of reduction in corn grain yield in both years. At Precipitation levels varied between the two
growing seasons ( Fig. 1). The 1993 growing season harvest, corn grain yield was higher in 1994 than
1993, probably due to sufficient rainfall in the June was relatively wet, with accumulated rainfall from
May to October, inclusive, being 30 mm above the of 1994, which resulted in a better corn emergence
in 1994 than 1993, and thus a greater grain yield. 20 year average. By comparison, the 1994 growing
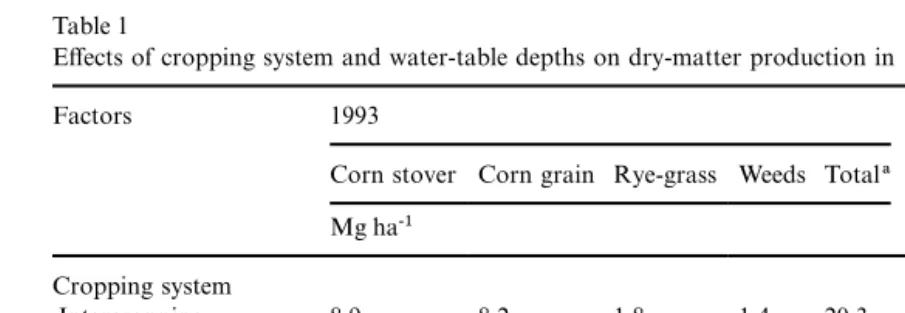
Table 1
Effects of cropping system and water-table depths on dry-matter production in 1993 and 1994 growing seasons
Factors 1993 1994
Corn stover Corn grain Rye-grass Weeds Totala Corn stover Corn grain Rye-grass Weeds Total
Mg ha-1 Mg ha-1
Cropping system
Intercropping 8.9 8.2 1.8 1.4 20.3 7.9 9.4 0.4 2.0 19.6
Monocropping 9.0 8.0 0.0 0.0 17.1 8.1 8.8 0.0 0.0 17.0
Significance ofPalues ns ns – – 0.05 ns ns – – 0.05
Water-table control
Water table 70b 8.9 8.2 0.9 0.7 18.5 7.8 8.9 0.2 1.2 18.0
Water table 80 9.3 8.3 1.0 0.6 19.1 7.7 9.1 0.3 1.0 18.0
Water table 100 8.8 8.0 0.9 0.8 18.5 8.6 9.4 0.2 1.0 19.2
Significance ofPvalues ns ns ns ns ns 0.06 ns ns ns ns
aTotal dry matter in the monocropping system=corn grain+stover, in the intercropping system=corn (grain+stover)+ rye-grass+weeds.
bWater table at 70, 80, and 100 cm below the soil surface, respectively; ns: not significant atP>0.1.
The total above-ground dry-matter production observed in 1994 than in 1993. This may suggest
that the summer moisture stress observed in 1994,
ranged from 17 to 20 Mg ha−1 in this study
( Table 1). Intercropping increased the mean total although not severe, was sufficient to limit corn
stover dry-matter production. In addition, the
dry-matter production by 3.2 Mg ha−1 and
2.6 Mg ha−1in 1993 and 1994, respectively, com- decreased stover dry matter by the end of the 1994
growing season may also indicate a greater effi
-pared to the monocropping system. Rye-grass and
weeds contributed 16 and 12% of the total above- ciency of translocation of photosynthate into grain
in 1994 (Zhou et al., 1997). Grain yield and total ground dry-matter production in 1993 and 1994,
respectively. above-ground dry-matter production were
unaffected by water-table depths. This lack of
The total biomass production by rye-grass in
this study (0.4 to 1.8 Mg ha−1) was similar to that effect may have been due to the small differences
in water-table depths during this study. reported by other intercrop researchers in this
region (e.g. Hope-Simpson, 1992). A greater total
intercrop biomass was measured in 1993 than in 3.2. Nitrogen uptake
1994. This was primarily due to the greater biomass
of rye-grass in 1993. The poor establishment of Intercropping systems took up 71 and
49 kg N ha−1more than the monocrop systems in
rye-grass in 1994 was probably due to its poor
germination as a result of the wet soil conditions 1993 and 1994, respectively ( Table 2). In 1993,
rye-grass and weeds comprised 19 and 8%,
respec-at planting time in June ( Fig. 1), stronger
competi-tion due to an earlier establishment of weeds tively, of the total above-ground N uptake in the
intercropping treatments. Weeds dominated the relative to rye-grass, and drought stress in July
(43 mm rainfall less than 20 year average). Weeds rye-grass in 1994, and comprised 76% on a dry
weight basis of the total weed–rye-grass mixture. comprised a large proportion of the harvested
ground cover biomass in 1994. The greater rye-grass biomass in 1993
(1.8 Mg ha−1) than 1994 (0.4 Mg ha−1) resulted
Stover biomass was unaffected by intercropping
in both years. Shallow water-table depths reduced in 41 kg ha−1 more N accumulation in the
rye-grass in 1993 than 1994. The rye-rye-grass did not
stover dry-matter biomass by 10%when compared
to conventional drainage in 1994, but only at develop well early in the 1993 season due to strong
competition from weeds, especially ragweed.
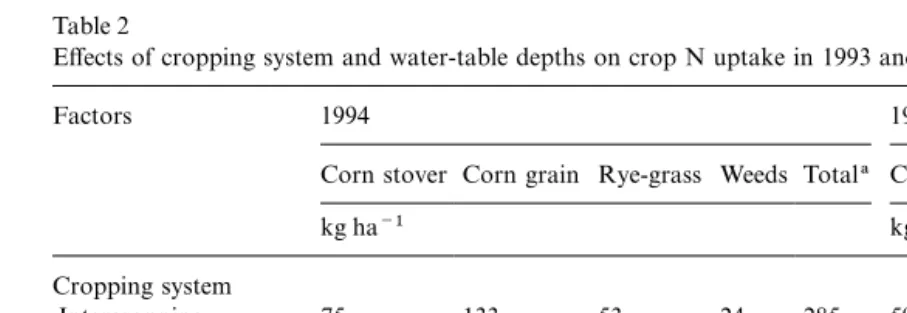
Table 2
Effects of cropping system and water-table depths on crop N uptake in 1993 and 1994 growing seasons
Factors 1994 1994
Corn stover Corn grain Rye-grass Weeds Totala Corn Stover Corn Grain Rye-grass Weeds Total
kg ha−1 kg ha−1
Cropping system
Intercropping 75 133 53 24 285 59 134 12 39 244
Monocropping 85 129 0 0 214 64 131 0 0 195
aTotal dry matter in the monocropping system=corn grain+stover, in the intercropping system=corn (grain+stover)+ rye-grass+weeds.
bWater table at 70, 80, and 100 cm below the soil surface, respectively; ns: not significant atP>0.1.
However, 2 months before corn harvest, the rye- followed a pattern similar to dry-matter
pro-duction ( Table 2). Neither water-table depth nor grass had achieved a good establishment due to
the senescence of weeds. This suggests that the cropping system affected corn grain N uptake.
Grain N accumulations were 131 and
establishment of rye-grass after weed senescence
greatly increased N accumulation. The lesser N 133 kg ha−1in 1993 and 1994, respectively. A lack
of water-table depth effect on monocropped grain
uptake by rye-grass in 1994 than 1993 was
consis-tent with lower rye-grass dry-matter production. N uptake was also noted by Chaudhary et al.
(1975). The intercropping system resulted in less These results showed that a rye-grass intercrop
can increase N conservation if there is adequate N (12%) in corn stover than in the monocropping
system in 1993, but only atP≤0.06.
moisture and less competition from weeds. Across water-table depths, results from the same study
also demonstrated that intercropping treatment 3.3. Fertilizer nitrogen recovery
decreased NO−3-N in the top 1 m of the soil profile
by 47%(92.3 kg N ha−1) relative to monocropped Total above-ground FNR values (corn,
rye-grass, plus weeds) were unaffected by cropping
corn at final harvest in 1993 ( Zhou et al., 1997).
In addition, under free drainage, the loss of NO−3- system in this study ( Table 3). This indicated that
the corn–annual rye-grass intercrop and the
N in the title drainage water was 2.5 mg N l−1
under the intercrop system and 5 mg N l−1under monocrop corn system had similar abilities to
absorb the applied N fertilizer. The disparity the monocropping system in the fall of 1993
( Kaluli et al., 1999). Kaluli et al (1999) found between N uptake and FNR in the intercropping
system was due to its high efficiency in absorbing that denitrification was less in the intercrop system
than the monocrop system. These results suggest both applied N fertilizer and mineralized organic
soil N. Free drainage resulted in 18%greater FNR
that the intercropping of corn with annual
rye-grass is an effective practice for the removal of N values for stover than water-table controls in 1993.
This result may have been due to the higher that would otherwise be left in the soil after corn
is harvested, as long as the rye-grass becomes well denitrification rates in the water-table control
treatments than the free drainage treatment established.
In general, treatment effects on N accumulation ( Kaluli et al., 1999).
Intercropping effects on FNR of corn varied
Table 3
Effects of cropping system and water-table depths on fertilizer N recovery in 1993 and 1994 growing seasons
Factors 1993 1994
Corn Stover Corn grain R+Wa Totalb Corn stover Corn grain R+W Total
% %
Cropping system
Intercropping 15 21 18 54 8 15 12 35
Monocropping 20 29 0 49 12 24 0 36
Significance ofPalue 0.05 0.06 – ns 0.05 0.05 – ns
Water-table control
Water table 70c 16 24 9 49 10 22 4 36
Water table 80 17 24 7 48 10 19 5 34
Water table 100 20 27 10 57 9 18 3 30
Significance ofPvalue 0.05 ns ns ns ns ns ns ns
aRye-grass plus weeds.
bTotal dry matter in the monocropping system=corn grain+stover, in the intercropping system=corn (grain+stover)+ rye-grass+weeds.
cWater table at 70, 80, and 100 cm below the soil surface, respectively; ns: not significant atP>0.1.
between the two years. In 1993, monocropped tions of high fertilizer N application systems.
corn recovery values were 33 and 38%greater than Intercropping caused no reduction in corn grain
that of intercrop corn grain and stover utilization, yield if adequate nutrients and soil water were
respectively, while in 1994, monocropped corn supplied. The intercrop system had a substantially
recovered 60 and 50% more, than intercrop corn greater N uptake than the monocrop system, even
for grain and stover, respectively. The difference though N fertilizer recovery did not change
in FNR between the cropping systems was between cropping systems. This indicated that the
expected since other plant species (rye-grass plus intercropping system used non-fertilizer N more
weeds) competed for the same nutrients in the effectively. Fertilizer N recovery by corn was higher
intercropping system. The between-year variations in the monocrop than the intercrop system. Late
in the recovery of applied enriched N fertilizer in establishment of annual rye-grass in this study
the cropping systems were reflected by relatively (2 months before corn harvest) likely reduced
more residual soil N from the previous years of N interspecific plant competition for available
nutri-fertilizeration ( Zhou et al., 1997). Prior to this ents and soil moisture early in the season but also
experiment, the field had been used for commercial allowed recovery of residual soil NO
−
3-N late in
corn production and received N fertilizer as
the growing season. Environmental factors such 180 kg N ha−1year−1. Starting in the spring of
as soil moisture or soil N mineralization may limit
1993, we added 270 kg N ha−1 as per Liang and
the performance of the intercropping system. MacKenzie (1994). Thus, the greater initial soil
Water table depths of between 70 and 100 cm had 14NO
3content in the spring of 1994 relative to the less effect on the development of corn than
crop-spring of 1993 may have increased the soil 14N
ping system.
pool and led to a lower atom% 15N in 1994 due
to an exchange of heavier isotope vs. native soil N (Zhou et al., 1997).
Acknowledgements
4. Conclusions
The authors thank Mr Stewart Leibovitch for his expert technical assistance and Mr Peter Kirby Intercropping corn with annual rye-grass is an
tems for sustainable corn production, Ph.D. thesis, McGill
acknowledges the financial support of a
Hydro-University, Quebec, Canada.
Quebec Major Fellowship through McGill
Kaluli, J.W., Madramootoo, C.A., Zhou, X.M., MacKenzie,
University; the Frederick Dimmock Memorial A.F., Smith, D.L., 1999. Subirrigation systems to minimize
Scholarship through the Macdonald Campus of nitrate leaching. J. Irrig. Drain. Eng. 125, 52–58.
McGill University; The Macdonald Class of ’44 Kunelius, H.T., Coulson, N.N., Veinot, R.L., 1984. Root Mass
of Italian and Westerworlds Ryegrasses. Canadex 127.24.
Graduate Student Bursary through the Macdonald
Agriculture Canada, Ottawa.
Campus of McGill University; and Natural
Kurtz, T., Melsted, S.W., Bray, R.H., 1952. The importance of
Sciences and Engineering Research Council of nitrogen and water in reducing competition between
Canada strategic grants program. intercrops and corn. Agron. J. 44, 13–17.
Liang, B.C., Remillard, M., MacKenzie, A.F., 1991. Influence of fertilizer irrigation and non-growing season precipitation on soil nitrate-nitrogen under corn. J. Environ. Qual. 20, 123–128.
Liang, B.C., MacKenzie, A.F., 1994. Corn yield, nitrogen References
uptake and nitrogen use efficiency as influenced by nitrogen fertilization. Can. J. Soil Sci. 74, 235–240.
Bergstrom, L., 1986. Distribution and temporal changes of
min-MacLean, A.J., 1977. Movement of nitrate nitrogen with eral nitrogen in soil supporting annual and perennial crops.
different cropping systems in two soils. Can. J. Soil Sci. Sweden J. Agric. Res. 16, 105–112.
57, 27–33. Bradstreet, R.B., 1965. The Kjeldahl Method for Organic
Nitro-Madramootoo, C.A., Wiyo, K., Enright, P., 1992. Nutrient gen. Academic Press, New York.
losses through tile drains from two potato fields. Appl. Eng. Chang, J.F., Shibles, R.M., 1985. An analysis of competition
Agric. 8, 639–646. between intercropped cowpea and maize I. Soil N and P
Madramootoo, C.A., Dodds, G.T., Papadopoulos, A., 1993. levels and their relationships with dry matter and seed
pro-Agronomic and environmental benefits of water-table man-ductivity. Field Crop Res. 12, 133–143.
agement. J. Irrig. Drain. Eng. 119, 1052–1065. Chaudhary, T.N., Bhatnagar, V.K., Prihar, S.S., 1975. Corn
Martel, Y.A., MacKenzie, A.F., 1980. Long-term effects of cul-yield and nutrient uptake as affected by water-table depth
tivation and land use on soil quality in Quebec. Can. J. Soil and soil submergence. Agron. J. 67, 745–749.
Sci. 60, 411–420. Claude, P.P., 1990. Effets des cultures intercalaires dans le
mais-Martin, R.C., Voldeng, H.D., Smith, D.L., 1991. Nitrogen grain sur le rendement en grain la qualite` e`daphiqe, et la
transfer from nodulating soybean to maize or to nonodulat-teneur en azote inorganique des sols, Ph.D. Thesis, McGill
ing soybean in intercrops the15N dilution methods. Plant University, Quebec, Canada.
and Soil 132, 53–63. Evans, R.O., Skaggs, R.W., Gilliam, J.W., 1995. Controlled
Meek, B.B., Grass, L.B., Willardson, L.S., MacKenzie, A.J., versus conventional drainage effects on water quality.
1970. Nitrate transformations in a column with controlled J. Irrig. Drain. Eng. 121, 271–276.
water table. Soil Sci. Soc. Am. Prod. 34, 235–239. Groffman, P.M., Hendrix, P.F., Han, C.R., Crossley, D.A.,
Musser, H.B., Pekins, A.T., 1969. Guide to planting. 1987. Nutrient cycling processes in a southeastern
agroeco-In: Hanson, A.A., Juska, .F.J. ( Eds.), Turfgrass Science. system with winter legumes. In: Power, J.F. (Ed.), The Role
American Society Agronomy, Madison, WI, pp. 474–490. of Legumes in Conservation Tillage Systems: the
Proceed-Nordquist, P.T., Wicks, G.A., 1974. Establishment methods for ings of a National Conference, University of Georgia 27–29
alfalfa in irrigated corn. Agron. J. 66, 377–380. April. Soil Conservation Society of America, Ankeny, IA,
SAS Institute, 1985. User’s Guide; Statistics. Version 5. 5th pp. 7–8.
edition, SAS Institute, Cary, NC. Hope-Simpson, M.E., 1992. An evaluation of corn yield,
Schery, R.W., 1961. Making and maintaining a lawn. Am. intercrop growth and soil nitrogen levels in silage and grain
Hortic. Manag. 40, 199–209. corn intercrop system, M.Sc thesis, McGill University,
Scott, T.W., Pleasant, J.Mt., Burt, R.F., Otis, D.J., 1987. Con-Quebec, Canada.
tribution of ground cover dry matter and nitrogen from Jokela, W.E., Randall, G.W., 1987. A nitrogen-15 microplot
intercrops and cover crops in a corn polyculture system. design for measuring plant and soil recovery of fertilizer
Agron. J. 79, 792–798. nitrogen applied to corn. Agron. J. 79, 322–325.
Searle, P.G.E., Comudom, Y., Shedden, D.C., Nance, R.A., Kalita, P.K., Kanwar, R.S., 1992. Shallow water table effects
1981. Effect of maize/legume intercropping systems and fer-on photosynthesis and corn yield. Trans. Am. Soc. Agric.
tilizer nitrogen on crop yields and residual nitrogen. Field Eng. 35, 97–104.
Crops Res. 4, 133–145. Kalita, P.K., Kanwar, R.S., 1993. Effects of water table
man-Steenvoorden, J.H.A.M., 1989. Agricultural practices to reduce agement practices on the transport of nitrate-N to the
shal-nitrogen losses via leaching and surface runoff. In: Germon, low groundwater. Trans. Am. Soc. Agric. Eng. 36, 413–422.
Nitrates: Commission of the European Communities. Elsev- Zhou, X.M., MacKenzie, A.F., Madramootoo, C.A., Kaluli, J.W., Smith, D.L., 1997. Management practices to conserve ier Science, London, pp. 72–84.
Tait, R.T., Madramootoo, C.A., Enright, P., 1995. An instru- soil nitrate in maize production systems. Trans. Am. Soc. Agric. Eng. J. Environ. Qual. 26, 1369–1374.
mented, field-scale research facility for drainage and water
quality studies. Comput. Electron. Agric. 12, 131–145. Zhou, X.M., Leibovitch, S., MacKenzie, A.F., Madramootoo, C.A., Dutilleul, P., Smith, D.L., 1998. Confined microplot Vrabel, T.E., 1981. The use of legumes as living mulch crops
with sweet corn (Zea mays L.)-feasibility studies, M.Sc. size for nitrogen-15 uptake by corn plants in a corn intercrop system. Agron. J. 90, 155–161.