FAULT FINDING, REPAIR
AND MEASUREMENT
Test Project Document
LKS_2017_TP16_FFRM_EN
Submitted by:
Name : Electronics Indonesia
1. INTRODUCTION TO TEST PROJECT DOCUMENTATION
1. Introduction To Test Project Documentation...2
2. Contents...3
3. Introduction...4
4. Description Of Project & Task...5
5. Instruction To The Competitors...6
6. Equipment, Machinery, Installations And Materials Required...10
7. Marking Scheme...19
2. CONTENTS
This Test Project proposal consists of the following documentation/files:
3. INTRODUCTION
This Test Project is a Stereo Multiplex (MPX) and FM Transmitter test, Instead of
using special purpose ICs to produce the waveforms this design uses ordinary
HCMOS logic. Audio Frequency (AF) signals are produced using binary counters
and combinational logic and then filtered to obtain two very low distortion sine waves
to serve as the test tones. These audio signals are then multiplexed by a 38 KHz
Sub-Carrier to form a Left+Right and a Left-Right Double Side-Band Suppressed
Carrier (DSBSC) signal to form the Stereo Multiplex (MPX). No fault and no
measurement in the oscillator FM/ Modulation FM Block.
4. DESCRIPTION OF PROJECT & TASK
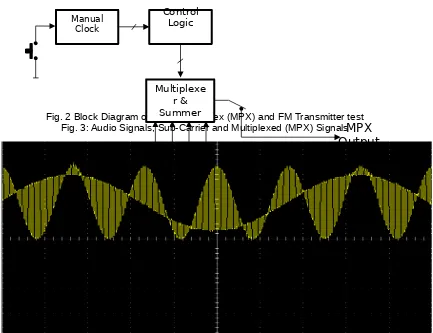
The block diagram of the Stereo Multiplex (MPX) and FM Transmitter is shown in Fig. 2.
Fig. 2 Block Diagram of Stereo Multiplex (MPX) and FM Transmitter test Fig. 3: Audio Signals, Sub-Carrier and Multiplexed (MPX) Signals
The Signal Generator generates the 38 KHz sub-carrier and 19 KHz pilot tone. It
uses an ingenious technique to generate 2 sine waves (audio) with very low
distortion at around 300 Hz and 1.2 KHz.
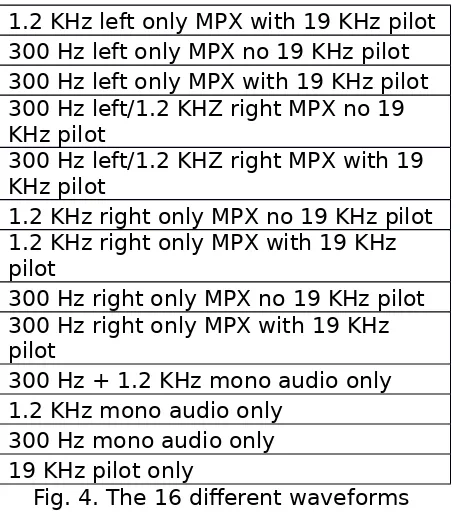
The 38 KHz sub-carrier is used to multiplex the audio signals and then summed with
the 19 KHz pilot tone by the Multiplexer & Summer to form 16 different waveforms
(Fig 4). The audio signals being encoded as Left or Right is based on the phase of
the sub-carrier.
The 16 different waveforms
1.2 KHz left only MPX with 19 KHz pilot 300 Hz left only MPX no 19 KHz pilot 300 Hz left only MPX with 19 KHz pilot 300 Hz left/1.2 KHZ right MPX no 19 KHz pilot
300 Hz left/1.2 KHZ right MPX with 19 KHz pilot
1.2 KHz right only MPX no 19 KHz pilot 1.2 KHz right only MPX with 19 KHz pilot
300 Hz right only MPX no 19 KHz pilot 300 Hz right only MPX with 19 KHz pilot
300 Hz + 1.2 KHz mono audio only 1.2 KHz mono audio only
300 Hz mono audio only 19 KHz pilot only
Fig. 4. The 16 different waveforms
The state of the Control Logic is advanced by the Manual Clock. In manual mode it
6. INSTRUCTION TO THE COMPETITORS
Fault Finding and Repair
1. Supply voltage of 12 + 0.1 volts to be applied to terminal P1, please take note of the polarity.
2. Adjust R5 to set the frequency 153 KHz + 0.5 KHz of the clock output at U7_3. If competitor board doesn’t match with the frequency, competitor can
exchange the board to jury.
3. There are 3 faults which do not correspond to the demand specifications. Find and repair it.
4. Describe Defective Part and Fault Symbol.
5. When you request repair parts, both of the Competitor and the Jury have to sign to part list.
6. Describe the evidence of the repair.
FAULT SYMBOL DESCRIPTION FAULT SYMBOL DESCRIPTION
Open
(part, wire or PCB trace) (Pin, input, output, etc.)Stuck at high voltage Short
(part, wire or PCB trace)
Stuck at low voltage (Pin, input, output, etc.) Part with larger value
(resistor, capacitor, etc.)
?
Incorrect part number orwiring connecting Part with smaller value(Resistor, capacitor,
etc.)
+/-Wrong Polarity
Fig.5 Fault Symbol Table
You may use the following Labels:
LOCATION CATEGORY SAMPLE
Power +5V/+12V/-5V/+5V/GND
Pin of IC IC2_8
Between Two Components R1-R2
Fig.6 Location Symbols Table
DEFECTIVE PART FAULT SYMBOL
Fault #1 IC2_8 - R7_1
BEFORE AFTER
Measurement #1
Node: _ R7_1 ______
Fig.7 Example of description of answer script
(Condition: the frequency of the oscillator is too high.)
DEFECTIVE PART FAULT SYMBOL
Fault #2 R1
BEFORE AFTER
Measurement #2
Node: _TP1______
1.00V/DIV 1.00ms/DIV
Fig.8 Example of description of answer script
(Condition: the frequency of the oscillator is too high.)
Voltage at R7_ 1 below than
7. MEASUREMENT
Measure the following items:
1. Measure and record the frequency at U19_1
2. Press S1 button until signal out U10_12 = LOW, U10_9 = HIGH, U10_8 = HIGH, U10_11 = LOW, then measurement MPX OUT signal at P4.
3. ... 4. ...
For each measurement, sketch a schematic showing how to measure, using
following equipment symbols.
EQUIPMENT SYMBOL
Fig.9 Equipment Symbol Table
Fig.10 Example of Measurement Schematic
5. EQUIPMENT, MACHINERY, INSTALLATIONS AND MATERIALS REQUIRED
ITEM QTY MATERIAL DESCRIPTION NOTES
1 1 FFRM PCB Material for the
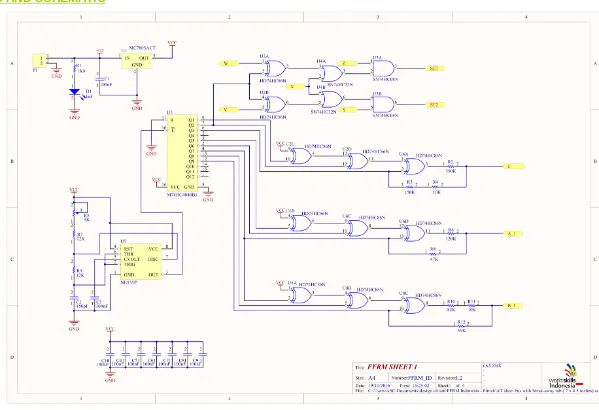
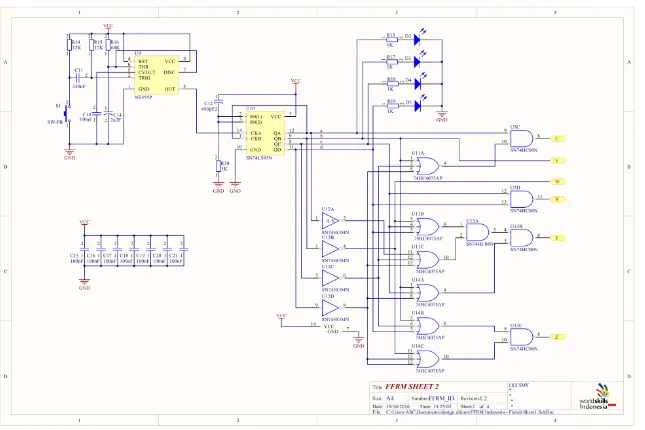
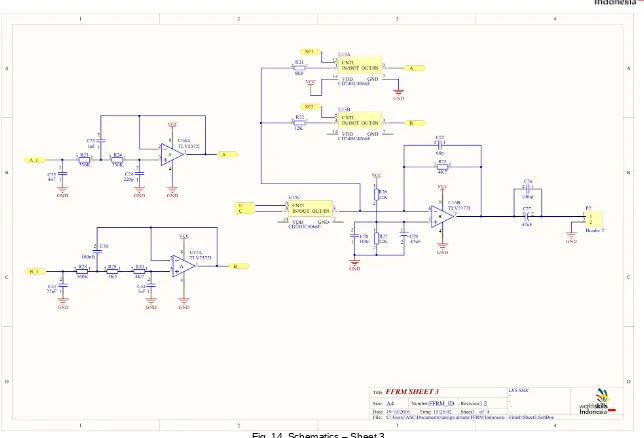
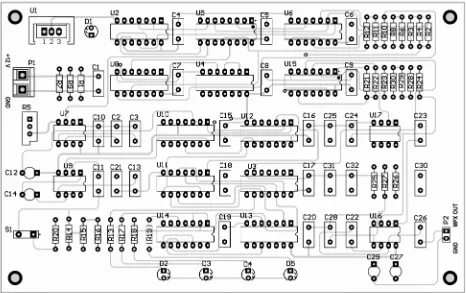
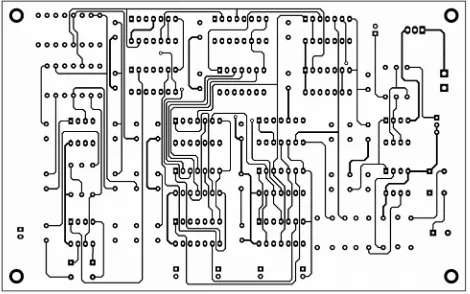
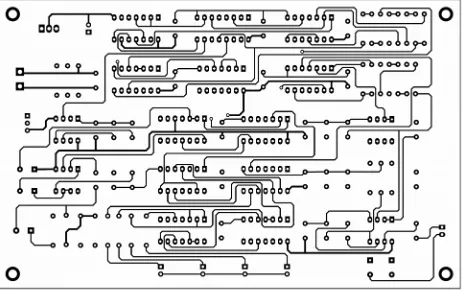
8. PCB AND SCHEMATIC
Fig. 12. Schematics – Sheet 1
Fig. 14. Schematics – Sheet 3
Fig. 16. PCB Bottom layer
9. MARKING SCHEME
MAX MARK ASPECT OF CRITERION - DESCRIPTION
12 Finding faulty spots and evidence 3 Repairing (IPC-A-610-D)
8 Validity of measuring results
10.OTHERS
1. Part List for repairing
2. Fault Finding and Repair – Answer Script 3. Measurement – Answer Script
Part list for repairing
S/N DESCRIPTION VALUE DESIGNATOR QTY. COMPETITOR
REQUEST COMPETITORSIGNATURE SIGNATUJURY RE
17 Multiturn / Variabel Resistor
S/N DESCRIPTION VALUE DESIGNATOR QTY. COMPETITOR
REQUEST COMPETITORSIGNATURE SIGNATUJURY RE C26, C28, C30
20
19 Cap. Ceramic 150 pF C2 1
20 Cap. MKM 330 nF C11 1
21 Cap. Ceramic 680 pF C12 1
22 Cap. Tantalum 2,2 uF C14 1
23 Cap. Ceramic 68 pF C22 1
24 Cap. MKM 1 nF C23, C32 2
25 Cap. Ceramic 220 pF C24 1
26 Cap. MKM 4,7 nF C25 1
27 Cap. Electrolit 47 uF C27, C29 2
28 Cap. MKM 22 nF C31 1
Counter 12 74HC4040 U5, 1
34 IC Timer NE555 U7, U9 2
35 IC Counter SN 74LS93 U10 1
36 IC Logic Gate 74HC4075 U11, U14 2 37 IC Logic Gate SN 74HC04 U12 1
S/N DESCRIPTION VALUE DESIGNATOR QTY. COMPETITOR
REQUEST COMPETITORSIGNATURE SIGNATUJURY RE
39 IC Op Amp TLV2372 U16, U17 2
40 Led Red Led Red 3mm D1 1
41 Led Red Led Green3mm D2, D3, D4, D5 4
42 Push Buttom PB 2 Pin S1 1
43 Terminal Block
3 Pin T-Block 2 Pin P1 1
44 Header Molek 2 Pin
Header
Molek P2 1
45 Soket Molek 2
Pin Soket Molek P2` 2
46 Headsink Almunium 50 Spiser 1 Cm Spiser Hexagonal 4
Fault Finding & Repair – Answer Script
DEFECTIVE PART FAULT SYMBOL
Fault #1
BEFORE AFTER
Measurement #1
Node: _______
DEFECTIVE PART FAULT SYMBOL
Fault #2
BEFORE AFTER
Measurement #2
Node: _______
DEFECTIVE PART FAULT SYMBOL
Fault #3
BEFORE AFTER
Measurement #3
Measurement – Answer Script Measurement #1
Measurement Output
Vertical Settings:
/div
Horizontal Settings:
/div
Verification output graph
Measurement #2
Measurement SCHEMATIC
Measurement Output
Vertical Settings:
/div
Horizontal Settings:
Verification output graph
Calculation Volt peak to peak with formula
Measurement #3
Measurement SCHEMATIC
Measurement Output
Vertical Settings:
/div
Horizontal Settings:
Verification output graph
Calculation Volt peak to peak with formula
Measurement #4
Measurement SCHEMATIC
Measurement Output
Vertical Settings:
/div
Horizontal Settings:
Verification output graph
Calculation Volt peak to peak with formula Calculation frequency with formula