i
Development of forest biodiversity Indicators for a participatory
forest biodiversity monitoring system in South Sumatra
A methodological guideline
October 2016
Contributing authors
Prem Raj Neupane
Archana Gauli
Philip Mundhenk
Christian Hack
Michael Köhl
ii
About this document
This methodological guidance is one of the results of the collaborative work between University of Hamburg, Hamburg, Germany; the University of Srivijaya, Palembang, Indonesia; and the GIZ Biodiversity and Climate Change Project (BIOCLIME) ithi the Biodi e sit a d Ca o Mo ito i g P oje t in South
“u at a BiCaM“u . The BiCaMSu project was funded by the German Federal Ministry for the Environment, Nature Conservation, Building and Nuclear Safety (BMUB) through the GIZ BioClime project.
The aim of the BIOCLIME p oje t is to p ese e iodi e sit a d the a o se uest atio apa it of the selected forest ecosystems of South Sumatra as a contribution to the implementation of I do esia s
e issio edu tio s ta get . The project contributes to the implementation of I do esia s Biodi e sit Strategy and Action Plan (IBSAP)1. One of the main objectives of the BiCaMSu project is to design a Participatory Forest Biodiversity Monitoring System (PFBMS) at Forest Management Unit (FMU) level in South Sumatra. The PFBMS should assist stakeholders to develop and select highly rewarding/ high-performance criteria and indicators (C&I), and to develop a system to monitor C&I integrating the system into a FMU Forest Management Plan (FMP). The system is a vital component of the FMU FMP within a broader framework of adaptive and responsible forest management. This document provides guidance on how such a system might be put in place.
This report follows the guideline Ho to setup a Biodi e sit I fo atio “ ste BI“ fo “outh “u at a prepared by the BiCaMSu team .
Chapter 1 of this guideline provides a brief overview of forest and biodiversity status and signifies the importance of biodiversity monitoring. We also outline the initiatives and challenges on biodiversity monitoring with particularly focus on developing indicators. Chapter 2 outlines the importance of selecting the context based approach for biodiversity monitoring. It gives an overview of hierarchical characterization approach of biodiversity monitoring. Chapter further discusses on the detail process of selecting highly rewarding and high performance indicators that are useful for Sumatra Province level and the forest management unit level forest biodiversity monitoring. Chapter 3 presents the results of extensive literature review and the final outcomes of the two – days expert level workshop held in Palembang, Indonesia. Chapter 4 synthesis the workshop outcome with the literatures and discuss on the application of selected indicators on establishing a participatory forest biodiversity monitoring system at forest management unit level.
Criteria and indicators are being promoted internationally as a basis of local stakeholder self-monitoring. As a consequence, indicator development has been one of the most popular research topics in natural resource management and conservation (Noss, 1999). Although the o e all sustai a ilit of a atio s forests depends substantially on actions taken at the national scale, in principle, the national-level analysis of indicators may involve the aggregation of data collected at the FMU scale. Therefore, analysis of indicators at the FMU scale is the key to assessing, monitoring and reporting on SFM (ITTO, 2016). Thus, a
1
iii
iv
Table of Contents
1. Introduction ... 1
1.1 Biodiversity monitoring- context, definition and objectives ... 2
1.2 Initiatives and challenges on developing biodiversity indicators ... 4
2. Methodology ... 6
2.1 A hierarchical characterization approach of biodiversity monitoring ... 6
2.2 Collection and arrangement of the biodiversity elements related to the forest ecosystem ... 8
2.3 Indicator selection for Sumatra Province and Forest Management Units ... 9
2.4 Selection of highly rewarding and high performance indicators... 11
3. Results ... 16
3.1 Initial set of Indi ators Glo al pool or Laundry list ... 16
3.2 Ranking of indicators by the expert ... 21
3.3 Selection of forest biodiversity indicators relevant to Sumatra Province ... 23
3.4 Selection of forest biodiversity indicators relevant to forest management units ... 26
3.5 Selection of highly rewarding indicators applicable to FMU level forest biodiversity monitoring system 27 4. Application of the highly rewarding indicators establishing a participatory forest biodiversity monitoring system at FMU level ... 30
5. Bibliography ... 38
v List of Tables
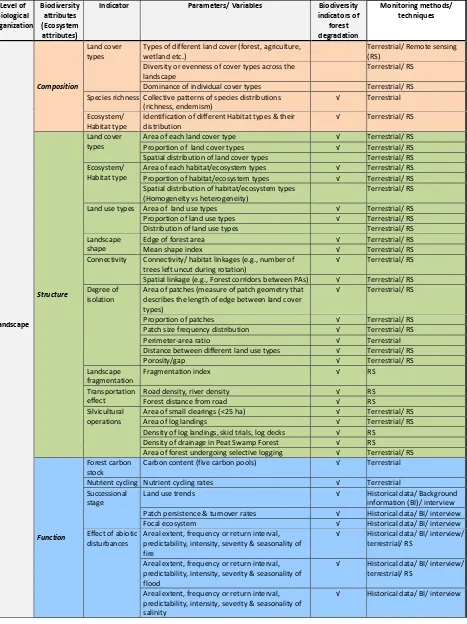
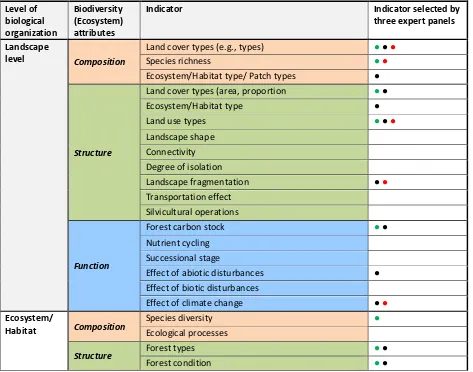
Table 1: List of the experts participated for the assessment ... 10 Table 2: Biodiversity indicators and associated parameters/ variables for inventorying, monitoring, and assessing forest biodiversity. The indicators and variables are presented at four levels of organization, and each level includes compositional, structural and functional components of an ecosystem. The Table presents whether the indicators are applicable to assess forest degradation. Each variable is provided with the methods/ techniques to measure it. ... 17 Table 3: Ranking of indicators by experts participated in the workshop. ... 22 Table 4: List of indicators applicable to Sumatra province level forest biodiversity monitoring system selected by the expert panels. ... 25 Table 5: List of highly rewarding/high-performance indicators applicable to forest management units (FMUs) selected by the experts panels. ... 28
List of Figures
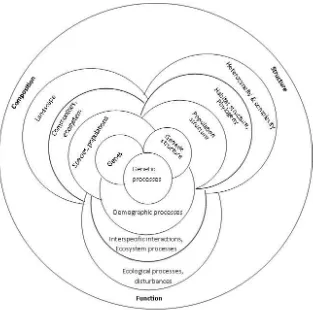
Figure 1: The hierarchical definition of biodiversity. Biodiversity defined as a multidimensional
vi Annexes
vii
Acronyms
ATO African Timber Organization
BiCaMSu Biodiversity and Carbon Monitoring Project in South Sumatra BIOCLIME Biodiversity and Climate Change Project
BMUB German Federal Ministry for the Environment, Nature Conservation, Building and Nuclear Safety
C&I Criteria and Indicators
CBD Convention on Biological Diversity CHM Clearing House Mechanism of the CBD CIFOR Center for International Forestry Research COP Conference of the Parties
FAO Food and Agriculture Organization of United Nations
FMP Forest Management Plan
FMU Forest Management Unit
IBSAP I do esia s Biodi e sit “t ateg a d A tio Pla ITTO International Tropical Timber Organization
MCPFE Ministerial Conference on the Protection of Forests in Europe NTFP Non-timber Forest Products
PFBMS Participatory Forest Biodiversity Monitoring System SFM Sustainable Forest Management
1
1.
Introduction
Globally around 3.3 million hectare of forest area is lost every year (FAO, 2016). The clearing of land for agriculture, commercial wood extraction, increased mining, infrastructure development and the urban expansion are the major driving factor for such forest deforestation and degradation (FAO, 2016; Geist and Lambin, 2002). Tropics were the only climate domain, which showed an estimated increase in forest loss by 2101 km2 annually during the period of 2000 to 2012 (Hansen et al., 2013), while the forest rate was decreased globally from 160,000 km2 per year to 130,000km2 per year (FAO, 2012). Of all countries globally, Brazil showed the largest decline in annual forest loss with over 40,000 km2 per year in 2003 to 2004 and less than 20,000 km2 per year in 2010 to 2011. This reduction in deforestation was offset by increasing forest loss in Indonesia. Indonesia exhibited the largest increase in forest loss (1021 km2 /year) with over 20,000 km2 per year in 2011 to 2012, which was double of that occurred between year 2000 to 2003 ( less than 10,000 km2 forest loss per year) (Hansen et al., 2013).
Similar estimates have been observed using remote sensing studies with 0.7 million ha and 0.9 million ha
a ual ha ge i fo est o e fo the pe iods –2005 and 2000–2010, respectively (Miettinen et al., 2011; Hansen et al., 2013; Stibig et al., 2014). Annual carbon emissions from gross tropical deforestation are estimated at 2.270 Gt CO2 from 2001–2013 (Vijay et al., 2016), contributing nearly 10% of the global total of anthropogenic greenhouse gas emissions. Indonesia is the world's second-largest emitter of carbon from gross deforestation, peaking in 2012 at 0.362 Gt CO2 per year before declining to 0.205 Gt CO2 per year in 2013.
The rapidly expanding pulp and palm oil production, have led to the most speeded deforestation than any other factors (Zarin et al., 2016). Countries such as Brazil, Indonesia, and Chile have become global players
i the o ld s pulp a ket aki g the ost of a st ategic advantage—climates conducive to fast growth rates (Abramovitz and Mattoon, 2000). Recently there have been remarkable shift of pulp production from traditional suppliers in the North to new producers in the South. And the shift has raised concern particularly for Southeast Asia. Palm oil was the highest exported commodity for 2011 in Indonesia, accounting for the 18.97 % of the total export and the tragedy is the trend of export is increasing. Indonesia and Malaysia contributed 53% and 34% of the global palm-oil production respectively in 2013 (FAO, 2015; Gaveau et al., 2016). Between 1982 to 2007, in Riau region alone, these two industries replace ca. 2 million hectares of natural forest (Uryu et al., 2008). Between 2000 and 2012, Indonesia alone lost
2
Plantation expansion and the timber industry have been heavily subsidized by the Indonesian government for years (Zarin et al., 2016). Pulp production has more than quadrupled in the last decade with more than 1.4 million hectares of natural forest been replaced by plantations. The predominant forestry plantation activity in Indonesia is the industrial plantation of acacia species (Acacia mangium and Acacia crassicarpa) and eucalypts (Eucalyptus pellita), primarily for pulpwood plantation with short rotation of 6-7 years (Verchot et al., 2010). The replacement of natural forests either with monoculture palm plantations or with the acacia or eucalypts reduces overall plant diversity and eliminates many animal species that depend on natural forests (Fitzherbert et al., 2008; Vijay et al., 2016). A third of the mangrove cover is gone from Indonesian coasts due to logging and shrimp farming. In addition to the environmental impacts, pulpwood plantations have also had adverse effects on local people. Even plantations programs have displaced indigenous Dayak communities (Abramovitz and Mattoon, 2000).
Archipelagic geography, geographic location and tropical climatic condition of Indonesia have supported
the o ld s se o d highest le el of iodi e sit . Its flo a a d fau a is a i tu e of Asia
and Australasian species, which is the esult of I do esia s geog aphi lo atio as eeti g poi t of Asia a d the Australian continent. It hosts some of the most bio-diverse ecosystems on earth and unique species such as the critically endangered Sumatran tigers and endangered Sumatran elephants (Uryu et al., 2008).
However, this rapid conversion of forest has resulted in a tremendous effect on the biodiversity contributing to the decline and extinction of biodiversity worldwide. Eisner et al. (2016), noted that the areas with the highest rates of increased deforestation are broadly located together with the areas with highest biodiversity threat. The accelerated deforestation together with high biodiversity endemism richness, makes Indonesia the country of the greatest increased threat to biodiversity (Eisner et al., 2016). Coupled with this habitat change, rapid climate change has placed biodiversity under unprecedented pressures. On the one hand, increased deforestation and tree decline have a direct impact on climate change by increasing the overall carbon emission and exacerbating anthropogenic climate change (IPCC, 2007), on the other hand pronounced and rapid climate change has a profound impact on the biodiversity, including change in current distribution of many tree species (Kremer et al., 2014), which may lead to a cycle of tree decline (Sabaté et al., 2002; Bréda et al., 2006).
1.1
Biodiversity monitoring- context, definition and objectives
3
conservation need. Despite the mounting efforts toward sustainable forest management and biodiversity conservation, the widespread loss of biodiversity continues.
Even the retention or the management of the degraded forests, agro forests, logged forests and the plantation or the secondary forests can ensure the persistence of many flora and fauna species in the managed forests (Chazdon, 2008; Scales and Marsden, 2008). In addition to providing habitat, such ecosystem also contribute significantly to livelihoods of the locals by providing forest products and also support the conservation efforts by providing landscape connectivity to connect forest remnants and buffer reserves (Gardner, 2010). The o e tio al o se ati e defi itio did t e og ize the i po ta e of the other significant values of the forest ecosystem such as its biological diversity, ecological and social values.
Identifying ways to conserve the forest biodiversity in different types of forest use and management and to inform more sustainable management regimes has been major research priority in recent years (Gardner, 2010). If forests loss exceeds plantations, then the focus should be on stopping deforestation. Alternatively, if the management of the plantations can be adapted so that they support a substantial proportion of forest species while maintaining high yields, conservation effort should focus on ways to enhance biodiversity in plantations (Green et al., 2005; Fitzherbert et al., 2008).
The biodiversity conservation is one of the goals of ecologically sustainable forestry, although the concept encompasses much more than biodiversity conservation alone. Biodiversity includes life in its all forms, from the level of gene, to species, to complete ecosystem, including all processes of the ecosystem that maintain these various levels (Noss and Cooperrider, 1994; Hunter, 1996). Given this complexity, it is difficult to judge whether forests/ecosystem are being managed in an ecologically responsible way. Generally we lack understanding about whether the current management plans and processes met the long-term goal of biodiversity conservation.
Biodiversity monitoring is a process of assessment of existing status and change in the condition of biodiversity, as measured against a set of criteria and indicators (ANSAB, 2010). The process determines the status and trends of biological diversity executing repeated measurement under continuous observation. Biodiversity monitoring mostly relies on qualitative and quantitative indicators.
4
use of biological diversity, and monitor their effects through sampling and other techniques' (Art. 7, p.5) (United Nations Convention on Biological Diversity, 1992; Secretariat of the Convention on Biological Diversity, 2005). Indonesia signed the CBD in 1992 and ratified it two years later in 1994.
In order to respond to the information need for conservation purpose and to develop ecologically responsible management strategies that enhance opportunities for conservation, biodiversity monitoring program plays vital role. The general objectives of biodiversity monitoring are to;
o promote sustainable forest/biodiversity management by providing tools, methods and techniques needed to generate monitoring data;
o assess the impacts of forest management activities on biodiversity and health of forest ecosystem; and
o support the development of baseline measurement of biodiversity from which changes to the resource base can be monitored.
1.2
Initiatives and challenges on developing biodiversity indicators
Biodi e sit is too oad o ept to easu e i it s e ti el . In most forests there are thousands of flora and fauna species and countless possible species interactions hence making it impossible to measure them completely. In nature, no two forest system are identical, each one are unique in its components and the processes. Hence in order to measure them, need arises to redefine the biodiversity in terms of measureable attributes relevant to the scale and purpose for which it is to be assessed (Sarkar and Margules, 2002; Williams, 2004; McElhinny et al., 2005). Indicators are usually measurable surrogates that allow isolation of the key aspects of a system from an overwhelming array of signals to describe and monitor biodiversity. Different criteria and the indicators (C&I) can be selected differently for different goal. For instance if goal is species conservation, focus will be on rare and threatened species and often consider the most common species even in the derogatory stage, of little interest. C&I is a powerful tool for monitoring, assessing and reporting on changes in forest conditions and biodiversity.
Though the concept and development of biodiversity indicator is not new, it has gained momentum quite recently. More than two decades before Noss (1990), had developed biodiversity indicator matrix, which can be regarded as an instrument in this change. However, only after the Rio Earth Submit in 1992, rapid international and regional initiatives in C&I processes took place. Subsequently, C&I mechanism emerged as a key mechanism to monitor principles of sustainability in terms of measurable goals (Wijewardana, 2008). The popularity of the C&I is reflected in participation of 150 countries, containing 97.5% of the
5
The Pan-European Process (1993) (Helsinki process, MCPFP), iii) the ATO Process (the African Timber Organization (ATO) initiative, 2003), iv) the Montreal Process (1995), v) the Amazon Cooperation Treaty (Tarapoto Agreement, 1995); vi) Dry Zone Africa (1995), vii) the Near East Process (1996), viii) the Lepaterique Process for Central America (1999), and ix) the Bhopal–India Process (1999).
However not many of these processes are able to show satisfactory commitment towards sustainable forest management particularly biodiversity conservation, and the situation is particularly poor in case of the tropical countries. Among these, three processes: the Pan-European Process, the Montreal process and ITTO have a track record of following in the concept into practice (Wijewardana, 2008). These processes have made substantial progress in promoting C&I implementation in their combined 85 member countries and reporting on their sustainable forest management achievements. Development of criteria and indicators has proved to be as a powerful information tools that provides holistic picture which recognize all major forest values including wood production.
Despite the large number of studies and the membership of the global initiative, implementation at the forest management unit (FMU) level is rather weak (Raison et al., 2001). There is immense volume of literatures on biodiversity indicators (Ferris and Humphrey, 1999; Poiani et al., 2000; Hagan and Whitman, 2006). There is no single literature that can identify the single coherent framework (Lindenmayer et al., 2000; McElhinny et al., 2005). These literatures have however made clear that there is no single indicator that can provide a satisfactory reflection of biodiversity change (Gardner, 2010). This could be due to the lack of applicable framework, or due to complexity of biodiversity terminology. Many studies about indicators are rather focused on one indicator or indicators concerning individual species and species groups (reviewed in Gao et al., 2015). And when such indicators are designed, question remains whether these indicator sets are sufficient to achieve the goal of developing efficient monitoring of biodiversity and biodiversity conservation as a whole. Most biodiversity monitoring studies are based on species diversity only, while the species diversity is at the best a very rough indicator of biodiversity, as it provides limited indication of the ecosystem and genetic diversity (Spangenberg, 2007). As a result, accounting for the species counting alone can be highly misleading indication of biodiversity.
So far developed criteria and indicators are more focused on implementation and effectiveness monitoring to assess if the forest management practices are against agreed standards and goals of the sustainable forest management or not. Even though management interventions are performed according to agreed standards and the results are achieved as per the goals, they might still impact the biodiversity status in a
6
management encompasses management interventions like selective logging. Even though logging is performed as per harvesting plan, which is based on the sustainable forest management, due to modified logging will have ecological impacts on the ecosystem. In addition, such impact in different ecological system may result in different ecological dynamics and composition.
Modified forest lacks natural ecological analogue, so their studies will poorly reflects the ecological dynamics and composition of the undisturbed forest (Hobbs et al., 2006; Gardner, 2010). Before and after interventions scenario could depicts the contribution of particular management interventions on biological diversity. However, there is little information available on the baselines ( such as baseline data before the human-related impacts) and even if they are available, it would be difficult to differentiate how much of these changes are related to the human related impacts and natural process (Allen et al., 2003). In systems undergoing processes of evolution and co-evolution, equilibrium and unidirectional causality approaches are inadequate concepts to understand stability properties such as resilience and resistance at the ecosystem level (Spangenberg, 2007).
Thus, developing a clear understanding of the links between particular management regime and its impacts and changes in biodiversity/ ecological integrity via measurable changes in major attributes of the ecosystem/forest provides the foundation for reliably assessing and evaluating management performance (Gardner, 2010).
2.
Methodology
2.1
A hierarchical characterization approach of biodiversity monitoring
7
We use hierarchical characterization approach of biodiversity as a conceptual framework for identifying specific, measurable indicators to monitor change and assess the overall status of biodiversity. On the basis of the attribute it measure, indicators are defined as a structural, functional and compositional indicator.
Structure attributes of the biodiversity involve physical organization or pattern of a system, from habitat
complexity as measured within stand communities to the pattern and other elements at the landscape level. The breadth of ecological relationship accounted by the structural attributes may be accounted by three components: heterogeneity, complexity and scale. Heterogeneity encompasses the variation due to
relative abundance of different structural components whether in vertical or horizontal plane. Complexity refers to the variation due to absolute abundance of individual structural component. Scale encompasses the variation due to size of the area or the volume used to measure heterogeneity and complexity (Ferris and Humphrey, 1999).
Function involves ecological and evolutionary processes including gene flow, disturbances and nutrient
cycling. Many approaches of biodiversity monitoring often ignores ecological processes e.g. natural disturbance, the decomposition of woody debris, the cycling of nutrients, etc.), which are critical for the maintenance of biodiversity (Noss, 1990). However, this ignorance will fail to provide complete definition of biodiversity.
Composition refers to the identity and variety of element in a collection that includes richness and
abundance. It is commonly measured by counting number of plant and animal species present in a given area (Ferris and Humphrey, 1999). The compositional indicator approach is the most commonly used measure in biodiversity monitoring.
8
Figure 1: The hierarchical definition of biodiversity. Biodiversity defined as a multidimensional
eta o ept e o passi g ge es, populatio s, spe ies, ha itat a d ecosystem.
Source : redrawn from Noss (1990)
2.2
Collection and arrangement of the biodiversity elements related to the forest
ecosystem
Indicator selection matrix was built up in order of organizational level namely landscape level, habitat/ ecosystem level, population/ species level and genetic level. Each organizational level was further arranged into the three attributes of biodiversity: composition, structure and function.
Once the matrix was ready, we used ISI Web of Knowledge to review literatures. Combination of different
ke o ds Biodi e sit o ito i g , I di ato sele tio , i di ato , Biodi e sit a d Fo ests e e
9
indicator matrix. We considered literatures/ studies that clearly involved with the biodiversity or ecological indicators.
We conducted a quick review of the abstracts of the retrieved 562 articles and screened 52 articles that were relevant to our study. Out of 52 articles, we selected 17 most relevant papers that dealt with biodiversity indicators. Since many studies were based on the one or few attributes (e.g. structural indicators only), and at limited spatial scale (e.g. literatures involved with population level studies only), we considered four criteria to characterize and assign each indicator described in the literature to particular category: purpose of indicator (e.g. habitat quality assessment, ecological status assessment), indicator type, spatial scale, and biodiversity attributes addressed. Each selected indicator was added as an entry to our pool of indicators. Set of keyword used for the literature survey might have influenced our indicator list.
2.3
Indicator selection for Sumatra Province and Forest Management Units
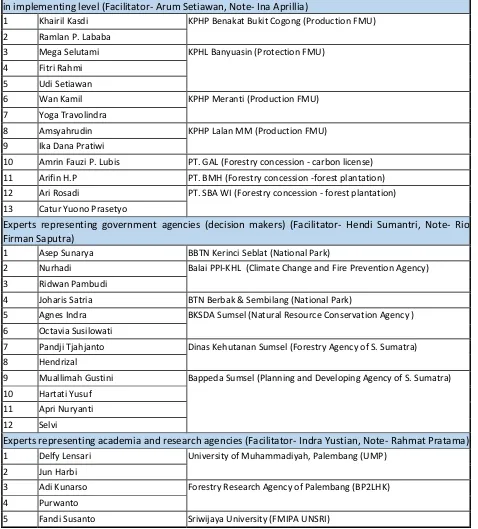
A two-day workshop was organized among thirty experts (Table 1) (experts here means decision makers, academics and researcher and professionals working in the field of forest and biodiversity management,
and who have knowledge of some component of biodiversity in different temporal and spatial scales) to select final set of indicators that are relevant to the Sumatra province and Forest Management Units (FMUs) level in particular. In the first stage, each of the experts was provided with the 10 stickers so that they can rank indicators based on their personal importance preference. More than one sticker was allowed to be assigned in each indicator based on the weightage given to them.
In the stage second, thirty experts were grouped into three groups on the basis of the organizations/institutes they were representing. Group I included thirteen experts representing Forest Management Units (FMUs), forestry concessions and other professionals in implementing level; group II included twelve experts representing government agencies (decision makers); and group III composed of five experts representing academia and research agencies. Each group was provided with the document with initial set of indicators and parameters created through the literature review (described above, see Table 2). Experts were asked to select/prioritize indicators that are useful and relevant to the province level and also to the forest management unit level.
10 Table 1: List of the experts participated for the assessment.
SN Name Institution
Experts representing forest management units (FMUs) and forestry concessions and other professionals in implementing level (Facilitator- Arum Setiawan, Note- Ina Aprillia)
1 Khairil Kasdi KPHP Benakat Bukit Cogong (Production FMU)
2 Ramlan P. Lababa
3 Mega Selutami KPHL Banyuasin (Protection FMU)
4 Fitri Rahmi
5 Udi Setiawan
6 Wan Kamil KPHP Meranti (Production FMU)
7 Yoga Travolindra
8 Amsyahrudin KPHP Lalan MM (Production FMU)
9 Ika Dana Pratiwi
10 Amrin Fauzi P. Lubis PT. GAL (Forestry concession - carbon license)
11 Arifin H.P PT. BMH (Forestry concession -forest plantation)
12 Ari Rosadi PT. SBA WI (Forestry concession - forest plantation)
13 Catur Yuono Prasetyo
Experts representing government agencies (decision makers) (Facilitator- Hendi Sumantri, Note- Rio Firman Saputra)
1 Asep Sunarya BBTN Kerinci Seblat (National Park)
2 Nurhadi Balai PPI-KHL (Climate Change and Fire Prevention Agency)
3 Ridwan Pambudi
4 Joharis Satria BTN Berbak & Sembilang (National Park)
5 Agnes Indra BKSDA Sumsel (Natural Resource Conservation Agency )
6 Octavia Susilowati
7 Pandji Tjahjanto Dinas Kehutanan Sumsel (Forestry Agency of S. Sumatra)
8 Hendrizal
9 Muallimah Gustini Bappeda Sumsel (Planning and Developing Agency of S. Sumatra)
10 Hartati Yusuf
11 Apri Nuryanti
12 Selvi
Experts representing academia and research agencies (Facilitator- Indra Yustian, Note- Rahmat Pratama)
1 Delfy Lensari University of Muhammadiyah, Palembang (UMP)
2 Jun Harbi
3 Adi Kunarso Forestry Research Agency of Palembang (BP2LHK)
4 Purwanto
11
2.4
Selection of highly rewarding and high performance indicators
12
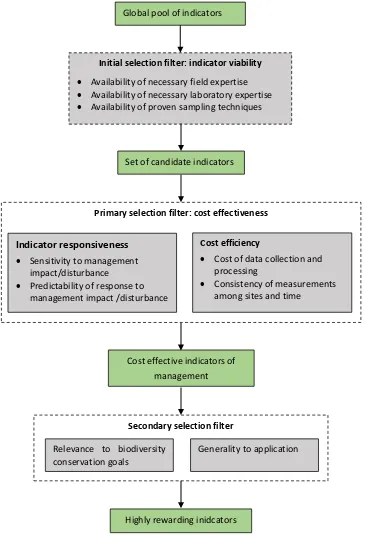
Figure 2: A general framework for selecting highly rewarding indicators for the biodiversity monitoring. Source: Figure adapted from Gardner, 2010
Highly rewarding inidcators Global pool of indicators
Initial selection filter: indicator viability
Availability of necessary field expertise
Availability of necessary laboratory expertise
Availability of proven sampling techniques
Set of candidate indicators
Primary selection filter: cost effectiveness
Indicator responsiveness Sensitivity to management
impact/disturbance
Predictability of response to management impact /disturbance
Cost efficiency
Cost of data collection and processing
Consistency of measurements among sites and time
Cost effective indicators of
management
Secondary selection filter
Relevance to biodiversity conservation goals
13
Ranking of forest biodiversity indicators by experts
Outcome of the ranking exercise
14
Selection of indicators relevant to province and FMU level forest biodiversity monitoring system,
and selection of highly rewarding/ high-performance indicators for FMU level forest biodiversity
monitoring
Panel of experts representing academia (universities) and research agencies
Panel of experts representing government agencies (decision makers)
Panel of experts representing forest management units (FMUs), forestry concessions and other forestry
15
Group presentation and discussion: Selection of indicators relevant to province and FMU level
forest biodiversity monitoring system, and selection of highly rewarding/ high-performance
16
3.
Results
3.1
Initial set of Indicators
Glo al pool o Lau d y list
Altogether 62 indicators and 162 parameters/ variables were generated from the study. Compilation of biodiversity indicators and their respective inventory and monitoring tools are presented in Table 2. Indicators are organized into four hierarchical levels (Landscape, habitat, stand and genetic) as mentioned above. Each level includes all three ecosystem attributes (structural, functional, and compositional attributes). As with most of the categorization process, there is an overlap between the indicators at different level.
Landscape level
Landscape refers to a mosaic of heterogeneous land forms, vegetation types, and land uses (Urban et al., 1987). Spatial scale of a landscape may vary in size, for instance from 102 to 107 km2. Landscape features such as patch size, heterogeneity, perimeter-area ratio, and connectivity can be major controllers of species composition and abundance, and of population viability for sensitive species (Noss, 1990).
Ecosystem/ habitat level
The ecosystem level is relatively homogenous as compared to the landscape level. Indicator attributes for the ecosystem includes composition indicators such as species richness and diversity, variables related to ecological processes such as nutrient cycles, natural and human disturbances etc. Key physical attributes of the habitat that are important for maintenance of the biodiversity, are described using structural indicators such as rock bed types, abundance of water and other resources. Other major habitat level indicators include major structural canopy and vegetation strata.
Population species/ stand level
17
Table 2: Biodiversity indicators and associated parameters/ variables for inventorying, monitoring, and assessing forest biodiversity. The indicators and variables are presented at four levels of organization, and each level includes compositional, structural and functional components of an ecosystem. The Table presents whether the indicators are applicable to assess forest degradation. Each variable is provided with the methods/ techniques to measure it.
18
Identification of different species Terrestrial
Relative abundance/frequency/ richness/ evenness & diversity of species
√ Terrestrial
Proportions of endemic & exotic species √ Terrestrial
Proportions of endangered (critically endangered, endangered) vulnerable, near threatened, & least concerned species
√ Terrestrial
Identification of focal species (e.g., area-limited, dispersal limited, resource-limited, process-limited, Keystone species)
Terrestrial
Identification of target species of particular conservation & management concern
Terrestrial
Proportion of focal species to non-native invasive species
√ Terrestrial
Dominance-diversity curves Terrestrial
Similarity coefficients (Measure of co-occurrence & association)
Terrestrial
C3:C4 plant species ratios Terrestrial
Ecological processes
Presence of species that indicate unaltered ecological processes
Terrestrial
Structure
Forest types Extent (e.g., area) of forest types (e. g., protected forest, production forest, conservation/special use forest etc.)
√ Terrestrial/ RS
Proportion (area) of different forest types √ Terrestrial/ RS
Forest condition Area & proportion of managed natural forest √ Terrestrial/ RS
Area & proportion of degraded natural forest √ Terrestrial/ RS
Area of secondary forest (successional forest) √ Terrestrial/ RS
Degraded forest land presently unstocked √ Terrestrial/ RS
Forest area in compliance schemes
Area & proportion of certified forests √ Terrestrial/ RS
Forest/land Restoration
Area of degraded forests restored √ Terrestrial/ RS
Area of degraded forest land restored √ Terrestrial/ RS
Species distribution
Plant community diversity (age size, age size classes, growth form of trees)
√ Terrestrial/ BI
Proportion of focal species to non-native invasive species
√ Terrestrial/ BI
Climatic factors Climatic variables (precipitation, humidity, temperature)
√ Terrestrial/ RS
Edaphic factors Substrate & soil variables/soil types √ Terrestrial/ RS
Topographic factors
Altitude, slope & aspect Terrestrial/ RS/ BI
Structural Canopy/ elements
Vegetation biomass & physiognomy √ Terrestrial
Foliage density & layering (arrangement of foliage in different strata)/variation in overstorey & understorey structure & floristics)
√ Terrestrial
Horizontal patchiness Terrestrial
Canopy openness/gap proportions ( forest canopy cover, forest canopy gaps, tree fall gaps)
√ Terrestrial
19
Proportion of tree crowns with broken & dead tops Terrestrial
Habitat features Rock bed type RS
Abundance, density, & distribution of key physical features (e.g., cliffs, outcrops, sinks)
RS
Resource availability (e.g., water, pond, mud-bath, mast)
RS
Function
Keystone species
Ecologically pivotal species √ Terrestrial
Gene flow Migration Terrestrial / lab work
Dispersal Terrestrial / lab work
Colonization & local extinction rates Terrestrial / lab work
Disturbances Herbivory, parasitism, & predation rates √ Terrestrial/ BI
Patch dynamics (fine-scale disturbance processes) √
Forest fire- areal extent, frequency or return interval, predictability, intensity, severity & seasonality
√ Historical data/ BI interview/ terrestrial/ RS
Human intrusion rates & intensities (e.g., forest encroachment, slash-&-burn)
√ Historical data/ BI interview/ terrestrial/ RS
Extraction rate (frequency) of harvested volume, felling cycle
√ Archives/BI/interview
Productivity & resilience
Biomass & resource productivity √ Terrestrial
Rate of forest growth (Increment rate) √ Terrestrial/ lab work
Decomposition rate √ Terrestrial/ lab work
Nutrient cycling rates √ Terrestrial/ lab work
Population / species/ stand
Composition
Species richness Absolute abundance & distribution/species diversity of target (key) & focal species
√ Terrestrial
Relative abundance (species richness, diversity, relative abundance of keystone species, flagship, vulnerable, umbrellas, ecological indicators)
√ Terrestrial
Growing stock Biomass (stand basal area, stand volume) √ Terrestrial
Stem density Terrestrial
Threats (Invasive species)
List of invasive species observed in forests √ Terrestrial/ interview
Structure
Major structural canopy
Forest canopy cover √ Terrestrial/ RS
Forest canopy gap size classes, average gap size √ Terrestrial/ RS Proportion of tree crowns with broken & dead tops Terrestrial/ RS
Tree height Tree height Terrestrial/ RS
Standard deviation of height Terrestrial/ RS
Height class richness Terrestrial/ RS
Horizontal variation in height Terrestrial/ RS
Tree dbh Tree dbh Terrestrial
Standard deviation of dbh Terrestrial
Horizontal variation in dbh Terrestrial
Diameter distribution √ Terrestrial
Number of large trees √ Terrestrial
Stand stock Growing stock √ Terrestrial
Forest biomass/carbon density (Above ground biomass/carbon density, changes in biomass/carbon density)
√ Terrestrial
Basal area/volume √ Terrestrial
Tree spacing Tree spacing (number of trees per hector, percentage of trees in clusters)
√ Terrestrial/ RS
Understory vegetation
Herbaceous cover √ Terrestrial
Shrubs cover, & its variation √ Terrestrial
Understorey richness √ Terrestrial
Shrub height Terrestrial
Total understorey cover √ Terrestrial
Forest product harvest
Annual allowable harvest (AAH) of wood & non wood product
20
Actual annual harvest of wood & non wood product
√ Archives/terrestrial/ BI
Number of species harvested √ Archives/BI
Population structure
Population structure (sex ratio, age ratio) Terrestrial
Morphological variability
Within-individual morphological variability Terrestrial
Edaphic factors Substrate & soil variables/soil types √ Terrestrial / lab work Topographic
factors
Altitude, slope & aspect, cliff, outcrops Terrestrial/ RS
Deadwood stock
Deadwood (volume & basal area by decay classes/ diameter class)
Terrestrial/ RS
Volume of coarse woody debris Terrestrial/ RS
Litter biomass or cover √ Terrestrial/ RS
Habitat
Area & proportion of invasive species √ Terrestrial
Function
Demographic processes
Recruitment , survivorship, mortality and turnover rate
Terrestrial
Effect of abiotic disturbances
Areal extent, frequency or return interval, predictability, intensity, severity & seasonality of fire
√ Historical data/ BI interview/ terrestrial/ RS
Areal extent, frequency or return interval, predictability, intensity, severity & seasonality of flood
√ Historical data/ BI interview/ terrestrial/ RS
Areal extent, frequency or return interval, predictability, intensity, severity & seasonality of salinity
√ Historical data/ BI interview/ terrestrial
Areal extent, frequency or return interval, predictability, intensity, severity & seasonality of erosion & other hydrological processes (e.g., drought) etc.
√ Historical data/ BI interview/ terrestrial/ RS
Population dynamics
Metapopulation dynamics Terrestrial
Genetic diversity
Population genetics (see in genetic section) Terrestrial
Effect of biotic disturbances
Damaged by pest & pathogens √ Terrestrial / lab work
Damaged by grazing √ Terrestrial
Area of forest affected by human interventions ( e.g. Controlled burning, forest encroachment, slash-&-burn)
√ Terrestrial/ RS
Population dynamics
Life history Historical data/ BI
Gene flow vectors & mechanism Terrestrial/ DNA analysis
Extinction rate of the key species √ Terrestrial
Phenology Terrestrial
Growth rate (of individuals) √ Terrestrial
Forest resilience Acclimation Terrestrial
Adaptation Terrestrial
Biomass & resource productivity (recovery after disturbance)
√ Terrestrial
Rate of forest growth (Increment rate) √ Terrestrial
Genetic
Composition Genetic
diversity
Allelic diversity √ Lab work/ DNA analysis
Presence of particular rare alleles, deleterious recessives, or karyotypic variants
√ Lab work/ DNA analysis
Structure
Viable population size
Census and effective population size √ Lab work/ DNA analysis
Genetic diversity
Heterozygosity √ Lab work/ DNA analysis
Chromosomal or phenotypic polymorphism Lab work/ DNA analysis
21
Heritability Field trial/ Lab work/ DNA
analysis
Function Genetic
diversity
Inbreeding depression √ Field trial/ Lab work/ DNA
analysis
Outbreeding rate √ Field trial/ Lab work/ DNA
analysis
Natural selection √ Field trial/ Lab work/ DNA
analysis
Rate of genetic drift √ Field trial/ Lab work/ DNA
analysis
Gene flow √ Field trial/ Lab work/ DNA
analysis
Mutation rate √ Field trial/ Lab work/ DNA
analysis
Genetic
Genetic indicators provide the information regarding if the species/ population contain sufficient genetic diversity among and within the population to ensure ongoing evolutionary potential or not. Often the management interventions like logging may lead to the deforestation and isolation of the populations which may eventually lead to the increased inbreeding leading to inbreeding depression, which may eventually override local adaptation as well as genetic drift and loss of genetic variation which can curtail evolutionary potential. Due to the cost involved in the genetic level studies, these are usually restricted to the rare species or commercially valuable species.
3.2
Ranking of indicators by the expert
In the beginning of the second session of the workshop, following the introductory session on the CBD, Aichi biodiversity targets, biodiversity indicators and Clearing House Mechanisms (CHM), the experts were provided with the 10 stickers each and requested to rank indicators (Except indicators at genetic level) based on their personal importance preference. More than one sticker were allowed to be assigned in each indicator based on the weightage given to them.
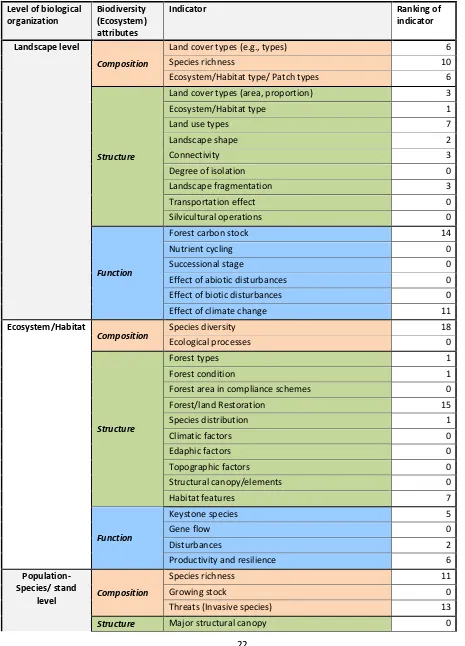
22
function. Out of fifteen, more or less equal numbers of indicators are associated with the three biological organization levels, and three basic functions of the ecosystem.
Table 3: Ranking of indicators by experts participated in the workshop.
Level of biological
Ecosystem/Habitat type/ Patch types 6
Structure
Land cover types (area, proportion) 3
Ecosystem/Habitat type 1
Land use types 7
Landscape shape 2
Connectivity 3
Degree of isolation 0
Landscape fragmentation 3
Transportation effect 0
Silvicultural operations 0
Function
Forest carbon stock 14
Nutrient cycling 0
Successional stage 0
Effect of abiotic disturbances 0
Effect of biotic disturbances 0
Effect of climate change 11
Ecosystem/Habitat
Forest area in compliance schemes 0
Forest/land Restoration 15
Species distribution 1
Productivity and resilience 6
Population-Species/ stand
level Composition
Species richness 11
Growing stock 0
Threats (Invasive species) 13
23
Forest product harvest 1
Population structure 2
Threats (Invasive species) 2
Function
Demographic processes 1
Effect of abiotic disturbances 0
Population dynamics 0
Genetic diversity 2
Effect of biotic disturbances 0
Population dynamics 6
Forest resilience 2
Genetic*
Composition Genetic diversity (e.g., allelic diversity, presence of
particular rare/deleterious recessive alleles)
Structure Viable population size
Genetic diversity (e.g., heterozygosity, heritability)
Function
Genetic diversity (e.g., inbreeding depression, outbreeding rate, natural selection, gene flow, mutation rate)
*Genetic level indicators were not discussed.
3.3
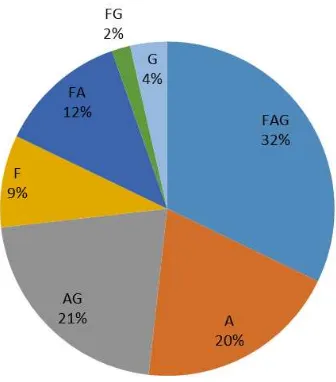
Selection of forest biodiversity indicators relevant to Sumatra Province
Fifty six indicators out of 58 were collectively selected by the expert panels (Table 4). Academia and research expert panel selected the highest number of indicators (48 from the list of 58) as relevant indicators for province level (Table 4, Annex 1). Government agencies expert panel selected 33 indicators for province level forest biodiversity monitoring system (FBMS) (Table 4, Annex 2), while FMU and field
p a titio e s pa el hoose i di ato s fo p o i e le el (Table 4, Annex 3).
24
relevant for the province level by at least two expert panels. Remaining indicators were selected by one of the expert panels (Figure 3). The result shows that nearly two-third of the total forest biodiversity indicators presented in Table 2 were agreed by at least two expert panels.
25
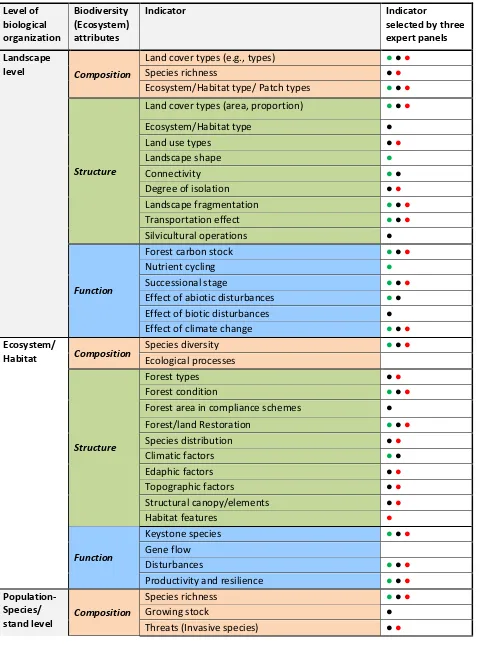
Table 4: List of indicators applicable to Sumatra province level forest biodiversity monitoring system selected by the expert panels.
(● =selected by the FMU, forestry concession and other field level forestry practitioners, ● = selected by the academicians and researchers, ● = selected by the representatives from government agencies)
Level of
Ecosystem/Habitat type/ Patch types ●● ●
Structure
Landscape fragmentation ●● ●
Transportation effect ●● ●
Effect of abiotic disturbances ●●
Effect of biotic disturbances ●
Effect of climate change ●● ●
Forest area in compliance schemes ●
Forest/land Restoration ●● ●
Species distribution ● ●
Climatic factors ●●
Edaphic factors ● ●
Topographic factors ● ●
Structural canopy/elements ● ●
Habitat features ●
Function
Keystone species ●● ●
Gene flow
Disturbances ●● ●
Productivity and resilience ●● ●
Population-26
Major structural canopy ●●
Tree height ●
Habitat suitability ● ●
Threats (Invasive species) ●
Function
Demographic processes ●●
Effect of abiotic disturbances ●● ●
Population dynamics ●
Genetic diversity ●
Effect of biotic disturbances ● ●
Population dynamics ●● ●
Forest resilience ● ●
Genetic*
Composition Genetic diversity (e.g., allelic diversity, presence of
particular rare/deleterious recessive alleles)
Structure Viable population size
Genetic diversity (e.g., heterozygosity, heritability)
Function Genetic diversity (e.g., inbreeding depression,
outbreeding rate, gene flow, mutation rate) *Genetic level indicators were not discussed.
3.4
Selection of forest biodiversity indicators relevant to forest management units
27
All of the three panels applied the three-layered filters (Figure 2) to select the highly rewarding forest biodiversity indicators applicable for forest management unit level biodiversity monitoring system (see section below).
3.5 Selection of highly rewarding indicators applicable to FMU level forest
biodiversity monitoring system
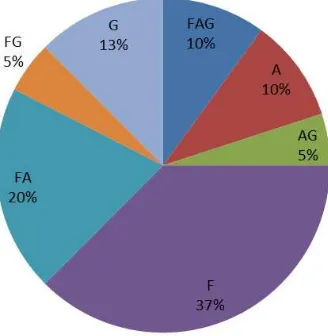
At the FMU level forest biodiversity monitoring, after applying the initial, primary and secondary filters,
collectively, 40 indicators were selected as highly rewarding/ high performance indicators (Table 5). The highly rewarding/high-performance indicators are those which were screened by all of the three sets of filters described in Figure 2.
Out of the 40 indicators, four indicators were common to all of the expert panels. Land cover types, land use types, forest and forest land restoration, and species richness were the four highly emphasized indicators. Those indicators were also highly preferred during the indicator ranking session (Section 3.2, Table 3). There were 12 indicators common to at least two expert panels. They include species richness, keystone species, landscape fragmentation, effect of climate change, land cover types (area, proportion), forest carbon stock, forest types, forest condition, invasive species, tree height, tree dbh and stand stock. Remaining indicators were selected by at least one of the panels.
28
The expert panel constituting the representatives from FMUs, forestry concessions and other field level forestry professionals selected the highest number of indicators (29 from the list of 58, i.e., 50% of the total forest biodiversity indicators presented in Table 2) as rewarding/high-performance indicators applicable to FMU level (Table 5, Annex 3). The expert panel suggested that the FMUs existing financial/ technical capacities are limited and thus external supports are needed, to monitor the selected 10 indicators (out of 29). They included species richness, forest types, forest condition, forest/ forest land restoration, species distribution, climatic factors, edaphic factors, keystone species, growing stock and genetic diversity (Annex 3). Rewarding indicators that the FMUs are able to monitor with the existing financial and technical capabilities are: land cover types, land cover (area, proportion), land use types, forest carbon stock, species diversity, topographic factors, species richness, invasive species, tree height, tree dbh, stand stock, tree spacing, understorey vegetation, forest product harvest, population structure, edaphic factors, topographic factors, and population dynamics.
Table 5: List of highly rewarding/high-performance indicators applicable to forest management units (FMUs) selected by the experts panels.
(● =selected by the FMU, forestry concession and other field level forestry practitioners, ● = selected by the academicians and researchers, ● = selected by the representatives from government agencies)
Level of
Ecosystem/Habitat type/ Patch types ●
Structure
Land cover types (area, proportion ●●
Ecosystem/Habitat type ●
Land use types ●● ●
Landscape shape
Connectivity
Degree of isolation
Landscape fragmentation ● ●
Transportation effect
Effect of abiotic disturbances ●
29
Forest area in compliance schemes ●
Forest/land Restoration ●● ●
Effect of abiotic disturbances ●
Population dynamics ●
Genetic diversity ●
Effect of biotic disturbances ●
Population dynamics
Forest resilience ●
Genetic*
Composition Genetic diversity (e.g., allelic diversity, presence of
particular rare/deleterious recessive alleles)
Structure Viable population size
Genetic diversity (e.g., heterozygosity, heritability)
Function Genetic diversity (e.g., inbreeding depression,
outbreeding rate, gene flow, mutation rate)
30
4.
Application of the highly rewarding indicators establishing a
participatory forest biodiversity monitoring system at FMU level
Conservation and maintenance of forest biological diversity is one of the seven essential elements (components) of SFM2, and forest biodiversity indicators are quantitative, qualitative or descriptive attributes for assessing and monitoring the element. When measured and monitored periodically, the indicators show changes and trends in the component. A time series of the values of any measurable or clearly descriptive forest biodiversity indicator provides the information on the direction of change, either towards or away from SFM from ecological perspective.
Although the o e all sustai a ilit of a atio s fo ests depe ds su sta tiall o a tions taken at the national scale, in principle, the national-level analysis of indicators may involve the aggregation of data collected at the FMU scale. Therefore, analysis of indicators at the FMU scale is the key to assessing, monitoring and reporting on SFM (ITTO, 2016). Thus, a monitoring tool, that allows the FMU and local stakeholders to track the progress towards the goal of sustainability, is essential.
Conservation and maintenance of forest biological diversity is one of the seven essential elements (components) of SFM3, and forest biodiversity indicators are quantitative, qualitative or descriptive attributes for assessing and monitoring the element. When measured and monitored periodically, the indicators show changes and trends in the component. A time series of the values of any measurable or clearly descriptive forest biodiversity indicator provides the information on the direction of change, either towards or away from SFM from ecological perspective. The purpose of forest biodiversity monitoring to pilot case study at FMU level is to derive lessons for improving management practices that promotes the biodiversity conservation while maximizing the value of forest products and the services that forests
p o ide. Mai tai i g iodi e sit i the FMUs fo est a eas is o e of the fo uses of BIOCLIME s suppo t i
South Sumatra.
Forest management unit can be defined as a specified operational forest area with permanently demarcated forest boundaries, managed by a legall esta lished lo alized od alled Kesatua
Pe gelolaa Huta o KPH ith a set of e pli it e o o i , so ial a d e ologi al o je ti es e p essed i a
self-contained multi-year and long-term forest management plan (FMP). The forest managing body is also
2
Enabling conditins; Extent and conditions of forests; Forest ecosystem and health; Forest production; Biodiversity; Soil and watwer protection; and Economic, social and cultural aspects.
3
31
called FMU, and is responsible for ensuring that SFM is implemented. In Indonesia, based on the dominant forest types/forest functions, the FMU is categorized as: Conservation FMU (KPHK), Protection FMU (KPHL), and Production FMU (KPHP).
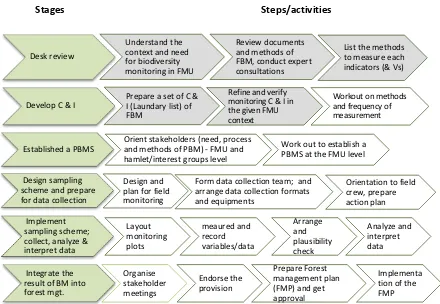
Figure 5 below presents a simple-to-use toolkit for a participatory forest biodiversity monitoring, which is divided into six stages (adapted from ANSAB, 2010). The stages are described briefly in the following section.
Figure 5: Stages of participatory forest biodiversity monitoring (Adopted from ANSAB, 2010). Steps/activities are accomplished during the BICAMSu project phase are shaded.
Stage 1. Desk review
Gather basic information about the FMUs where the management is planning to conduct biodiversity monitoring, and understand the context and need for forest biodiversity monitoring in the FMU.
For forest biodiversity monitoring to be meaningful, clear understanding of the goal and objective (what and why?) of the monitoring is necessary. For instance, in a managed forest (i.e., Production FMU), purpose of monitoring could be to minimize the impact of management interventions on the forest biodiversity and the ecological processes. Monitoring in the protected areas or conservation
Desk review
Work out to establish a PBMS at the FMU level
Design sampling scheme and prepare for data collection
32
areas, for example KPHK and KPHL, could be to assess particular sets of species, or particular elements of biodiversity or ecological integrity as a whole. Ecological integrity is defined as the capacity of ecosystem to support and maintain a community of organization that has structural, compositional and functional organization comparable to that of similar yet undisturbed ecosystem. Once the purpose of the monitoring is clear, next step would be the formulations of specific questions to be answered by monitoring. These questions are formulated based on the identified goal and objective. For instance we might want to explore if the management practice are against agreed standards and goal of the sustainable forest management or not? If it is so, they might still have impact on biodiversity. The indicator selected should link the changes in the biodiversity with the management impacts.
Other required information might include: lo al stakeholde s i te est o iodi e sit o ito i g, benefits of the monitoring, extent and condition of forests (for example, forest types and distribution, forest area under each forest type, extent of forests committed to production and protection, FMP, forest area in compliance schemes, change in forested area, forest condition), information related to forest ecosystem health and resilience (for example, threats to forests – drivers and pressures, invasive species, area of degraded forest or forest land, area of degraded forest or forest land restored), information on forest production (e.g., forest inventory, forest growth and yield, actual and allowable of wood and non-wood product harvest, forest product harvesting and tracking system or control mechanism, RIL and silvicultural operations), forest biological diversity (area of protected forest, species diversity, threatened forest-dependent species, procedures for conserving tree species diversity, biodiversity conservation measures), use of forest products and the services provided by the forests (type, pattern), participation of local communities and other stakeholders in forest management, existing forest monitoring system, mechanisms for the equitable sharing of the costs and benefits of forest management, control of illegal logging, availability of professionals and technical personnel to perform and support forest management including biodiversity monitoring, capacity building and workforce for forest management, and dependency of local communities on forest for their livelihoods.
Prepare a list of experts with whom consultation about biodiversity monitoring would be necessary and useful.
33
to assess/measure the indicators and verifiers, potential sources of information related to the indicators and verifiers.
Based on the review, prepare a list and review the specific methods for measuring and assessing each of the C & I.
Stage 2. Develop criteria and indicators for a for biodiversity monitoring system
Prepare a list or set of Criteria and Indicators for forest biodiversity monitoring system (Please see Section 2.1 and 2.2 of Chapter 2). Selection of forest biodiversity indicators also guided by the forest biodiversity management approach we adopt. To discuss about the forest biodiversity monitoring approaches is out of the scope of this report.4
Selecting rewarding and high performance indicators from the (laundry) list. A stakeholder workshop can be organized to refine the C & I at the local context involving participants from forest management unit (FMU), representatives from interest groups (traditional users, NTFP collectors, entrepreneurs etc.), government agencies, forestry practitioners/ professionals working for I/NGOs, private companies related to forest conservation and management, representatives from CBOs and civil society organizations, civil society and academic and research institutions. Frameworks suggested by Gardner (2010) are very useful to refine the C&I at the FMU context. The frameworks include different selection filter: Indicator viability, indicators responsiveness to the forest management impact, cost effectiveness (e.g., cost of data collection and processing), relevance to biodiversity conservation goals, and generality of application, cross-taxon representation and prior ecological knowledge of a species group. The process of refining indicators to the local context using a participatory approach (through stakeholder workshop) is presented in Section 2.3 and 2.4 of Chapter 2.
Workout on methods and frequency of measurement and monitoring for the selected indicators and their verifiers (For the examples, see Table 1 and references mentioned in the Table for the methods)
4
Implementation monitoring approach for assessment of management activities needs management process
indicators. Effectiveness monitoring approach to assess the performance with respect to forest structure and
function requires structural and ecological process indicators. Meanwhile, if the effectiveness monitoring approach is
to assess the performance with respect to biodiversity, we need to involve biological indicators (environmental,
biodiversity and ecological indicators) and target species. If the FMU management want to improve the understanding
of the processes that link changes in forest management practices to changes in biodiversity via intermediate changes
in the structure and function of forest (i.e., evaluation of cause-effect relationship), validation monitoring approach
accompanied with long term research is to be adopted. The approach involves indicators of all types – management
34
Stage 3. Establish a participatory forest biodiversity monitoring system
The participation of local people; FMU-level forestry practitioners, decision-makers, and managers; and other range of relevant stakeholders, for example, prevailing and concerned research and academic institutions; and community based organizations in forest biodiversity monitoring is crucial not only for local legitimacy and ownership of the entire processes but also for the acceptance of the outcomes of the processes.
Orientation for biodiversity monitoring: Organize orientation sessions for biodiversity monitoring for the FMU personnel who did not participate in the stakeholder workshop described in Stage 2. In the sessions, the FMU ensures the participation of major forest stakeholders including interest groups as described earlier and/or as identified in the FMU Forest Management Plan. The content of the sessions include: defining biodiversity and biodiversity monitoring, objectives and need of and benefits from biodiversity monitoring, activities to achieve the objectives, need for participatory biodiversity monitoring, and obligations and roles of each stakeholder to establish, implement and monitoring the system.
Organize a workshop to form a system of biodiversity monitoring. Major points/agenda that need to be discussed and decided during the workshop might include:
o Decide what to monitor: Identify and decide resources and habitats to be monitored under the monitoring program
protection/conservation area of high social and economic importance
high conservation value forest species
focal species, for example, area-limited, dispersal-limited, resource-limited, process-limited species, and keystone species
target species of particular conservation such as endemic, threatened, rare and endangered species
target species of management concern, e.g., invasive species, pest species that may have significant impacts on local biodiversity
species of economic and cultural importance for local people, for example, NTFP species
flagship species, e.g., rhino, tiger, orangutan
35
o Prioritize the threat using agreed criteria, for example, area coverage, intensity, frequency, urgency and feasibility)
o Decide which forest management practices are to be monitored (if one of the objectives of biodiversity monitoring is to improve the understanding of the processes that link changes in forest management to changes in biodiversity).
o Build a competent monitoring team under the leadership of the FMU
o FMU identifies the methods for the measurement of C&I and verifiers in support of the experts
o Decide the time schedule for the field work
o Discuss and determine the facilities, required equipment and benefits for the team o Determine how to cover the cost of forest biodiversity monitoring
FMU itself?
Intended contributions from forestry concessions, private entrepreneurs and other stakeholders?
Possible support from other governmental, non-government organizations, conservation NGOs?
o Arrange experts and logistics for data collection and analysis
Capacity building of FMU and stakeholders – to prepare local resource persons
Seek support from other governmental, non-government organizations, conservation NGOs in the beginning and for short-term?
o Discuss and endorse the outputs and decisions of the workshop by the FMU and/or competent authority
Stage 4. Design a sampling scheme; and develop a plan and prepare for data collection
Forest biodiversity monitoring should not be perceived as blind data gathering. But, in part, it has been so (Noss, 1990). A proper field sampling design to collect representative samples from the targeted population in the field is crucial for a biodiversity monitoring system.
Select monitoring sites for identified questions and objectives, and design/ choose sampling design (sampling type, e.g., randomized systematic sampling; sampling intensity - high or low intensive) Carefully developed data collection scheme – which is crucial for effective and efficient fieldwork. Form a data collection team (or an inventory crew), in general, of 5-7 members, specifying role/